
|
|||||
|
 | |
| |
| |
| |
| |
| |
|
Gene: CMTM8 |
Gene summary for CMTM8 |
| Gene information | Species | Human | Gene symbol | CMTM8 | Gene ID | 152189 |
| Gene name | CKLF like MARVEL transmembrane domain containing 8 | |
| Gene Alias | CKLFSF8 | |
| Cytomap | 3p22.3 | |
| Gene Type | protein-coding | GO ID | GO:0006935 | UniProtAcc | Q8IZV2 |
Top |
Malignant transformation analysis |
| Identification of the aberrant gene expression in precancerous and cancerous lesions by comparing the gene expression of stem-like cells in diseased tissues with normal stem cells |
| Entrez ID | Symbol | Replicates | Species | Organ | Tissue | Adj P-value | Log2FC | Malignancy |
| 152189 | CMTM8 | LZE5T | Human | Esophagus | ESCC | 6.36e-09 | 3.39e-01 | 0.0514 |
| 152189 | CMTM8 | LZE20T | Human | Esophagus | ESCC | 3.88e-05 | 1.21e-01 | 0.0662 |
| 152189 | CMTM8 | LZE22T | Human | Esophagus | ESCC | 1.03e-04 | 4.85e-01 | 0.068 |
| 152189 | CMTM8 | LZE24T | Human | Esophagus | ESCC | 3.71e-13 | 3.50e-01 | 0.0596 |
| 152189 | CMTM8 | P2T-E | Human | Esophagus | ESCC | 5.67e-15 | 1.36e-01 | 0.1177 |
| 152189 | CMTM8 | P4T-E | Human | Esophagus | ESCC | 1.44e-32 | 8.26e-01 | 0.1323 |
| 152189 | CMTM8 | P5T-E | Human | Esophagus | ESCC | 6.60e-13 | 3.27e-01 | 0.1327 |
| 152189 | CMTM8 | P8T-E | Human | Esophagus | ESCC | 4.34e-28 | 5.91e-01 | 0.0889 |
| 152189 | CMTM8 | P9T-E | Human | Esophagus | ESCC | 1.98e-10 | 2.80e-01 | 0.1131 |
| 152189 | CMTM8 | P10T-E | Human | Esophagus | ESCC | 1.57e-20 | 3.79e-01 | 0.116 |
| 152189 | CMTM8 | P11T-E | Human | Esophagus | ESCC | 5.65e-03 | 1.89e-01 | 0.1426 |
| 152189 | CMTM8 | P12T-E | Human | Esophagus | ESCC | 1.59e-25 | 4.43e-01 | 0.1122 |
| 152189 | CMTM8 | P15T-E | Human | Esophagus | ESCC | 1.24e-11 | 3.43e-01 | 0.1149 |
| 152189 | CMTM8 | P16T-E | Human | Esophagus | ESCC | 4.40e-39 | 7.40e-01 | 0.1153 |
| 152189 | CMTM8 | P21T-E | Human | Esophagus | ESCC | 5.85e-08 | 1.89e-01 | 0.1617 |
| 152189 | CMTM8 | P22T-E | Human | Esophagus | ESCC | 2.43e-09 | 2.37e-01 | 0.1236 |
| 152189 | CMTM8 | P23T-E | Human | Esophagus | ESCC | 9.99e-31 | 9.88e-01 | 0.108 |
| 152189 | CMTM8 | P24T-E | Human | Esophagus | ESCC | 6.24e-20 | 4.74e-01 | 0.1287 |
| 152189 | CMTM8 | P26T-E | Human | Esophagus | ESCC | 7.81e-47 | 7.78e-01 | 0.1276 |
| 152189 | CMTM8 | P27T-E | Human | Esophagus | ESCC | 2.76e-22 | 3.76e-01 | 0.1055 |
| Page: 1 2 3 4 5 6 |
| Tissue | Expression Dynamics | Abbreviation |
| Esophagus | 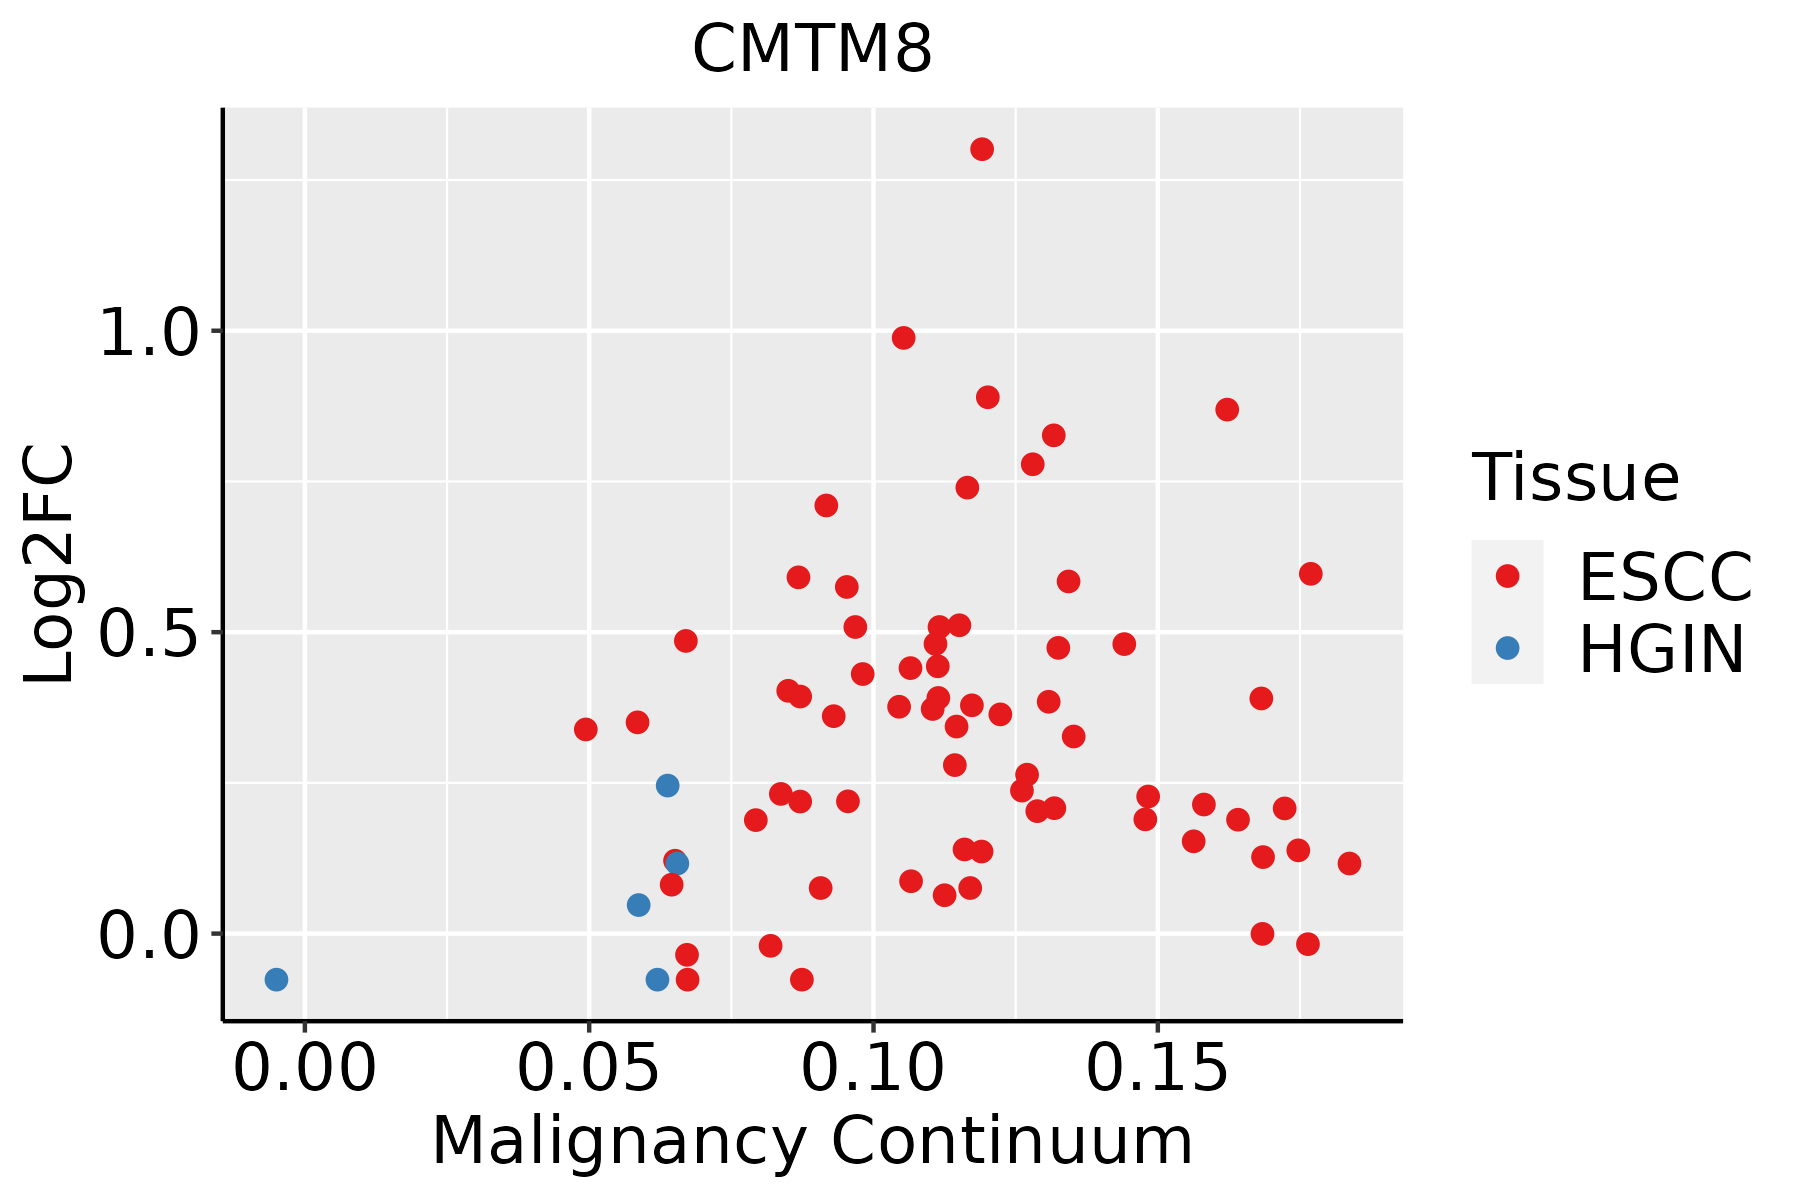 | ESCC: Esophageal squamous cell carcinoma |
| HGIN: High-grade intraepithelial neoplasias | ||
| LGIN: Low-grade intraepithelial neoplasias | ||
| Liver | 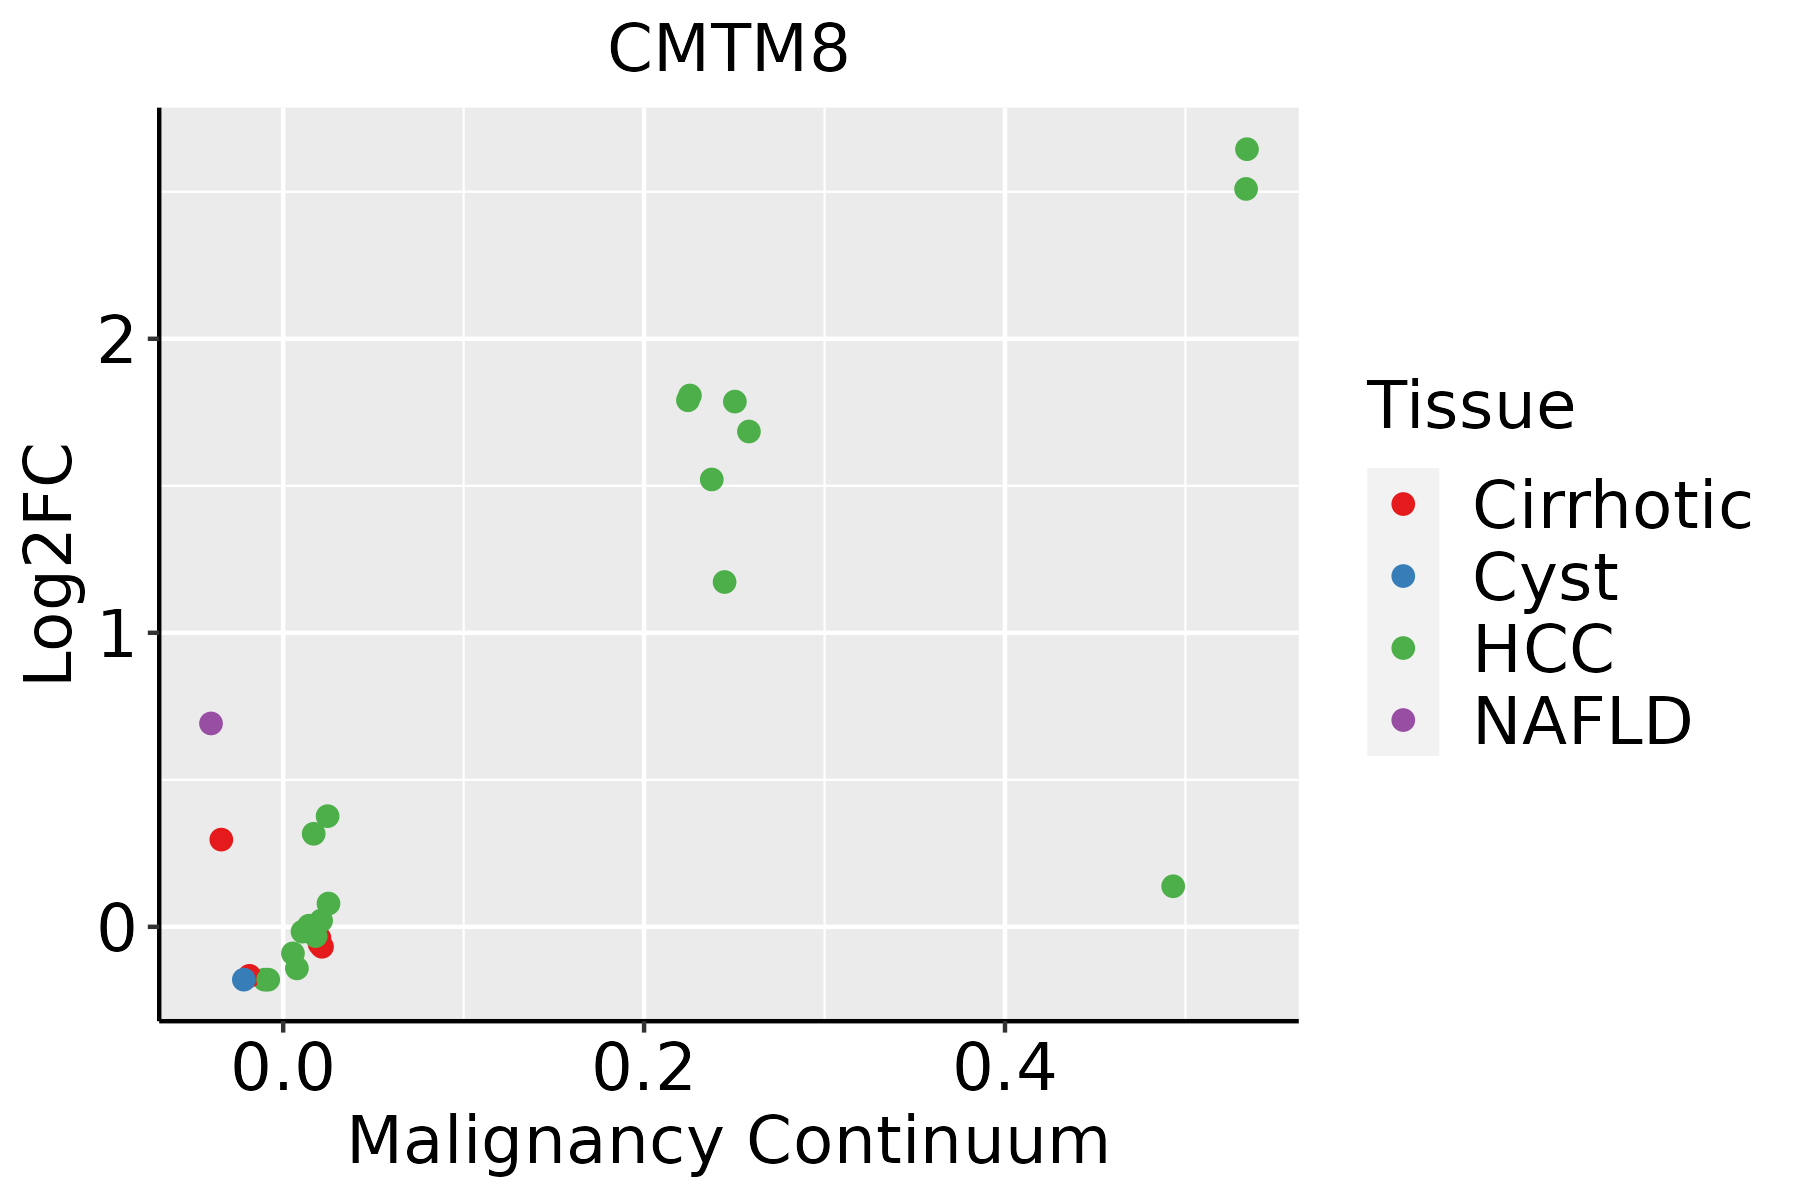 | HCC: Hepatocellular carcinoma |
| NAFLD: Non-alcoholic fatty liver disease | ||
| Lung | 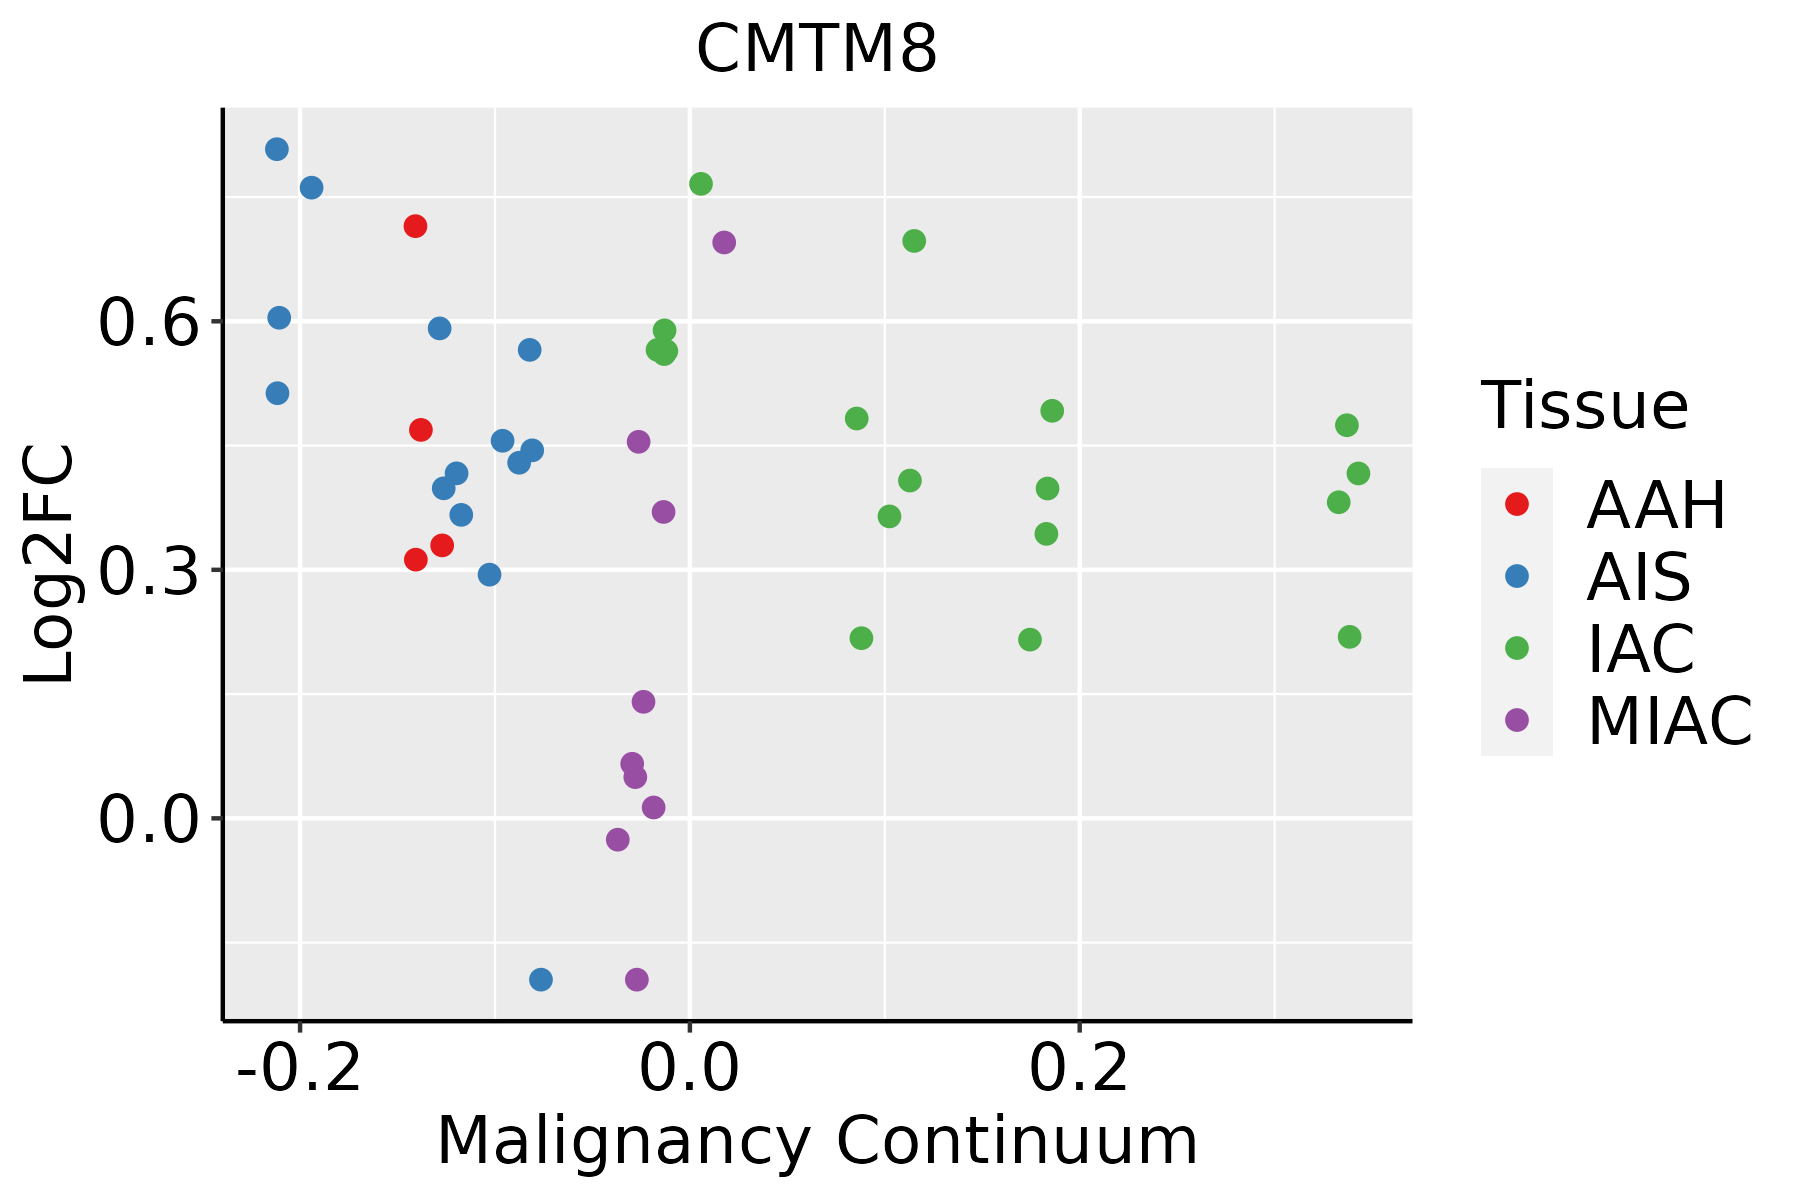 | AAH: Atypical adenomatous hyperplasia |
| AIS: Adenocarcinoma in situ | ||
| IAC: Invasive lung adenocarcinoma | ||
| MIA: Minimally invasive adenocarcinoma | ||
| Oral Cavity | 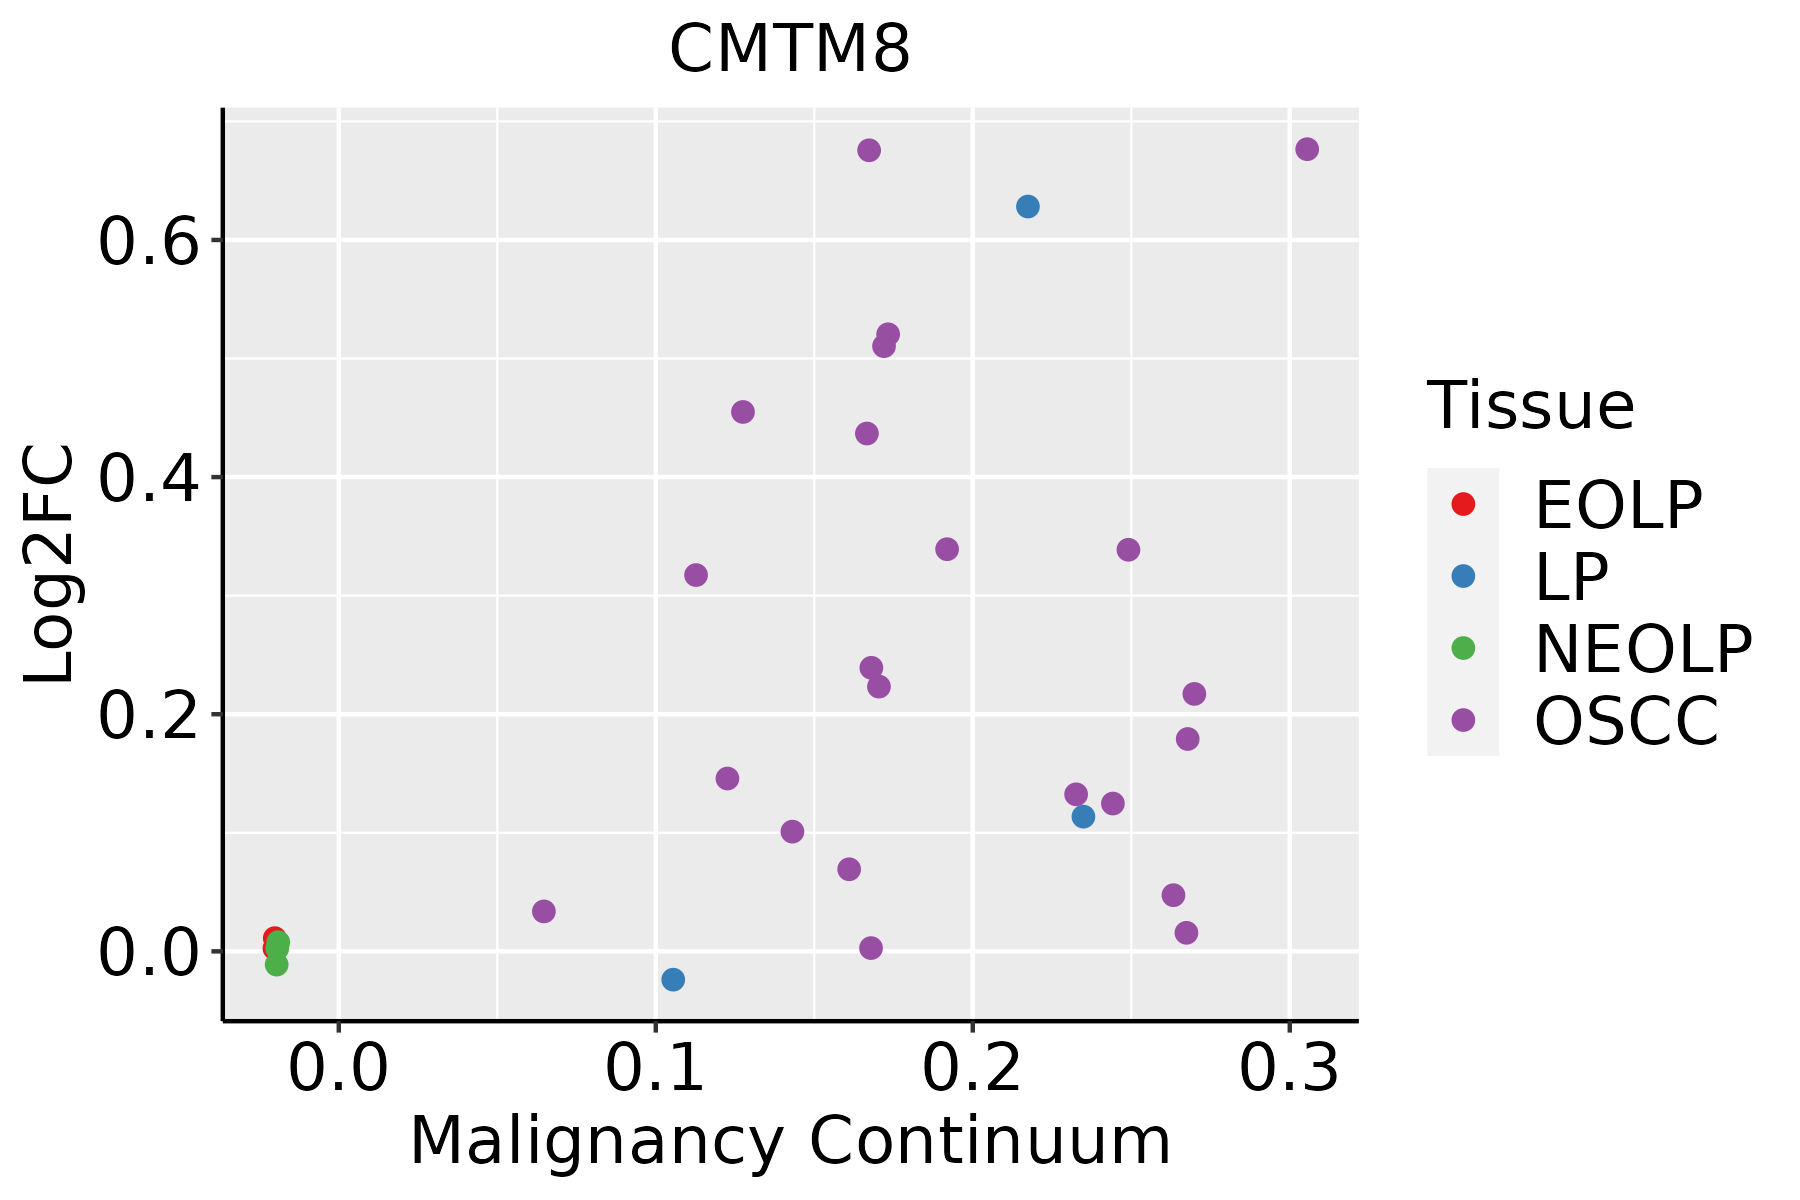 | EOLP: Erosive Oral lichen planus |
| LP: leukoplakia | ||
| NEOLP: Non-erosive oral lichen planus | ||
| OSCC: Oral squamous cell carcinoma | ||
| Thyroid | 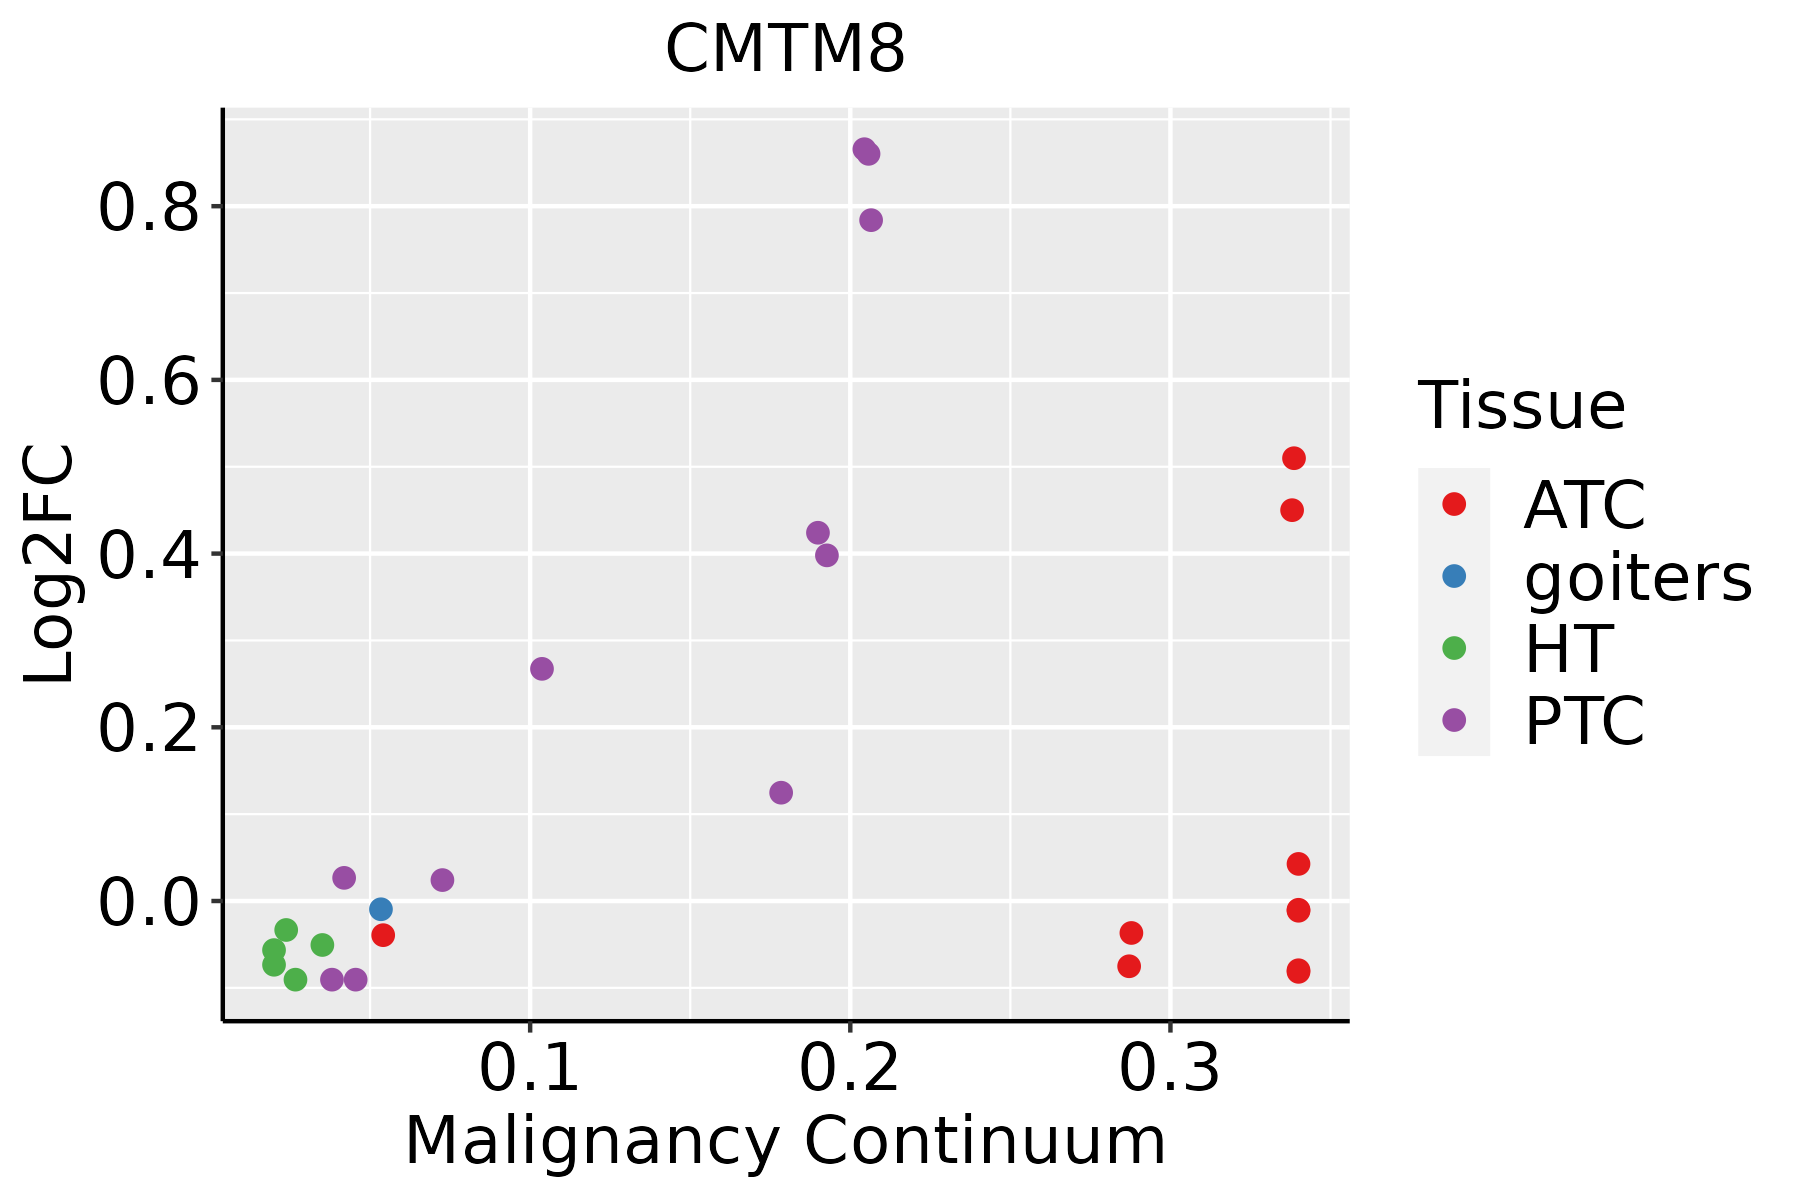 | ATC: Anaplastic thyroid cancer |
| HT: Hashimoto's thyroiditis | ||
| PTC: Papillary thyroid cancer |
| ∗log2FC in expression of this searched gene in stem-like cells from each diseased tissue sample relative to stem-like cells in normal samples in each tissue plotted against the malignancy continuum. Samples are colored based on if they are from different disease stage. |
Top |
Malignant transformation related pathway analysis |
| Find out the enriched GO biological processes and KEGG pathways involved in transition from healthy to precancer to cancer |
| Tissue | Disease Stage | Enriched GO biological Processes |
| Colorectum | AD |  |
| Colorectum | SER |  |
| Colorectum | MSS |  |
| Colorectum | MSI-H |  |
| Colorectum | FAP |  |
| ∗Top 15 enriched GO BP terms are showed in the bar plot of each disease state in each tissue. Each row represents a significant GO biological process which is colored according to the -log10(p.adjust). |
| Page: 1 2 3 4 5 6 7 8 9 |
| GO ID | Tissue | Disease Stage | Description | Gene Ratio | Bg Ratio | pvalue | p.adjust | Count |
| GO:00425524 | Esophagus | ESCC | myelination | 85/8552 | 134/18723 | 2.51e-05 | 2.13e-04 | 85 |
| GO:00072724 | Esophagus | ESCC | ensheathment of neurons | 86/8552 | 136/18723 | 2.68e-05 | 2.24e-04 | 86 |
| GO:00083664 | Esophagus | ESCC | axon ensheathment | 86/8552 | 136/18723 | 2.68e-05 | 2.24e-04 | 86 |
| GO:0042552 | Liver | Cirrhotic | myelination | 46/4634 | 134/18723 | 8.04e-03 | 3.77e-02 | 46 |
| GO:0007272 | Liver | Cirrhotic | ensheathment of neurons | 46/4634 | 136/18723 | 1.08e-02 | 4.75e-02 | 46 |
| GO:0008366 | Liver | Cirrhotic | axon ensheathment | 46/4634 | 136/18723 | 1.08e-02 | 4.75e-02 | 46 |
| GO:00072721 | Liver | HCC | ensheathment of neurons | 72/7958 | 136/18723 | 8.87e-03 | 3.44e-02 | 72 |
| GO:00083661 | Liver | HCC | axon ensheathment | 72/7958 | 136/18723 | 8.87e-03 | 3.44e-02 | 72 |
| GO:00425521 | Liver | HCC | myelination | 71/7958 | 134/18723 | 9.08e-03 | 3.49e-02 | 71 |
| GO:00072723 | Oral cavity | OSCC | ensheathment of neurons | 72/7305 | 136/18723 | 6.59e-04 | 3.70e-03 | 72 |
| GO:00083663 | Oral cavity | OSCC | axon ensheathment | 72/7305 | 136/18723 | 6.59e-04 | 3.70e-03 | 72 |
| GO:00425523 | Oral cavity | OSCC | myelination | 71/7305 | 134/18723 | 6.93e-04 | 3.86e-03 | 71 |
| GO:00425526 | Thyroid | ATC | myelination | 62/6293 | 134/18723 | 1.54e-03 | 7.84e-03 | 62 |
| GO:00072726 | Thyroid | ATC | ensheathment of neurons | 62/6293 | 136/18723 | 2.39e-03 | 1.11e-02 | 62 |
| GO:00083666 | Thyroid | ATC | axon ensheathment | 62/6293 | 136/18723 | 2.39e-03 | 1.11e-02 | 62 |
| Page: 1 |
| Pathway ID | Tissue | Disease Stage | Description | Gene Ratio | Bg Ratio | pvalue | p.adjust | qvalue | Count |
| Page: 1 |
Top |
Cell-cell communication analysis |
| Identification of potential cell-cell interactions between two cell types and their ligand-receptor pairs for different disease states |
| Ligand | Receptor | LRpair | Pathway | Tissue | Disease Stage |
| Page: 1 |
Top |
Single-cell gene regulatory network inference analysis |
| Find out the significant the regulons (TFs) and the target genes of each regulon across cell types for different disease states |
| TF | Cell Type | Tissue | Disease Stage | Target Gene | RSS | Regulon Activity |
| ∗The dot plots of a searched regulon are shown for all cell subpopulations in each disease state of each tissue based on the regulon specific score inferred using pySCENIC and by calculating the average expression. |
| Page: 1 |
Top |
Somatic mutation of malignant transformation related genes |
| Annotation of somatic variants for genes involved in malignant transformation |
| Hugo Symbol | Variant Class | Variant Classification | dbSNP RS | HGVSc | HGVSp | HGVSp Short | SWISSPROT | BIOTYPE | SIFT | PolyPhen | Tumor Sample Barcode | Tissue | Histology | Sex | Age | Stage | Therapy Types | Drugs | Outcome |
| CMTM8 | deletion | Frame_Shift_Del | c.259delN | p.Phe87SerfsTer6 | p.F87Sfs*6 | Q8IZV2 | protein_coding | TCGA-D8-A27V-01 | Breast | breast invasive carcinoma | Female | <65 | I/II | Hormone Therapy | tamoxiphen | SD | |||
| CMTM8 | SNV | Missense_Mutation | novel | c.73A>G | p.Thr25Ala | p.T25A | Q8IZV2 | protein_coding | tolerated(0.52) | benign(0) | TCGA-2W-A8YY-01 | Cervix | cervical & endocervical cancer | Female | <65 | I/II | Chemotherapy | cisplatin | CR |
| CMTM8 | SNV | Missense_Mutation | c.308N>A | p.Pro103His | p.P103H | Q8IZV2 | protein_coding | deleterious(0) | probably_damaging(0.998) | TCGA-AZ-6601-01 | Colorectum | colon adenocarcinoma | Male | >=65 | I/II | Unknown | Unknown | PD | |
| CMTM8 | SNV | Missense_Mutation | c.259N>G | p.Phe87Val | p.F87V | Q8IZV2 | protein_coding | deleterious(0.02) | possibly_damaging(0.676) | TCGA-G4-6309-01 | Colorectum | colon adenocarcinoma | Female | <65 | III/IV | Chemotherapy | xeloda | PD | |
| CMTM8 | SNV | Missense_Mutation | rs150764905 | c.368N>T | p.Ala123Val | p.A123V | Q8IZV2 | protein_coding | tolerated(0.09) | benign(0.104) | TCGA-A5-A0GH-01 | Endometrium | uterine corpus endometrioid carcinoma | Female | <65 | I/II | Unknown | Unknown | SD |
| CMTM8 | SNV | Missense_Mutation | novel | c.277N>C | p.Thr93Pro | p.T93P | Q8IZV2 | protein_coding | tolerated(0.05) | probably_damaging(0.943) | TCGA-A5-A1OF-01 | Endometrium | uterine corpus endometrioid carcinoma | Female | <65 | I/II | Unknown | Unknown | SD |
| CMTM8 | SNV | Missense_Mutation | rs142284590 | c.205N>A | p.Ala69Thr | p.A69T | Q8IZV2 | protein_coding | tolerated(0.05) | benign(0.408) | TCGA-A5-A2K5-01 | Endometrium | uterine corpus endometrioid carcinoma | Female | >=65 | I/II | Unknown | Unknown | SD |
| CMTM8 | SNV | Missense_Mutation | novel | c.121N>T | p.Pro41Ser | p.P41S | Q8IZV2 | protein_coding | tolerated(0.57) | possibly_damaging(0.741) | TCGA-AP-A059-01 | Endometrium | uterine corpus endometrioid carcinoma | Female | >=65 | I/II | Unknown | Unknown | SD |
| CMTM8 | SNV | Missense_Mutation | rs142284590 | c.205G>A | p.Ala69Thr | p.A69T | Q8IZV2 | protein_coding | tolerated(0.05) | benign(0.408) | TCGA-AX-A0J1-01 | Endometrium | uterine corpus endometrioid carcinoma | Female | >=65 | I/II | Unknown | Unknown | SD |
| CMTM8 | SNV | Missense_Mutation | c.247N>T | p.Leu83Phe | p.L83F | Q8IZV2 | protein_coding | deleterious(0) | probably_damaging(0.999) | TCGA-AX-A1CE-01 | Endometrium | uterine corpus endometrioid carcinoma | Female | <65 | I/II | Unspecific | Paclitaxel | SD |
| Page: 1 2 3 |
Top |
Related drugs of malignant transformation related genes |
| Identification of chemicals and drugs interact with genes involved in malignant transfromation |
| (DGIdb 4.0) |
| Entrez ID | Symbol | Category | Interaction Types | Drug Claim Name | Drug Name | PMIDs |
| 152189 | CMTM8 | NA | methylphenidate | METHYLPHENIDATE | 29382897 |
| Page: 1 |

Copyright 2023-Present -The University of Texas Health Science Center at Houston |