
|
|||||
|
 | |
| |
| |
| |
| |
| |
|
Gene: CMTM7 |
Gene summary for CMTM7 |
| Gene information | Species | Human | Gene symbol | CMTM7 | Gene ID | 112616 |
| Gene name | CKLF like MARVEL transmembrane domain containing 7 | |
| Gene Alias | CKLFSF7 | |
| Cytomap | 3p22.3 | |
| Gene Type | protein-coding | GO ID | GO:0001775 | UniProtAcc | A0A024R2L3 |
Top |
Malignant transformation analysis |
| Identification of the aberrant gene expression in precancerous and cancerous lesions by comparing the gene expression of stem-like cells in diseased tissues with normal stem cells |
| Entrez ID | Symbol | Replicates | Species | Organ | Tissue | Adj P-value | Log2FC | Malignancy |
| 112616 | CMTM7 | P8T-E | Human | Esophagus | ESCC | 5.72e-29 | 7.39e-01 | 0.0889 |
| 112616 | CMTM7 | P9T-E | Human | Esophagus | ESCC | 6.53e-04 | 1.13e-01 | 0.1131 |
| 112616 | CMTM7 | P12T-E | Human | Esophagus | ESCC | 7.89e-07 | 9.97e-02 | 0.1122 |
| 112616 | CMTM7 | P16T-E | Human | Esophagus | ESCC | 1.90e-14 | 3.18e-01 | 0.1153 |
| 112616 | CMTM7 | P21T-E | Human | Esophagus | ESCC | 3.28e-21 | 6.13e-01 | 0.1617 |
| 112616 | CMTM7 | P27T-E | Human | Esophagus | ESCC | 2.83e-08 | 1.34e-01 | 0.1055 |
| 112616 | CMTM7 | P37T-E | Human | Esophagus | ESCC | 4.39e-15 | 4.07e-01 | 0.1371 |
| 112616 | CMTM7 | P38T-E | Human | Esophagus | ESCC | 1.90e-05 | 4.92e-01 | 0.127 |
| 112616 | CMTM7 | P39T-E | Human | Esophagus | ESCC | 3.65e-10 | 3.17e-01 | 0.0894 |
| 112616 | CMTM7 | P40T-E | Human | Esophagus | ESCC | 1.90e-06 | 2.78e-01 | 0.109 |
| 112616 | CMTM7 | P44T-E | Human | Esophagus | ESCC | 1.46e-04 | 2.60e-01 | 0.1096 |
| 112616 | CMTM7 | P49T-E | Human | Esophagus | ESCC | 4.95e-02 | 6.22e-01 | 0.1768 |
| 112616 | CMTM7 | P52T-E | Human | Esophagus | ESCC | 2.26e-08 | 3.01e-01 | 0.1555 |
| 112616 | CMTM7 | P54T-E | Human | Esophagus | ESCC | 3.98e-18 | 5.27e-01 | 0.0975 |
| 112616 | CMTM7 | P56T-E | Human | Esophagus | ESCC | 2.45e-03 | 5.62e-01 | 0.1613 |
| 112616 | CMTM7 | P57T-E | Human | Esophagus | ESCC | 1.08e-12 | 3.75e-01 | 0.0926 |
| 112616 | CMTM7 | P61T-E | Human | Esophagus | ESCC | 3.74e-13 | 3.72e-01 | 0.099 |
| 112616 | CMTM7 | P74T-E | Human | Esophagus | ESCC | 2.55e-13 | 4.40e-01 | 0.1479 |
| 112616 | CMTM7 | P75T-E | Human | Esophagus | ESCC | 3.66e-50 | 1.04e+00 | 0.1125 |
| 112616 | CMTM7 | P76T-E | Human | Esophagus | ESCC | 1.30e-52 | 1.23e+00 | 0.1207 |
| Page: 1 2 3 |
| Tissue | Expression Dynamics | Abbreviation |
| Esophagus | 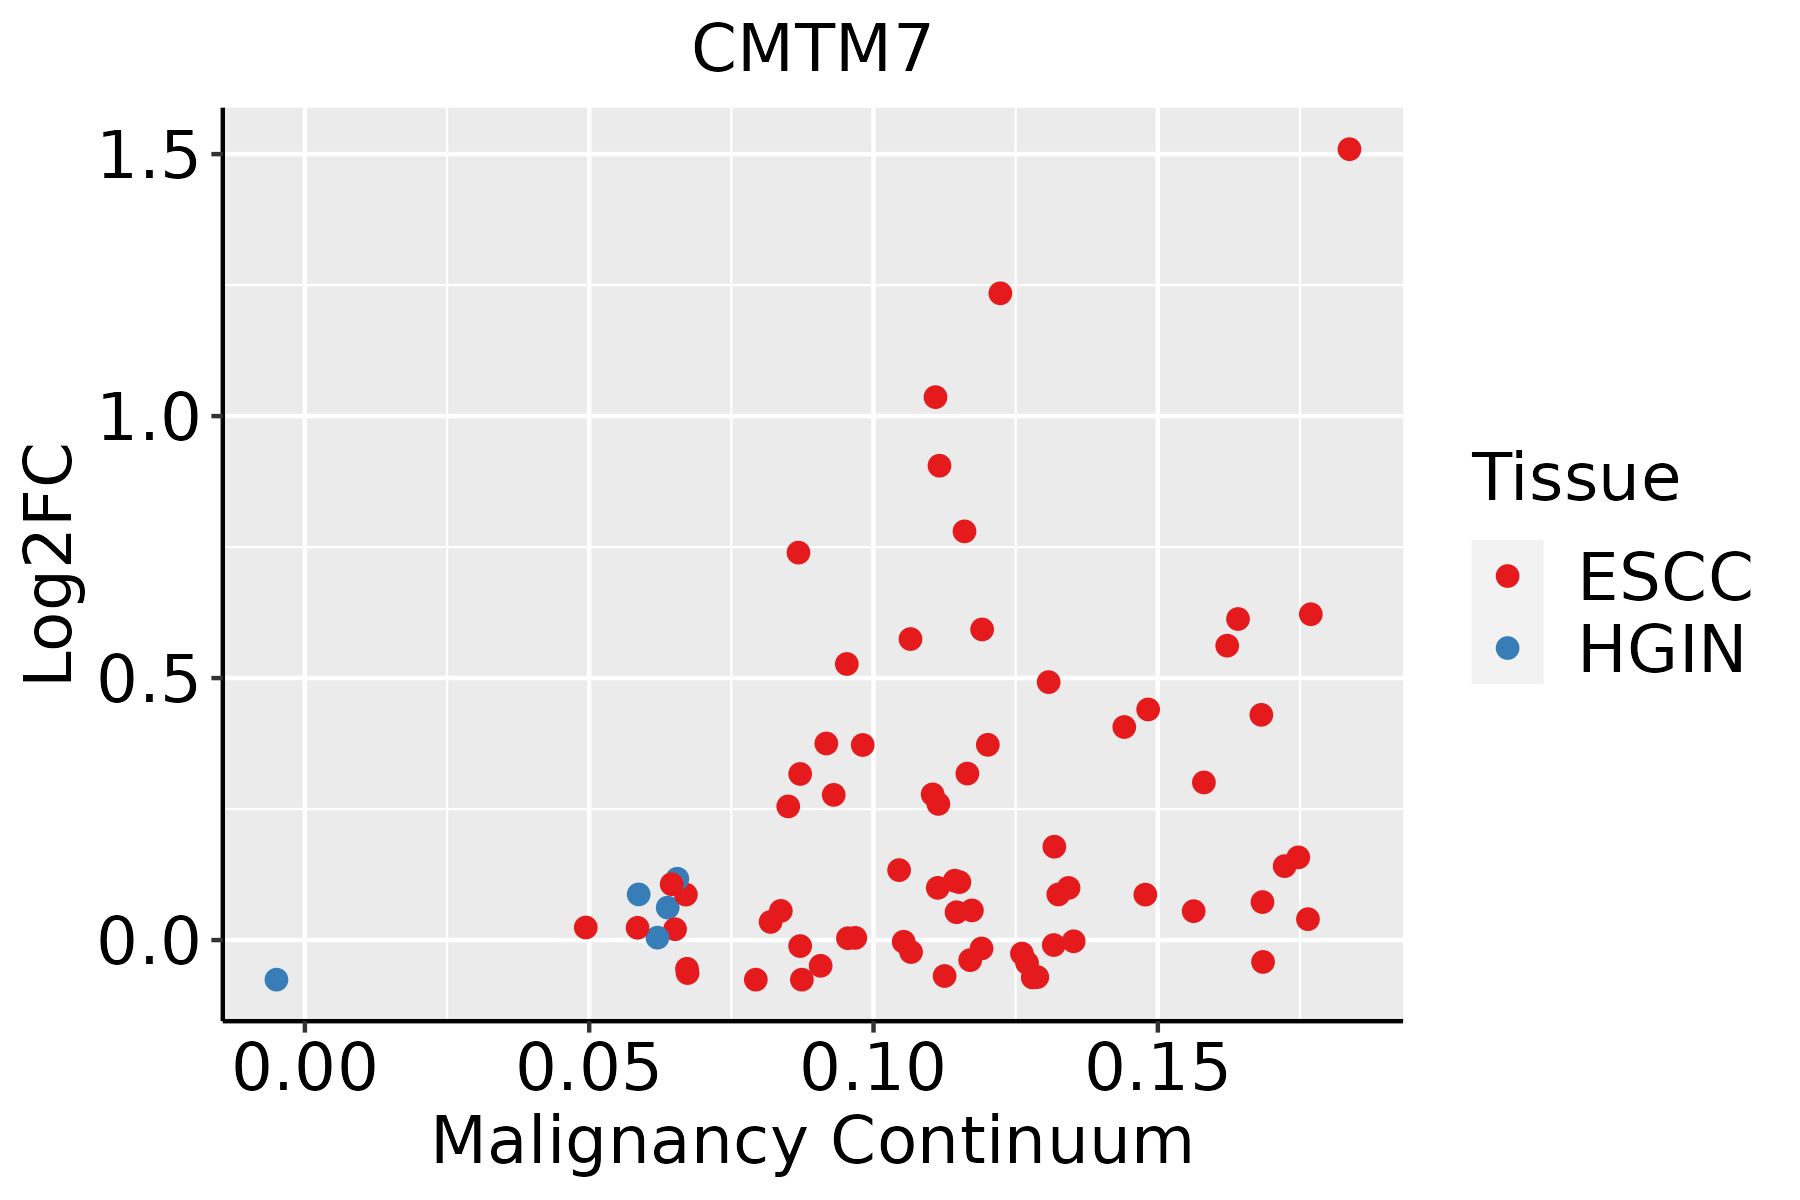 | ESCC: Esophageal squamous cell carcinoma |
| HGIN: High-grade intraepithelial neoplasias | ||
| LGIN: Low-grade intraepithelial neoplasias | ||
| Liver | 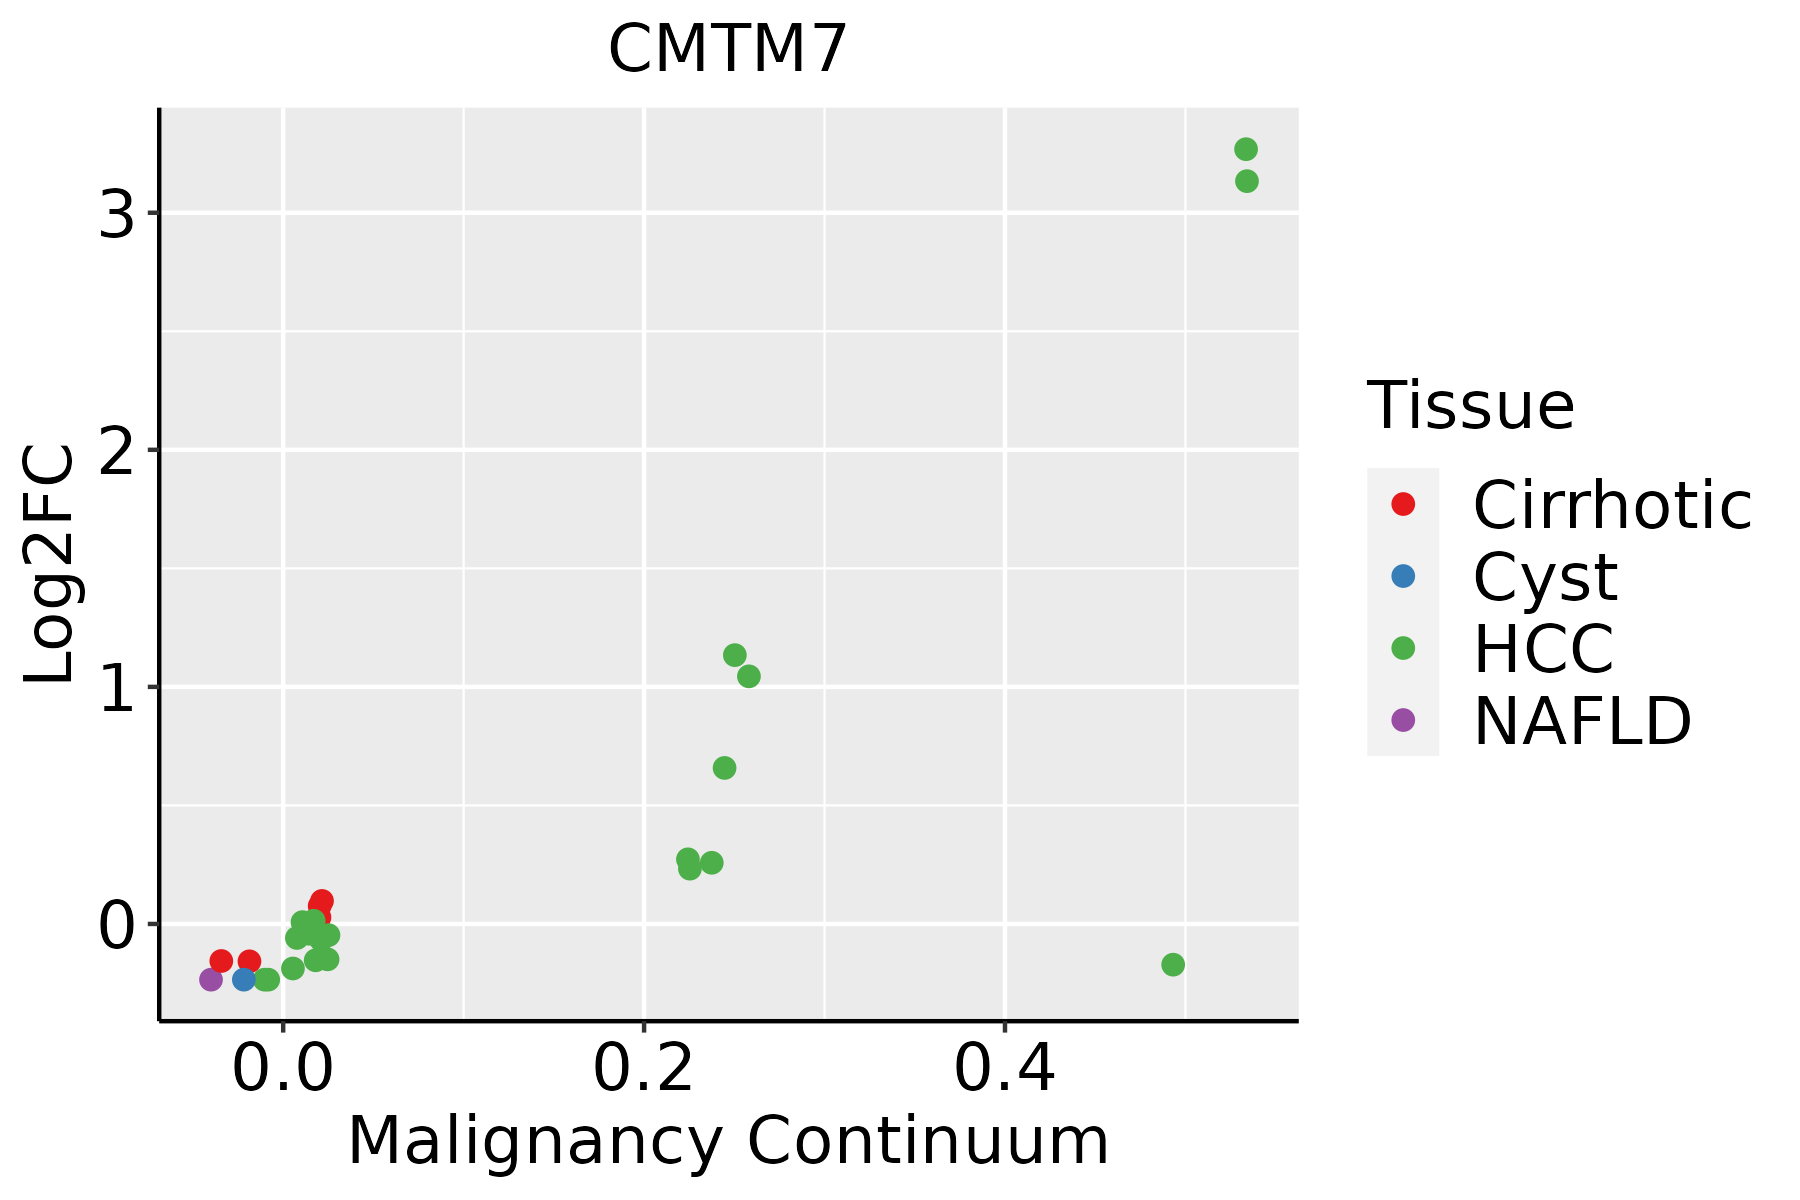 | HCC: Hepatocellular carcinoma |
| NAFLD: Non-alcoholic fatty liver disease | ||
| Lung | 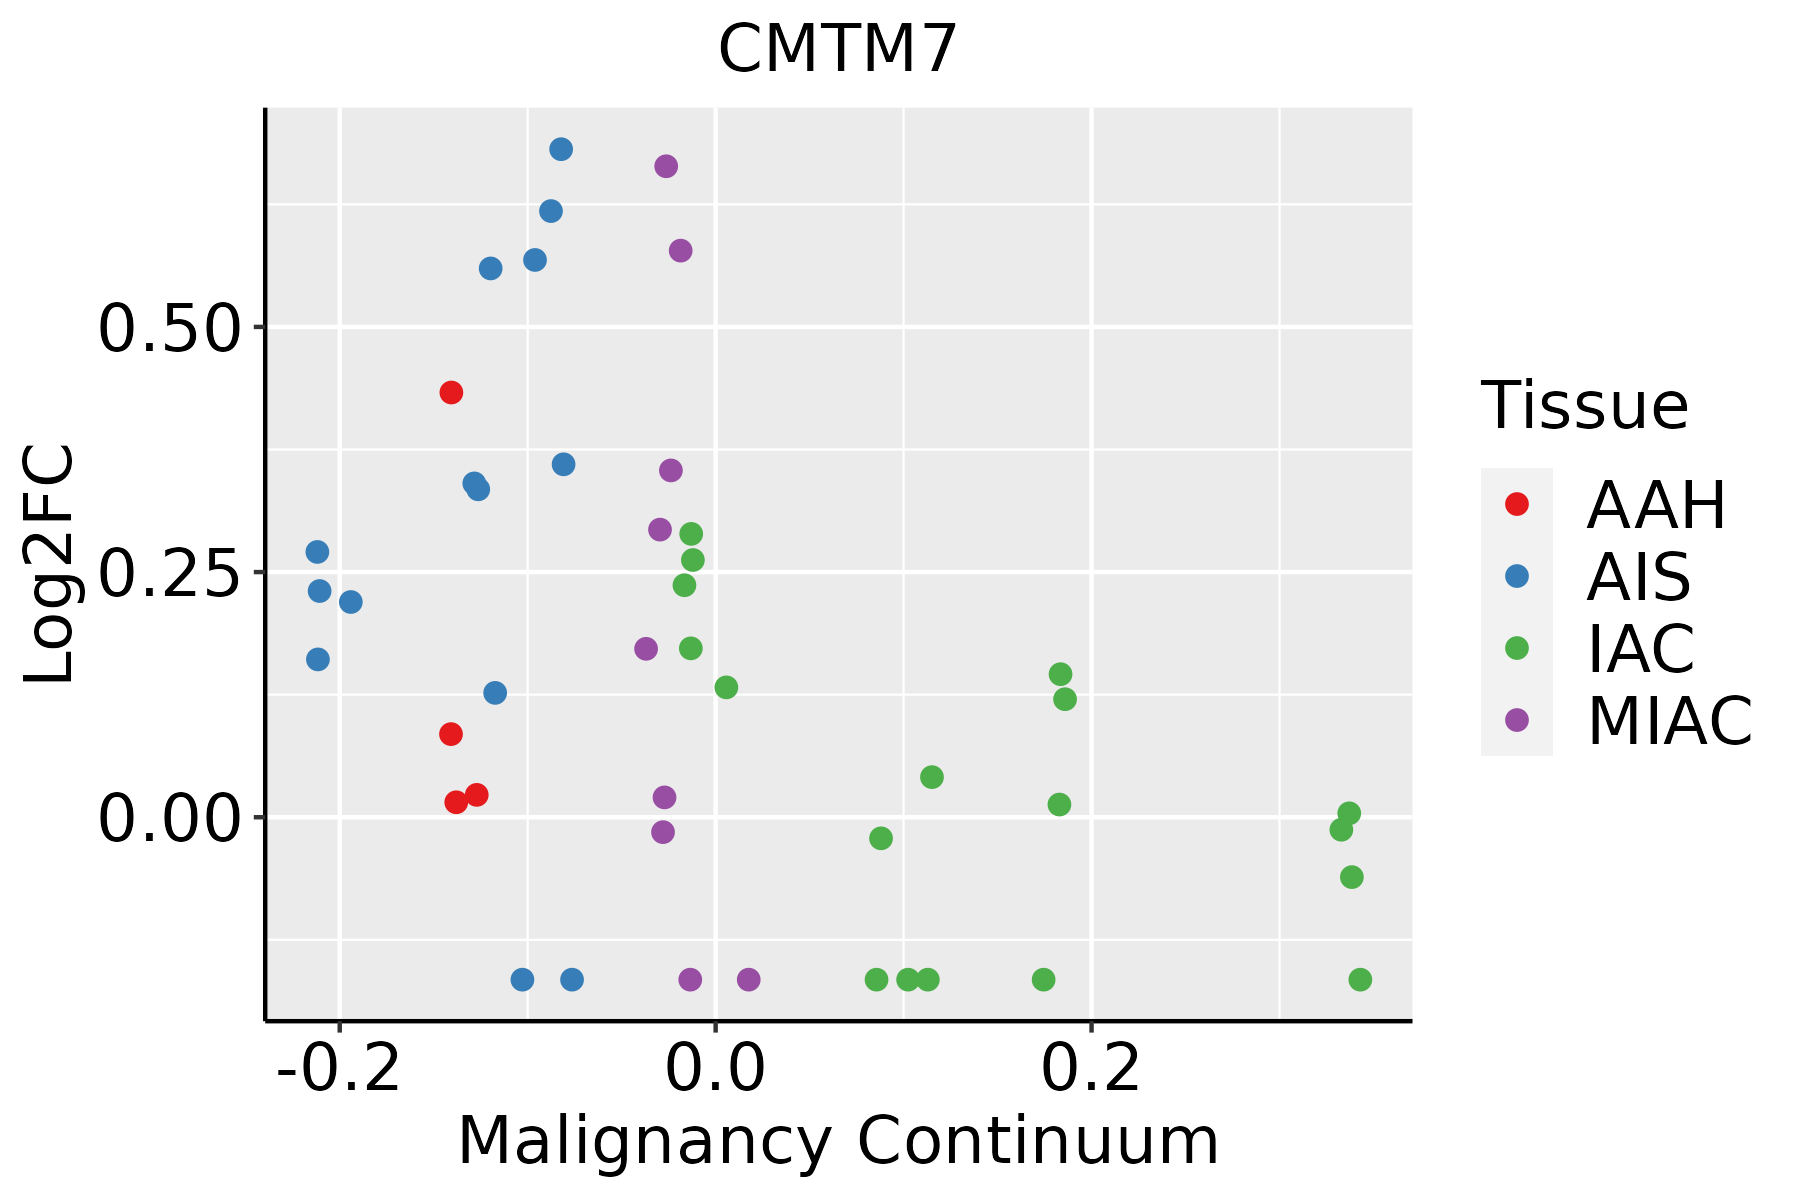 | AAH: Atypical adenomatous hyperplasia |
| AIS: Adenocarcinoma in situ | ||
| IAC: Invasive lung adenocarcinoma | ||
| MIA: Minimally invasive adenocarcinoma |
| ∗log2FC in expression of this searched gene in stem-like cells from each diseased tissue sample relative to stem-like cells in normal samples in each tissue plotted against the malignancy continuum. Samples are colored based on if they are from different disease stage. |
Top |
Malignant transformation related pathway analysis |
| Find out the enriched GO biological processes and KEGG pathways involved in transition from healthy to precancer to cancer |
| Tissue | Disease Stage | Enriched GO biological Processes |
| Colorectum | AD |  |
| Colorectum | SER |  |
| Colorectum | MSS |  |
| Colorectum | MSI-H |  |
| Colorectum | FAP |  |
| ∗Top 15 enriched GO BP terms are showed in the bar plot of each disease state in each tissue. Each row represents a significant GO biological process which is colored according to the -log10(p.adjust). |
| Page: 1 2 3 4 5 6 7 8 9 |
| GO ID | Tissue | Disease Stage | Description | Gene Ratio | Bg Ratio | pvalue | p.adjust | Count |
| GO:19031317 | Esophagus | ESCC | mononuclear cell differentiation | 226/8552 | 426/18723 | 1.20e-03 | 5.88e-03 | 226 |
| GO:00300984 | Esophagus | ESCC | lymphocyte differentiation | 192/8552 | 374/18723 | 1.52e-02 | 4.93e-02 | 192 |
| GO:19031311 | Lung | IAC | mononuclear cell differentiation | 66/2061 | 426/18723 | 2.63e-03 | 2.44e-02 | 66 |
| Page: 1 |
| Pathway ID | Tissue | Disease Stage | Description | Gene Ratio | Bg Ratio | pvalue | p.adjust | qvalue | Count |
| Page: 1 |
Top |
Cell-cell communication analysis |
| Identification of potential cell-cell interactions between two cell types and their ligand-receptor pairs for different disease states |
| Ligand | Receptor | LRpair | Pathway | Tissue | Disease Stage |
| Page: 1 |
Top |
Single-cell gene regulatory network inference analysis |
| Find out the significant the regulons (TFs) and the target genes of each regulon across cell types for different disease states |
| TF | Cell Type | Tissue | Disease Stage | Target Gene | RSS | Regulon Activity |
| ∗The dot plots of a searched regulon are shown for all cell subpopulations in each disease state of each tissue based on the regulon specific score inferred using pySCENIC and by calculating the average expression. |
| Page: 1 |
Top |
Somatic mutation of malignant transformation related genes |
| Annotation of somatic variants for genes involved in malignant transformation |
| Hugo Symbol | Variant Class | Variant Classification | dbSNP RS | HGVSc | HGVSp | HGVSp Short | SWISSPROT | BIOTYPE | SIFT | PolyPhen | Tumor Sample Barcode | Tissue | Histology | Sex | Age | Stage | Therapy Types | Drugs | Outcome |
| CMTM7 | SNV | Missense_Mutation | novel | c.471N>A | p.Ser157Arg | p.S157R | Q96FZ5 | protein_coding | deleterious(0) | probably_damaging(0.958) | TCGA-AN-A0FX-01 | Breast | breast invasive carcinoma | Female | <65 | I/II | Unknown | Unknown | SD |
| CMTM7 | SNV | Missense_Mutation | c.499N>A | p.Val167Ile | p.V167I | Q96FZ5 | protein_coding | tolerated(0.82) | benign(0) | TCGA-BH-A209-01 | Breast | breast invasive carcinoma | Female | >=65 | I/II | Unknown | Unknown | SD | |
| CMTM7 | insertion | In_Frame_Ins | novel | c.473_474insGGAATGGAATGGAATAGAATGGAAGCAAACTGAGTGCAGGGGAATGGA | p.Ile158delinsMetGluTrpAsnGlyIleGluTrpLysGlnThrGluCysArgGlyMetGlu | p.I158delinsMEWNGIEWKQTECRGME | Q96FZ5 | protein_coding | TCGA-AN-A0FX-01 | Breast | breast invasive carcinoma | Female | <65 | I/II | Unknown | Unknown | SD | ||
| CMTM7 | SNV | Missense_Mutation | c.331N>C | p.Ser111Pro | p.S111P | Q96FZ5 | protein_coding | deleterious(0.01) | possibly_damaging(0.653) | TCGA-AA-3510-01 | Colorectum | colon adenocarcinoma | Male | >=65 | I/II | Unknown | Unknown | SD | |
| CMTM7 | SNV | Missense_Mutation | novel | c.407N>G | p.Asn136Ser | p.N136S | Q96FZ5 | protein_coding | tolerated(0.56) | benign(0.007) | TCGA-AA-3984-01 | Colorectum | colon adenocarcinoma | Female | <65 | I/II | Unknown | Unknown | SD |
| CMTM7 | SNV | Missense_Mutation | novel | c.421N>A | p.Val141Ile | p.V141I | Q96FZ5 | protein_coding | tolerated(0.15) | benign(0.223) | TCGA-AZ-4315-01 | Colorectum | colon adenocarcinoma | Male | <65 | I/II | Unknown | Unknown | SD |
| CMTM7 | SNV | Missense_Mutation | rs780296829 | c.250G>A | p.Asp84Asn | p.D84N | Q96FZ5 | protein_coding | tolerated(0.86) | benign(0.006) | TCGA-AP-A1E0-01 | Endometrium | uterine corpus endometrioid carcinoma | Female | <65 | III/IV | Chemotherapy | paclitaxel | SD |
| CMTM7 | SNV | Missense_Mutation | c.293G>A | p.Arg98His | p.R98H | Q96FZ5 | protein_coding | deleterious(0) | possibly_damaging(0.724) | TCGA-AX-A0J1-01 | Endometrium | uterine corpus endometrioid carcinoma | Female | >=65 | I/II | Unknown | Unknown | SD | |
| CMTM7 | SNV | Missense_Mutation | rs767127146 | c.292N>T | p.Arg98Cys | p.R98C | Q96FZ5 | protein_coding | deleterious(0.01) | benign(0.061) | TCGA-AX-A1CE-01 | Endometrium | uterine corpus endometrioid carcinoma | Female | <65 | I/II | Unspecific | Paclitaxel | SD |
| CMTM7 | SNV | Missense_Mutation | rs377268191 | c.268N>A | p.Ala90Thr | p.A90T | Q96FZ5 | protein_coding | tolerated(0.06) | benign(0.01) | TCGA-DF-A2KU-01 | Endometrium | uterine corpus endometrioid carcinoma | Female | Unknown | I/II | Unknown | Unknown | SD |
| Page: 1 2 |
Top |
Related drugs of malignant transformation related genes |
| Identification of chemicals and drugs interact with genes involved in malignant transfromation |
| (DGIdb 4.0) |
| Entrez ID | Symbol | Category | Interaction Types | Drug Claim Name | Drug Name | PMIDs |
| Page: 1 |

Copyright 2023-Present -The University of Texas Health Science Center at Houston |