
|
|||||
|
 | |
| |
| |
| |
| |
| |
|
Gene: CMTM6 |
Gene summary for CMTM6 |
| Gene information | Species | Human | Gene symbol | CMTM6 | Gene ID | 54918 |
| Gene name | CKLF like MARVEL transmembrane domain containing 6 | |
| Gene Alias | CKLFSF6 | |
| Cytomap | 3p22.3 | |
| Gene Type | protein-coding | GO ID | GO:0006810 | UniProtAcc | Q9NX76 |
Top |
Malignant transformation analysis |
| Identification of the aberrant gene expression in precancerous and cancerous lesions by comparing the gene expression of stem-like cells in diseased tissues with normal stem cells |
| Entrez ID | Symbol | Replicates | Species | Organ | Tissue | Adj P-value | Log2FC | Malignancy |
| 54918 | CMTM6 | AEH-subject1 | Human | Endometrium | AEH | 4.32e-02 | -2.05e-01 | -0.3059 |
| 54918 | CMTM6 | AEH-subject2 | Human | Endometrium | AEH | 4.04e-02 | -2.39e-01 | -0.2525 |
| 54918 | CMTM6 | AEH-subject5 | Human | Endometrium | AEH | 7.88e-08 | -3.99e-01 | -0.2953 |
| 54918 | CMTM6 | EEC-subject1 | Human | Endometrium | EEC | 6.02e-04 | -2.81e-01 | -0.2682 |
| 54918 | CMTM6 | EEC-subject2 | Human | Endometrium | EEC | 6.66e-10 | -4.22e-01 | -0.2607 |
| 54918 | CMTM6 | EEC-subject3 | Human | Endometrium | EEC | 4.01e-25 | -4.27e-01 | -0.2525 |
| 54918 | CMTM6 | EEC-subject4 | Human | Endometrium | EEC | 1.89e-05 | -3.76e-01 | -0.2571 |
| 54918 | CMTM6 | EEC-subject5 | Human | Endometrium | EEC | 3.50e-06 | -3.50e-01 | -0.249 |
| 54918 | CMTM6 | GSM5276934 | Human | Endometrium | EEC | 1.92e-07 | -4.00e-01 | -0.0913 |
| 54918 | CMTM6 | GSM5276937 | Human | Endometrium | EEC | 1.56e-03 | -3.42e-01 | -0.0897 |
| 54918 | CMTM6 | GSM6177620_NYU_UCEC1_lib1_lib1 | Human | Endometrium | EEC | 4.00e-23 | 3.22e-01 | -0.1869 |
| 54918 | CMTM6 | GSM6177620_NYU_UCEC1_lib2_lib2 | Human | Endometrium | EEC | 2.37e-26 | 1.69e-01 | -0.1875 |
| 54918 | CMTM6 | GSM6177620_NYU_UCEC1_lib3_lib3 | Human | Endometrium | EEC | 6.76e-32 | 3.49e-01 | -0.1883 |
| 54918 | CMTM6 | GSM6177621_NYU_UCEC2_lib1_lib1 | Human | Endometrium | EEC | 2.73e-39 | 5.63e-01 | -0.1934 |
| 54918 | CMTM6 | GSM6177622_NYU_UCEC3_lib1_lib1 | Human | Endometrium | EEC | 2.08e-43 | 4.63e-01 | -0.1917 |
| 54918 | CMTM6 | GSM6177622_NYU_UCEC3_lib2_lib2 | Human | Endometrium | EEC | 3.14e-50 | 5.14e-01 | -0.1916 |
| 54918 | CMTM6 | LZE4T | Human | Esophagus | ESCC | 5.15e-09 | 5.97e-01 | 0.0811 |
| 54918 | CMTM6 | LZE7T | Human | Esophagus | ESCC | 9.43e-03 | 5.80e-01 | 0.0667 |
| 54918 | CMTM6 | LZE8T | Human | Esophagus | ESCC | 3.78e-05 | 2.37e-01 | 0.067 |
| 54918 | CMTM6 | LZE22T | Human | Esophagus | ESCC | 6.16e-03 | 4.61e-01 | 0.068 |
| Page: 1 2 3 4 5 6 7 |
| Tissue | Expression Dynamics | Abbreviation |
| Endometrium |  | AEH: Atypical endometrial hyperplasia |
| EEC: Endometrioid Cancer | ||
| Esophagus |  | ESCC: Esophageal squamous cell carcinoma |
| HGIN: High-grade intraepithelial neoplasias | ||
| LGIN: Low-grade intraepithelial neoplasias | ||
| Liver |  | HCC: Hepatocellular carcinoma |
| NAFLD: Non-alcoholic fatty liver disease | ||
| Oral Cavity | 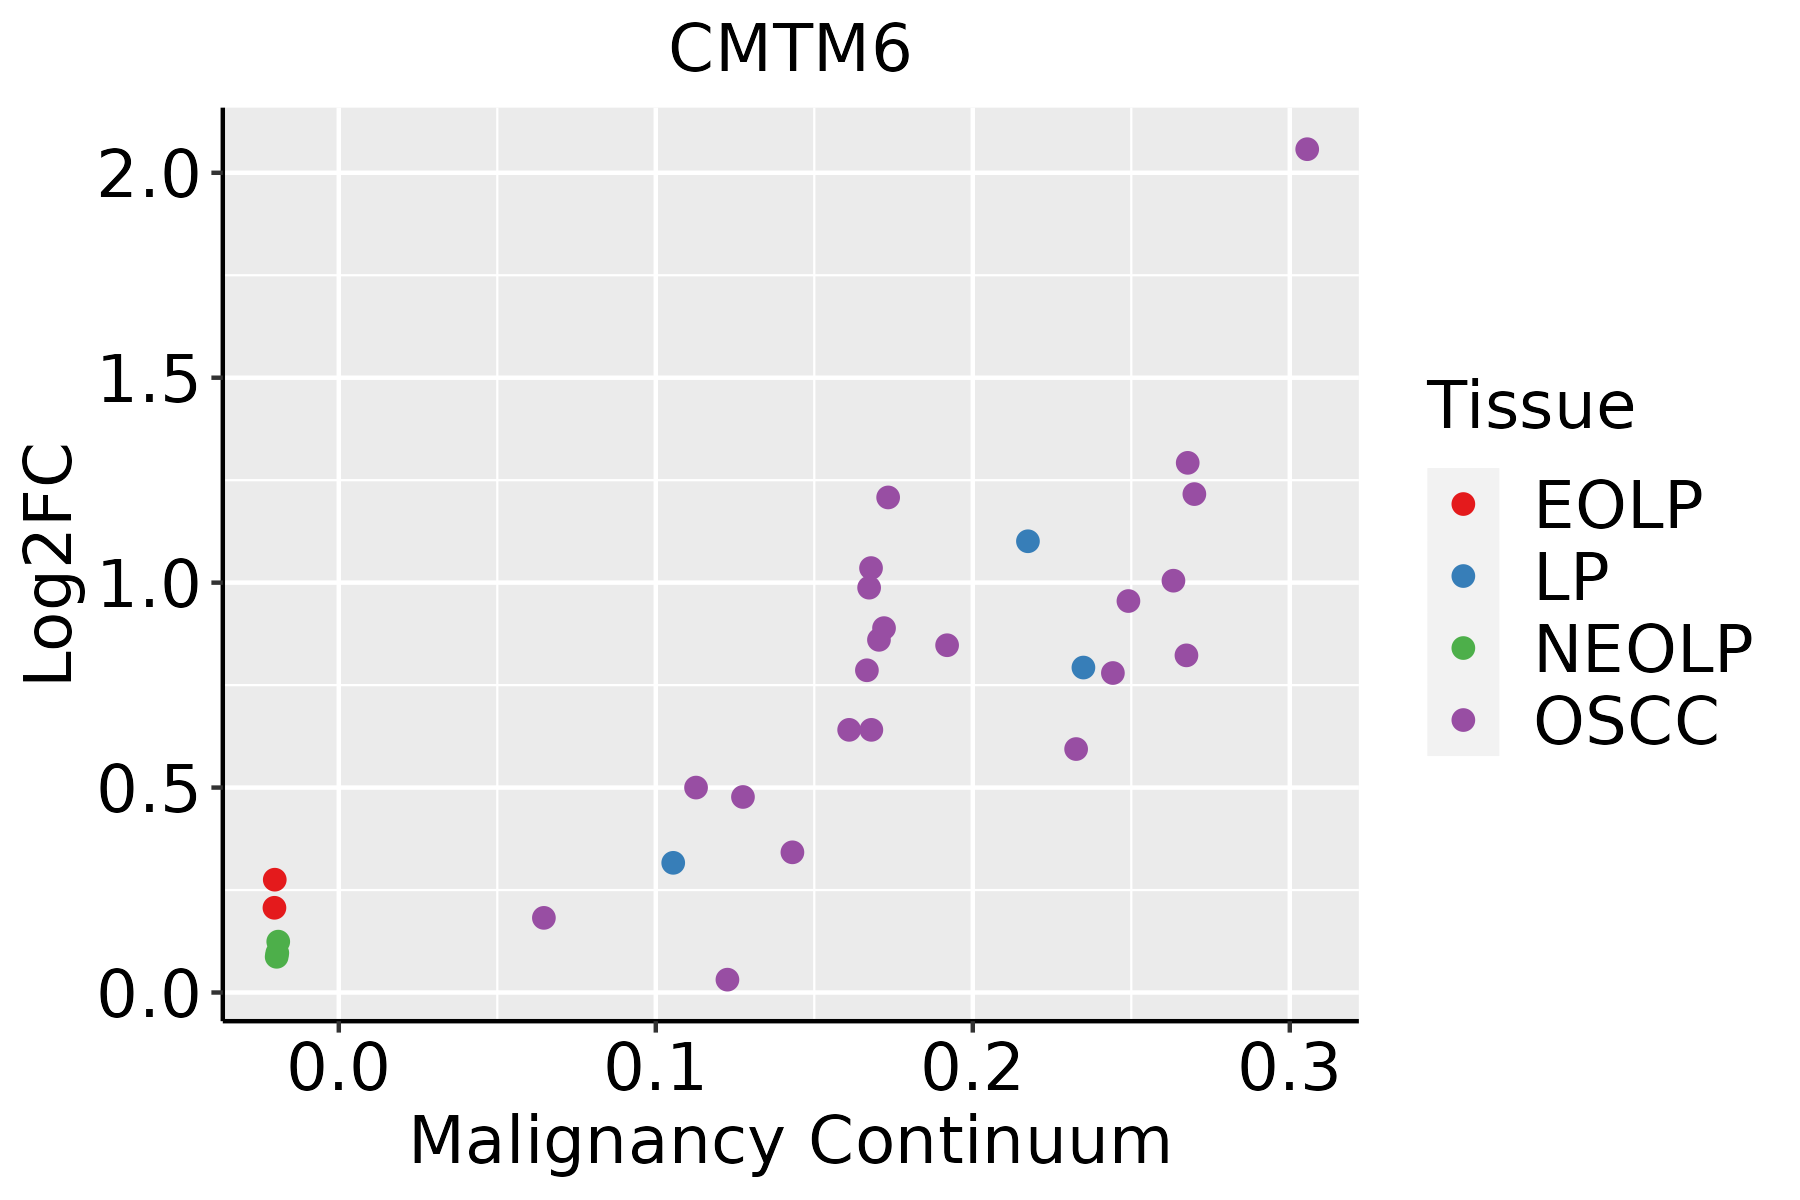 | EOLP: Erosive Oral lichen planus |
| LP: leukoplakia | ||
| NEOLP: Non-erosive oral lichen planus | ||
| OSCC: Oral squamous cell carcinoma | ||
| Prostate | 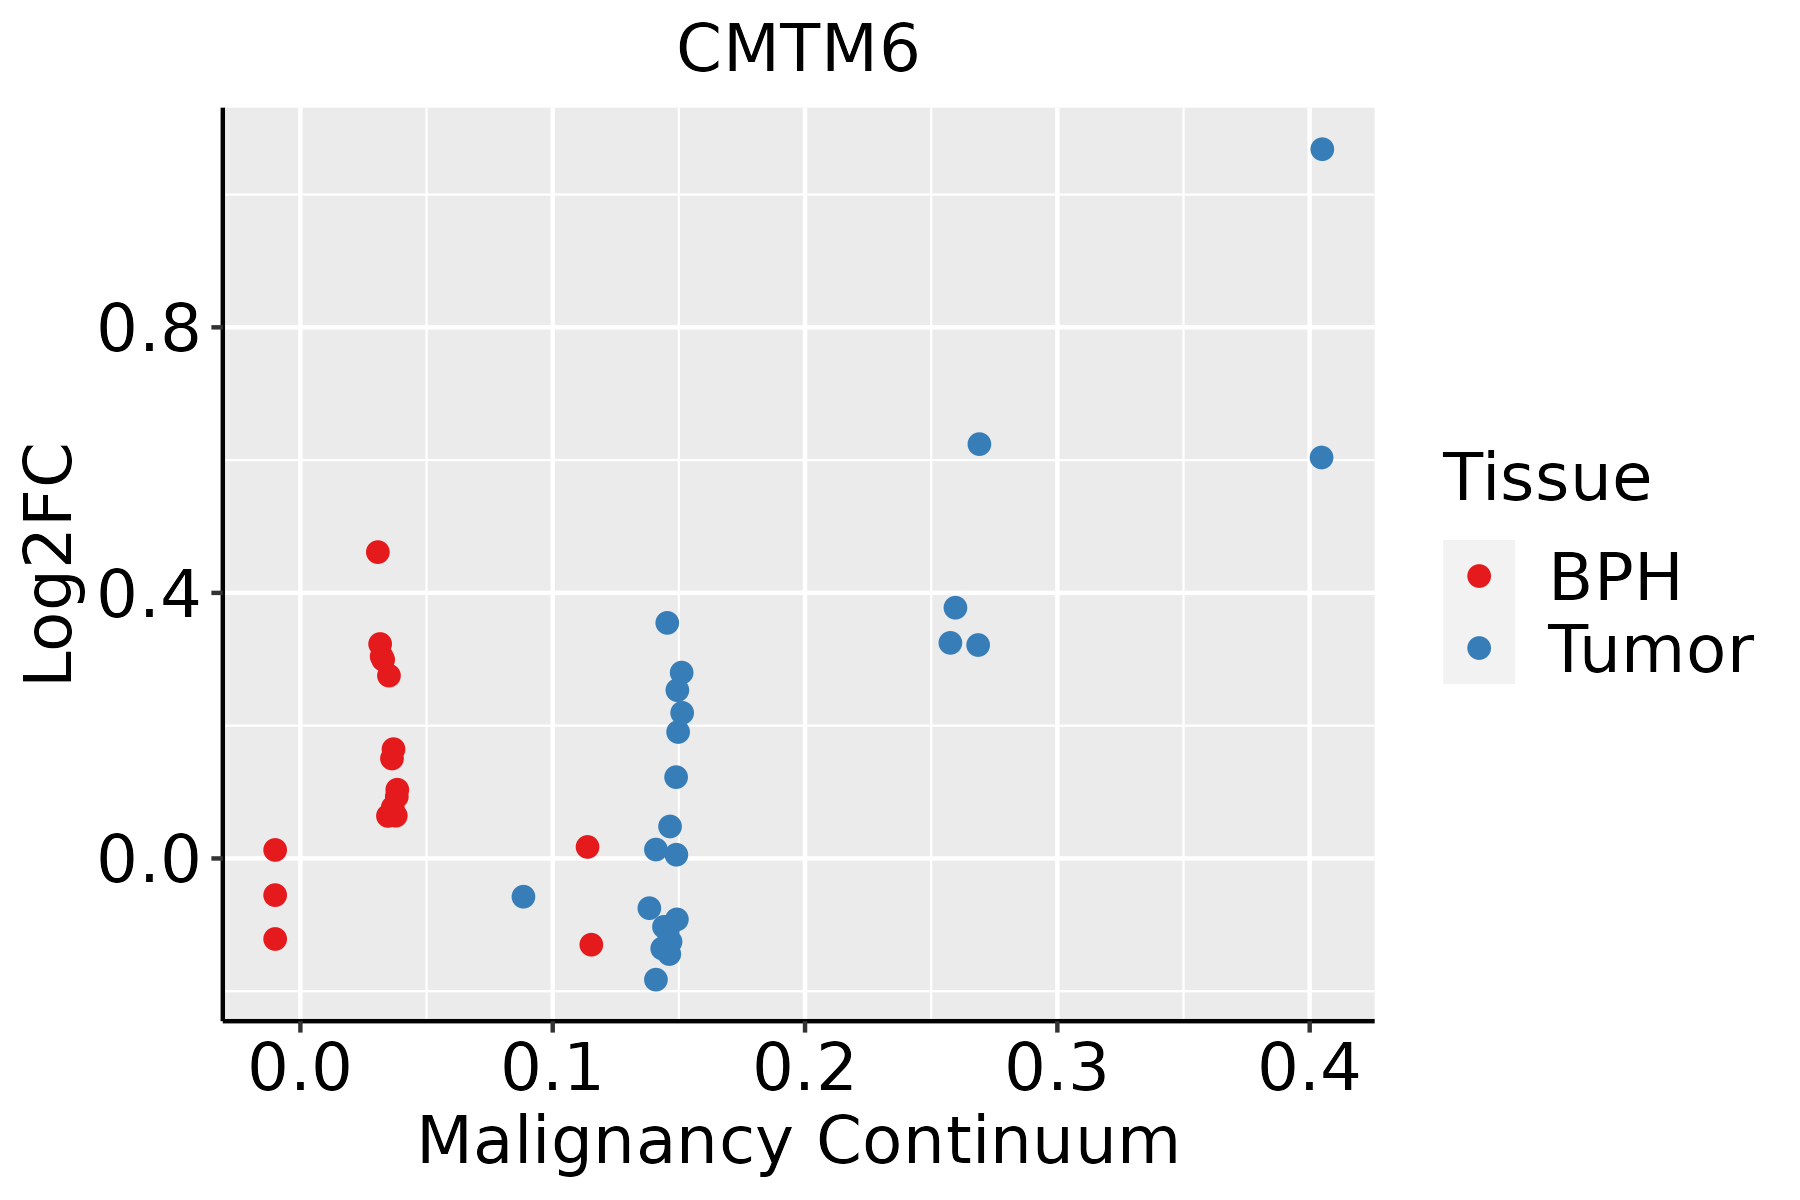 | BPH: Benign Prostatic Hyperplasia |
| Skin | 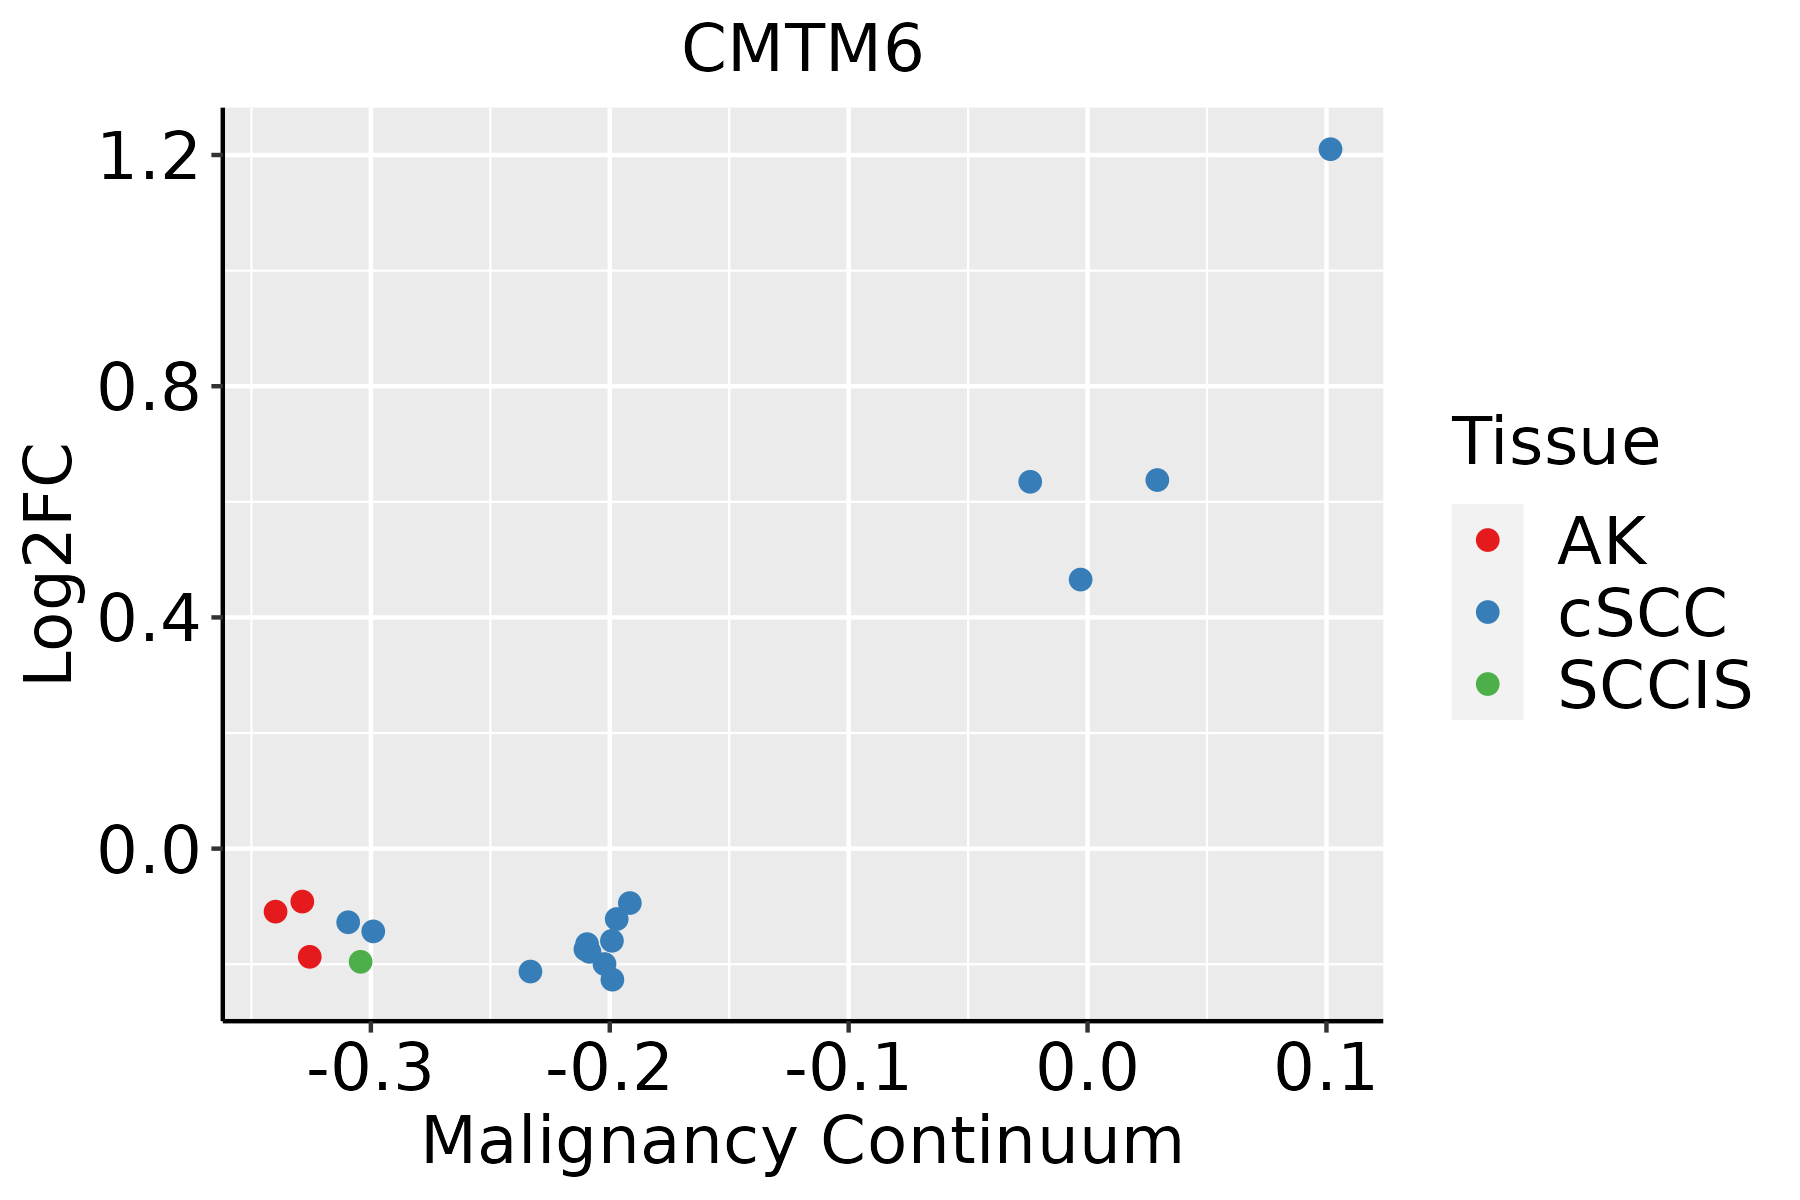 | AK: Actinic keratosis |
| cSCC: Cutaneous squamous cell carcinoma | ||
| SCCIS:squamous cell carcinoma in situ | ||
| Thyroid | 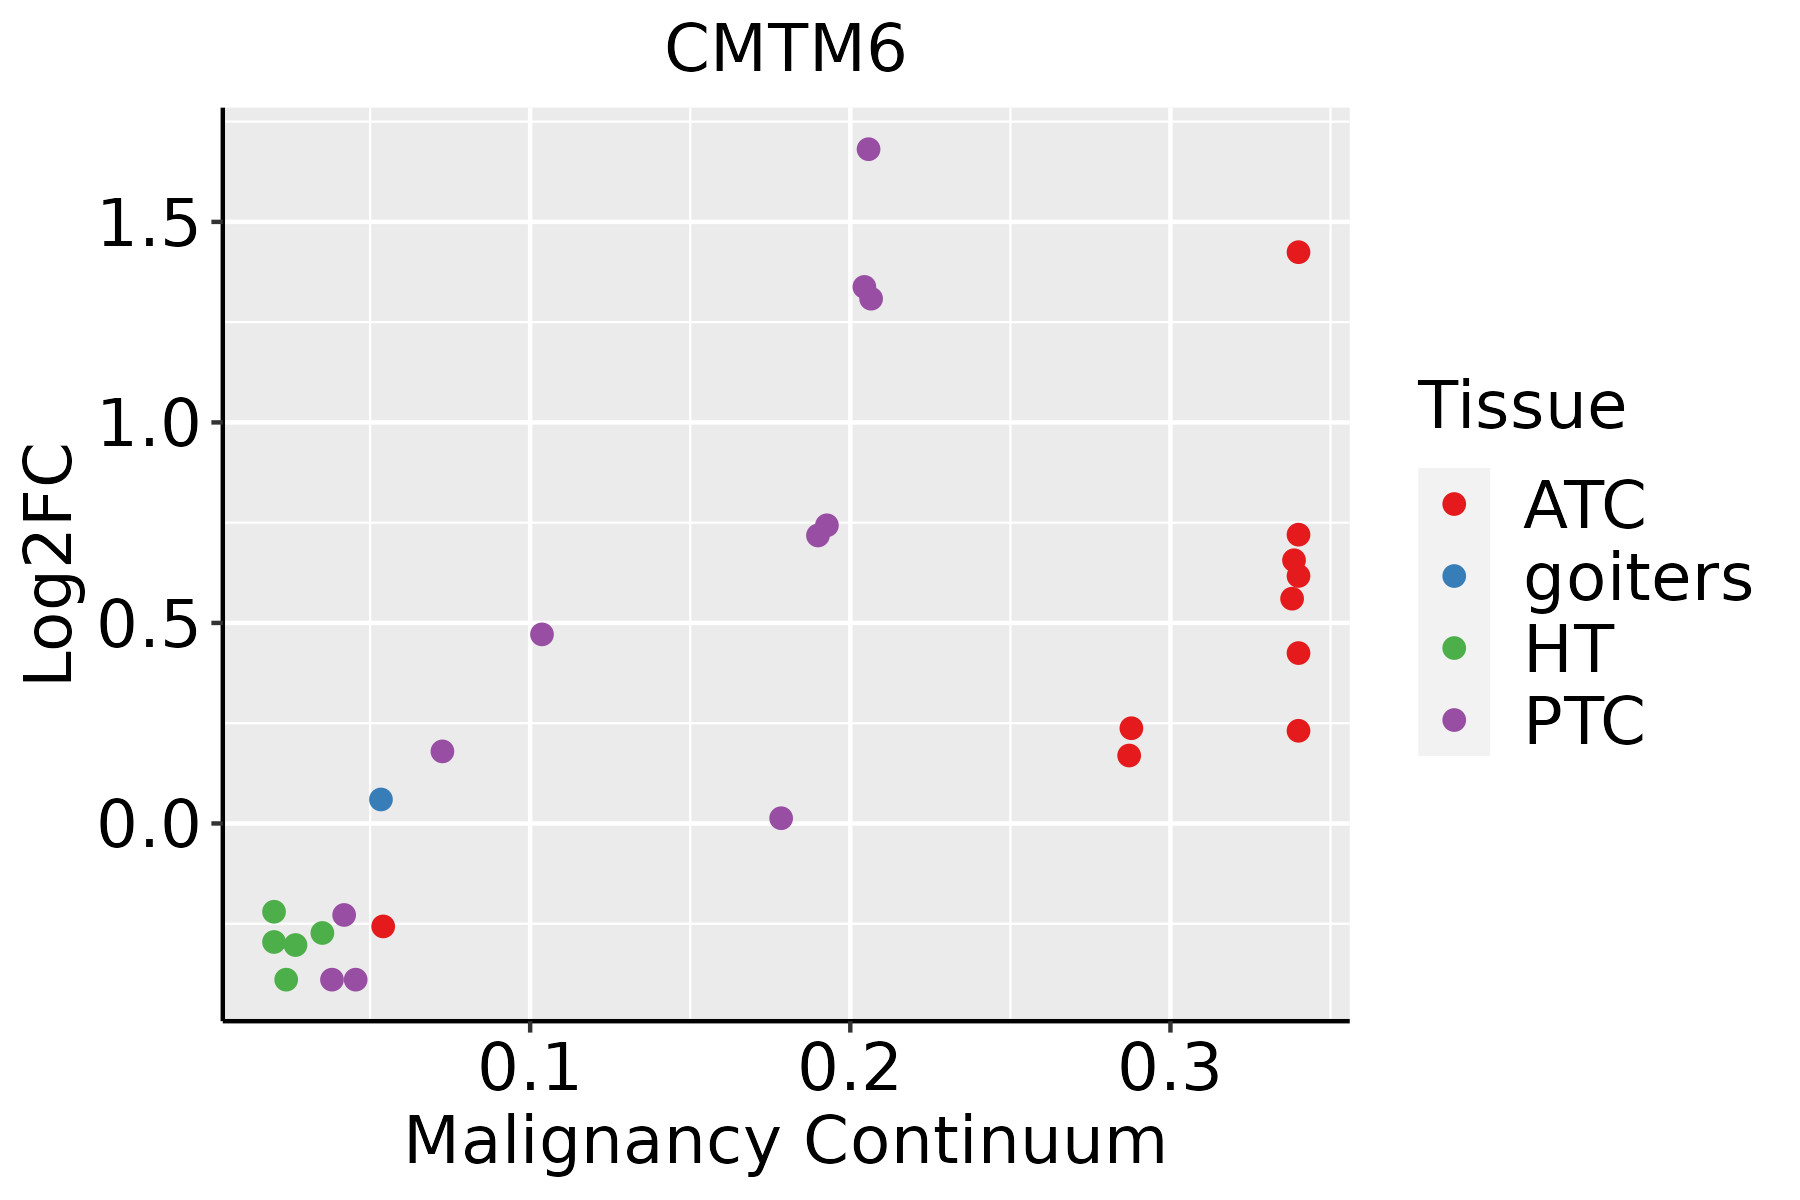 | ATC: Anaplastic thyroid cancer |
| HT: Hashimoto's thyroiditis | ||
| PTC: Papillary thyroid cancer |
| ∗log2FC in expression of this searched gene in stem-like cells from each diseased tissue sample relative to stem-like cells in normal samples in each tissue plotted against the malignancy continuum. Samples are colored based on if they are from different disease stage. |
Top |
Malignant transformation related pathway analysis |
| Find out the enriched GO biological processes and KEGG pathways involved in transition from healthy to precancer to cancer |
| Tissue | Disease Stage | Enriched GO biological Processes |
| Colorectum | AD |  |
| Colorectum | SER |  |
| Colorectum | MSS |  |
| Colorectum | MSI-H |  |
| Colorectum | FAP |  |
| ∗Top 15 enriched GO BP terms are showed in the bar plot of each disease state in each tissue. Each row represents a significant GO biological process which is colored according to the -log10(p.adjust). |
| Page: 1 2 3 4 5 6 7 8 9 |
| GO ID | Tissue | Disease Stage | Description | Gene Ratio | Bg Ratio | pvalue | p.adjust | Count |
| GO:003164716 | Endometrium | AEH | regulation of protein stability | 77/2100 | 298/18723 | 1.13e-12 | 2.26e-10 | 77 |
| GO:003164717 | Endometrium | EEC | regulation of protein stability | 80/2168 | 298/18723 | 2.48e-13 | 5.96e-11 | 80 |
| GO:0031647111 | Esophagus | ESCC | regulation of protein stability | 223/8552 | 298/18723 | 5.76e-25 | 1.52e-22 | 223 |
| GO:001619715 | Esophagus | ESCC | endosomal transport | 168/8552 | 230/18723 | 2.28e-17 | 1.93e-15 | 168 |
| GO:009887615 | Esophagus | ESCC | vesicle-mediated transport to the plasma membrane | 99/8552 | 136/18723 | 1.13e-10 | 3.39e-09 | 99 |
| GO:00324565 | Esophagus | ESCC | endocytic recycling | 51/8552 | 73/18723 | 2.47e-05 | 2.10e-04 | 51 |
| GO:003164712 | Liver | Cirrhotic | regulation of protein stability | 144/4634 | 298/18723 | 6.74e-19 | 1.28e-16 | 144 |
| GO:001619711 | Liver | Cirrhotic | endosomal transport | 93/4634 | 230/18723 | 1.01e-07 | 2.93e-06 | 93 |
| GO:009887611 | Liver | Cirrhotic | vesicle-mediated transport to the plasma membrane | 59/4634 | 136/18723 | 1.46e-06 | 2.88e-05 | 59 |
| GO:003164722 | Liver | HCC | regulation of protein stability | 211/7958 | 298/18723 | 2.29e-23 | 5.01e-21 | 211 |
| GO:001619721 | Liver | HCC | endosomal transport | 154/7958 | 230/18723 | 4.74e-14 | 2.95e-12 | 154 |
| GO:009887621 | Liver | HCC | vesicle-mediated transport to the plasma membrane | 92/7958 | 136/18723 | 2.57e-09 | 7.07e-08 | 92 |
| GO:00324562 | Liver | HCC | endocytic recycling | 48/7958 | 73/18723 | 5.07e-05 | 4.83e-04 | 48 |
| GO:003164720 | Oral cavity | OSCC | regulation of protein stability | 193/7305 | 298/18723 | 1.30e-19 | 1.95e-17 | 193 |
| GO:00161979 | Oral cavity | OSCC | endosomal transport | 141/7305 | 230/18723 | 5.40e-12 | 2.06e-10 | 141 |
| GO:00988769 | Oral cavity | OSCC | vesicle-mediated transport to the plasma membrane | 79/7305 | 136/18723 | 4.93e-06 | 5.58e-05 | 79 |
| GO:0031647110 | Oral cavity | LP | regulation of protein stability | 132/4623 | 298/18723 | 8.16e-14 | 7.99e-12 | 132 |
| GO:001619714 | Oral cavity | LP | endosomal transport | 98/4623 | 230/18723 | 1.65e-09 | 7.50e-08 | 98 |
| GO:009887614 | Oral cavity | LP | vesicle-mediated transport to the plasma membrane | 53/4623 | 136/18723 | 1.54e-04 | 1.76e-03 | 53 |
| GO:00324564 | Oral cavity | LP | endocytic recycling | 28/4623 | 73/18723 | 6.61e-03 | 3.86e-02 | 28 |
| Page: 1 2 |
| Pathway ID | Tissue | Disease Stage | Description | Gene Ratio | Bg Ratio | pvalue | p.adjust | qvalue | Count |
| Page: 1 |
Top |
Cell-cell communication analysis |
| Identification of potential cell-cell interactions between two cell types and their ligand-receptor pairs for different disease states |
| Ligand | Receptor | LRpair | Pathway | Tissue | Disease Stage |
| Page: 1 |
Top |
Single-cell gene regulatory network inference analysis |
| Find out the significant the regulons (TFs) and the target genes of each regulon across cell types for different disease states |
| TF | Cell Type | Tissue | Disease Stage | Target Gene | RSS | Regulon Activity |
| ∗The dot plots of a searched regulon are shown for all cell subpopulations in each disease state of each tissue based on the regulon specific score inferred using pySCENIC and by calculating the average expression. |
| Page: 1 |
Top |
Somatic mutation of malignant transformation related genes |
| Annotation of somatic variants for genes involved in malignant transformation |
| Hugo Symbol | Variant Class | Variant Classification | dbSNP RS | HGVSc | HGVSp | HGVSp Short | SWISSPROT | BIOTYPE | SIFT | PolyPhen | Tumor Sample Barcode | Tissue | Histology | Sex | Age | Stage | Therapy Types | Drugs | Outcome |
| CMTM6 | SNV | Missense_Mutation | novel | c.302A>C | p.Lys101Thr | p.K101T | Q9NX76 | protein_coding | deleterious(0) | probably_damaging(0.979) | TCGA-2W-A8YY-01 | Cervix | cervical & endocervical cancer | Female | <65 | I/II | Chemotherapy | cisplatin | CR |
| CMTM6 | SNV | Missense_Mutation | novel | c.451G>A | p.Asp151Asn | p.D151N | Q9NX76 | protein_coding | deleterious(0.03) | probably_damaging(0.96) | TCGA-IR-A3LF-01 | Cervix | cervical & endocervical cancer | Female | <65 | I/II | Unknown | Unknown | SD |
| CMTM6 | SNV | Missense_Mutation | c.41N>G | p.Asp14Gly | p.D14G | Q9NX76 | protein_coding | tolerated(0.35) | benign(0) | TCGA-DM-A1HB-01 | Colorectum | colon adenocarcinoma | Male | >=65 | III/IV | Unknown | Unknown | SD | |
| CMTM6 | SNV | Missense_Mutation | novel | c.445N>A | p.Leu149Ile | p.L149I | Q9NX76 | protein_coding | tolerated(0.2) | possibly_damaging(0.666) | TCGA-A5-A1OF-01 | Endometrium | uterine corpus endometrioid carcinoma | Female | <65 | I/II | Unknown | Unknown | SD |
| CMTM6 | SNV | Missense_Mutation | c.272N>T | p.Thr91Ile | p.T91I | Q9NX76 | protein_coding | deleterious(0) | probably_damaging(0.999) | TCGA-BS-A0UF-01 | Endometrium | uterine corpus endometrioid carcinoma | Female | >=65 | I/II | Unknown | Unknown | SD | |
| CMTM6 | SNV | Missense_Mutation | novel | c.418N>A | p.Phe140Ile | p.F140I | Q9NX76 | protein_coding | deleterious(0) | probably_damaging(0.999) | TCGA-DF-A2KN-01 | Endometrium | uterine corpus endometrioid carcinoma | Female | Unknown | I/II | Unknown | Unknown | SD |
| CMTM6 | SNV | Missense_Mutation | novel | c.437N>G | p.Phe146Cys | p.F146C | Q9NX76 | protein_coding | tolerated(0.08) | possibly_damaging(0.819) | TCGA-EO-A22X-01 | Endometrium | uterine corpus endometrioid carcinoma | Female | <65 | III/IV | Unspecific | Carboplatin | Complete Response |
| CMTM6 | SNV | Missense_Mutation | novel | c.125N>T | p.Lys42Met | p.K42M | Q9NX76 | protein_coding | deleterious(0) | probably_damaging(0.999) | TCGA-DD-AACT-01 | Liver | liver hepatocellular carcinoma | Female | >=65 | I/II | Unknown | Unknown | SD |
| CMTM6 | SNV | Missense_Mutation | c.436N>G | p.Phe146Val | p.F146V | Q9NX76 | protein_coding | tolerated(0.82) | benign(0.007) | TCGA-CD-5801-01 | Stomach | stomach adenocarcinoma | Male | >=65 | III/IV | Unknown | Unknown | PD | |
| CMTM6 | insertion | Frame_Shift_Ins | novel | c.213_214insT | p.Glu72Ter | p.E72* | Q9NX76 | protein_coding | TCGA-VQ-A8P2-01 | Stomach | stomach adenocarcinoma | Male | >=65 | III/IV | Unspecific | Complete Response |
| Page: 1 |
Top |
Related drugs of malignant transformation related genes |
| Identification of chemicals and drugs interact with genes involved in malignant transfromation |
| (DGIdb 4.0) |
| Entrez ID | Symbol | Category | Interaction Types | Drug Claim Name | Drug Name | PMIDs |
| Page: 1 |

Copyright 2023-Present -The University of Texas Health Science Center at Houston |