
|
|||||
|
 | |
| |
| |
| |
| |
| |
|
Gene: CMIP |
Gene summary for CMIP |
| Gene information | Species | Human | Gene symbol | CMIP | Gene ID | 80790 |
| Gene name | c-Maf inducing protein | |
| Gene Alias | TCMIP | |
| Cytomap | 16q23.2-q23.3 | |
| Gene Type | protein-coding | GO ID | GO:0001701 | UniProtAcc | Q8IY22 |
Top |
Malignant transformation analysis |
| Identification of the aberrant gene expression in precancerous and cancerous lesions by comparing the gene expression of stem-like cells in diseased tissues with normal stem cells |
| Entrez ID | Symbol | Replicates | Species | Organ | Tissue | Adj P-value | Log2FC | Malignancy |
| 80790 | CMIP | CA_HPV_2 | Human | Cervix | CC | 4.38e-06 | 3.38e-01 | 0.0391 |
| 80790 | CMIP | N_HPV_2 | Human | Cervix | N_HPV | 6.90e-03 | 1.64e-01 | -0.0131 |
| 80790 | CMIP | CCI_1 | Human | Cervix | CC | 4.30e-24 | 2.72e+00 | 0.528 |
| 80790 | CMIP | CCI_2 | Human | Cervix | CC | 4.92e-14 | 2.31e+00 | 0.5249 |
| 80790 | CMIP | CCI_3 | Human | Cervix | CC | 6.46e-28 | 2.07e+00 | 0.516 |
| 80790 | CMIP | CCII_1 | Human | Cervix | CC | 3.77e-05 | 4.20e-01 | 0.3249 |
| 80790 | CMIP | sample3 | Human | Cervix | CC | 3.10e-13 | 3.52e-01 | 0.1387 |
| 80790 | CMIP | T3 | Human | Cervix | CC | 3.04e-08 | 3.47e-01 | 0.1389 |
| 80790 | CMIP | HTA11_1938_2000001011 | Human | Colorectum | AD | 7.03e-04 | 4.58e-01 | -0.0811 |
| 80790 | CMIP | HTA11_78_2000001011 | Human | Colorectum | AD | 1.14e-02 | 4.48e-01 | -0.1088 |
| 80790 | CMIP | HTA11_347_2000001011 | Human | Colorectum | AD | 2.51e-13 | 6.51e-01 | -0.1954 |
| 80790 | CMIP | HTA11_411_2000001011 | Human | Colorectum | SER | 1.69e-04 | 8.33e-01 | -0.2602 |
| 80790 | CMIP | HTA11_2112_2000001011 | Human | Colorectum | SER | 2.02e-02 | 6.28e-01 | -0.2196 |
| 80790 | CMIP | HTA11_696_2000001011 | Human | Colorectum | AD | 5.44e-08 | 5.72e-01 | -0.1464 |
| 80790 | CMIP | HTA11_866_2000001011 | Human | Colorectum | AD | 3.30e-03 | 3.87e-01 | -0.1001 |
| 80790 | CMIP | HTA11_99999965062_69753 | Human | Colorectum | MSI-H | 4.37e-05 | 8.21e-01 | 0.3487 |
| 80790 | CMIP | HTA11_99999965104_69814 | Human | Colorectum | MSS | 4.91e-08 | 7.04e-01 | 0.281 |
| 80790 | CMIP | F007 | Human | Colorectum | FAP | 2.82e-04 | -2.25e-01 | 0.1176 |
| 80790 | CMIP | A001-C-207 | Human | Colorectum | FAP | 5.67e-04 | 1.80e-02 | 0.1278 |
| 80790 | CMIP | A015-C-203 | Human | Colorectum | FAP | 1.17e-28 | -3.42e-01 | -0.1294 |
| Page: 1 2 3 4 5 6 7 8 9 10 11 |
| Tissue | Expression Dynamics | Abbreviation |
| Cervix | 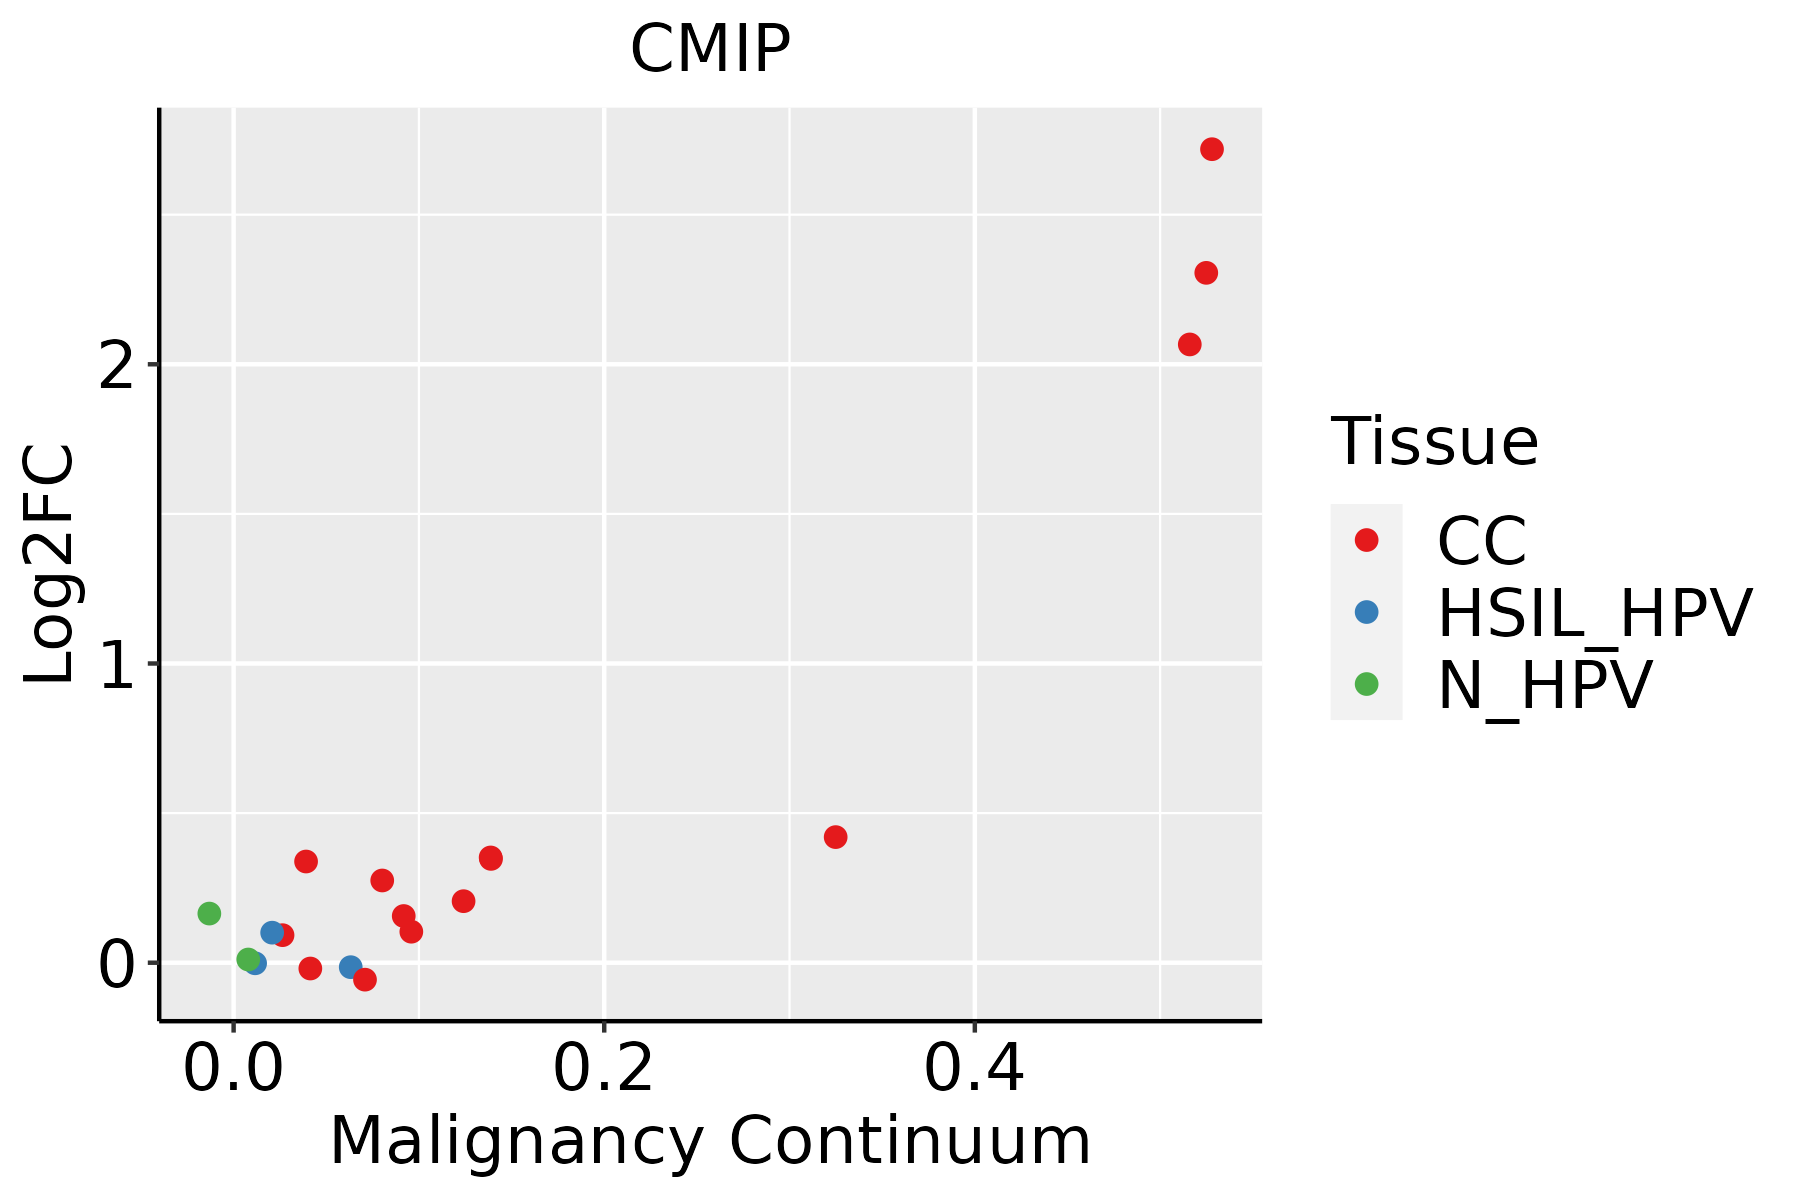 | CC: Cervix cancer |
| HSIL_HPV: HPV-infected high-grade squamous intraepithelial lesions | ||
| N_HPV: HPV-infected normal cervix | ||
| Colorectum (GSE201348) |  | FAP: Familial adenomatous polyposis |
| CRC: Colorectal cancer | ||
| Colorectum (HTA11) |  | AD: Adenomas |
| SER: Sessile serrated lesions | ||
| MSI-H: Microsatellite-high colorectal cancer | ||
| MSS: Microsatellite stable colorectal cancer | ||
| Endometrium | 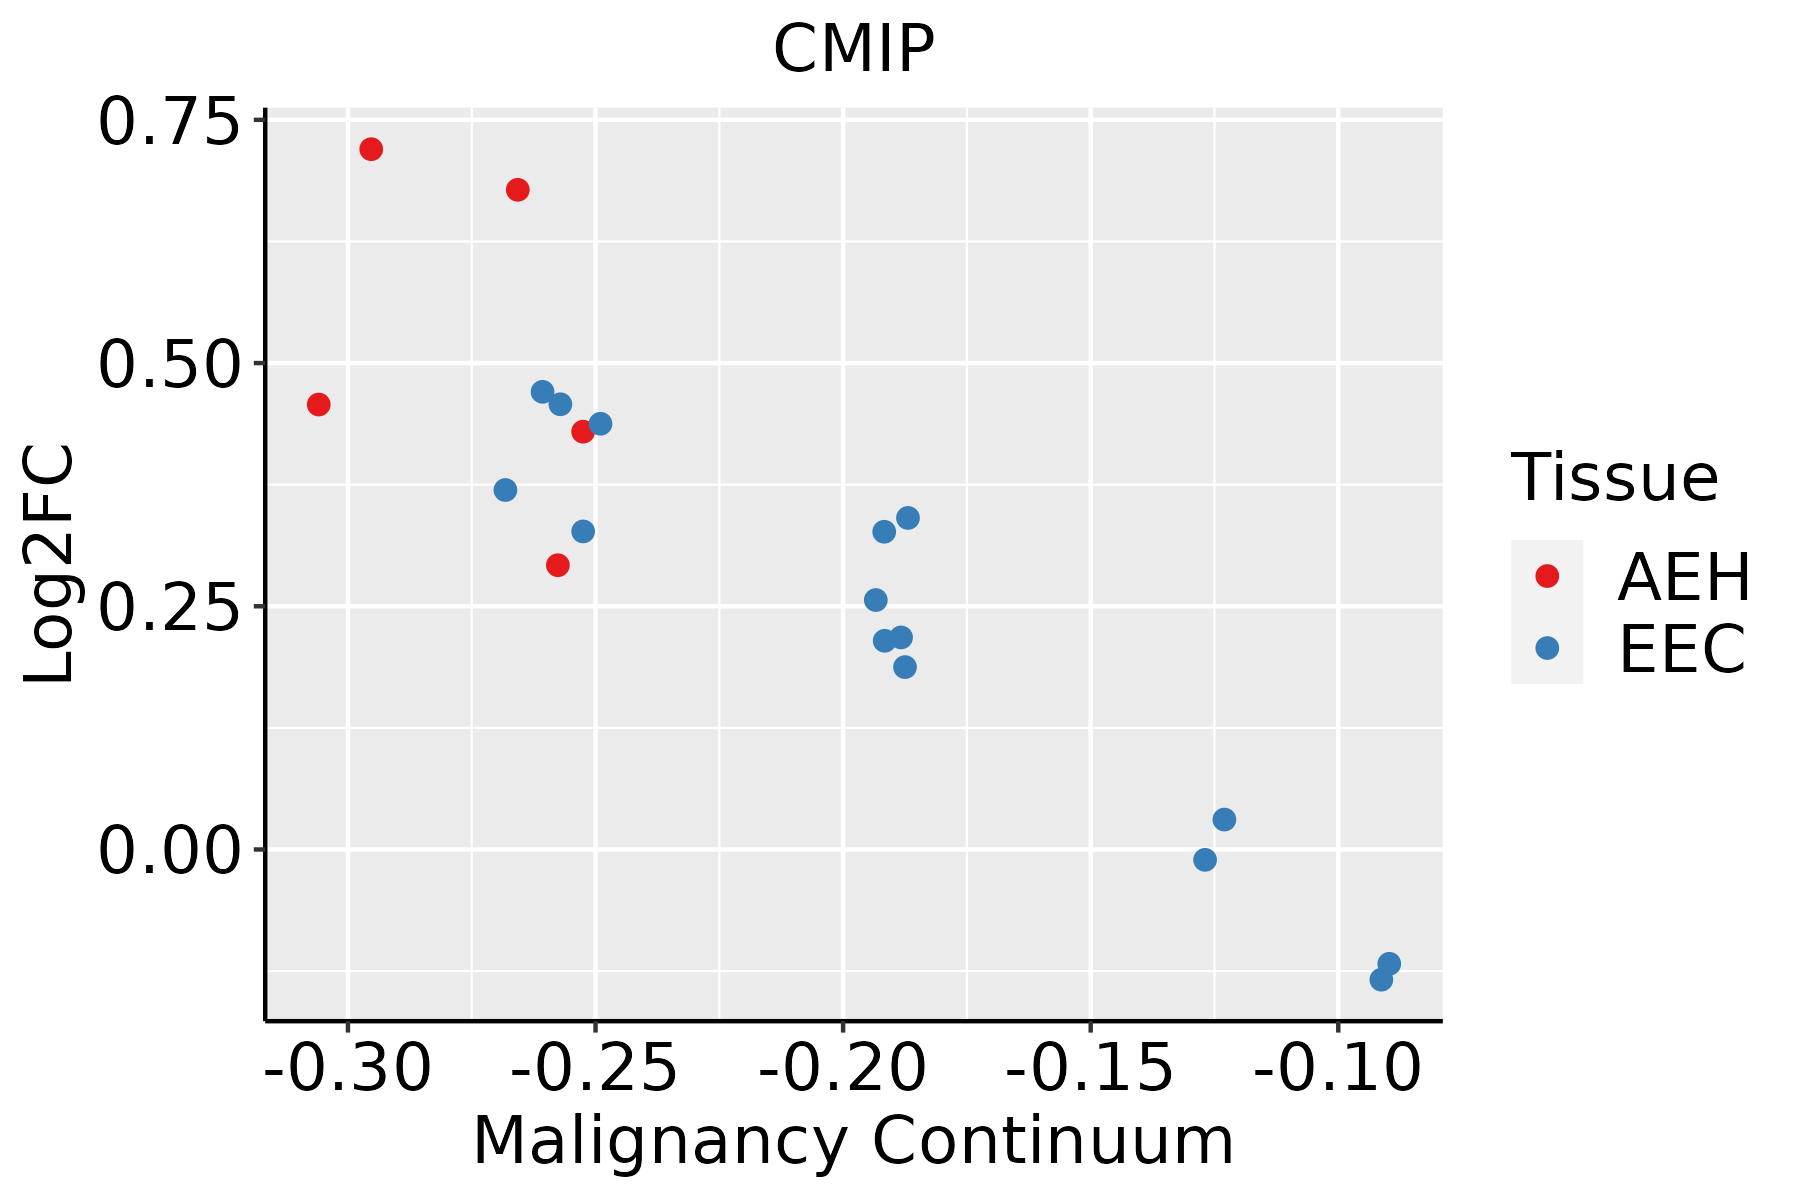 | AEH: Atypical endometrial hyperplasia |
| EEC: Endometrioid Cancer | ||
| Esophagus | 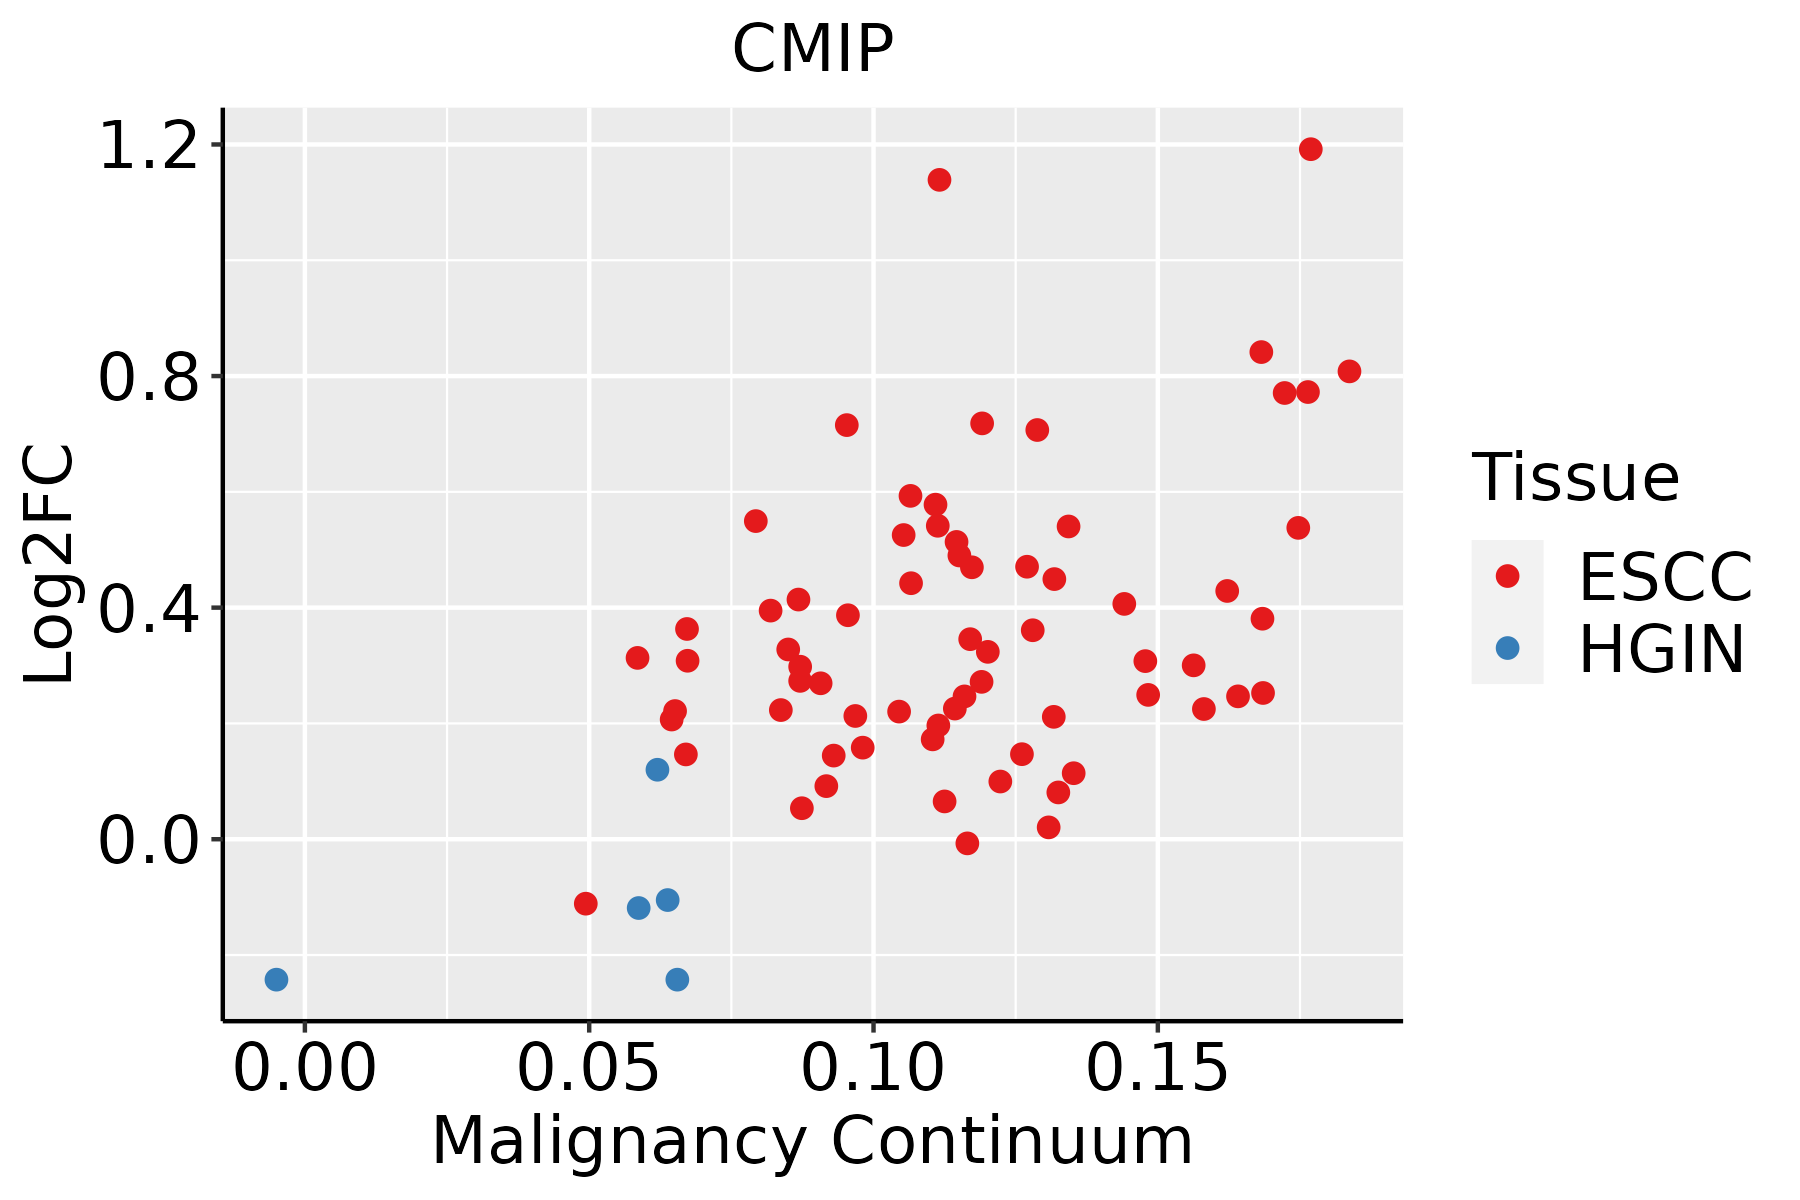 | ESCC: Esophageal squamous cell carcinoma |
| HGIN: High-grade intraepithelial neoplasias | ||
| LGIN: Low-grade intraepithelial neoplasias | ||
| GC | 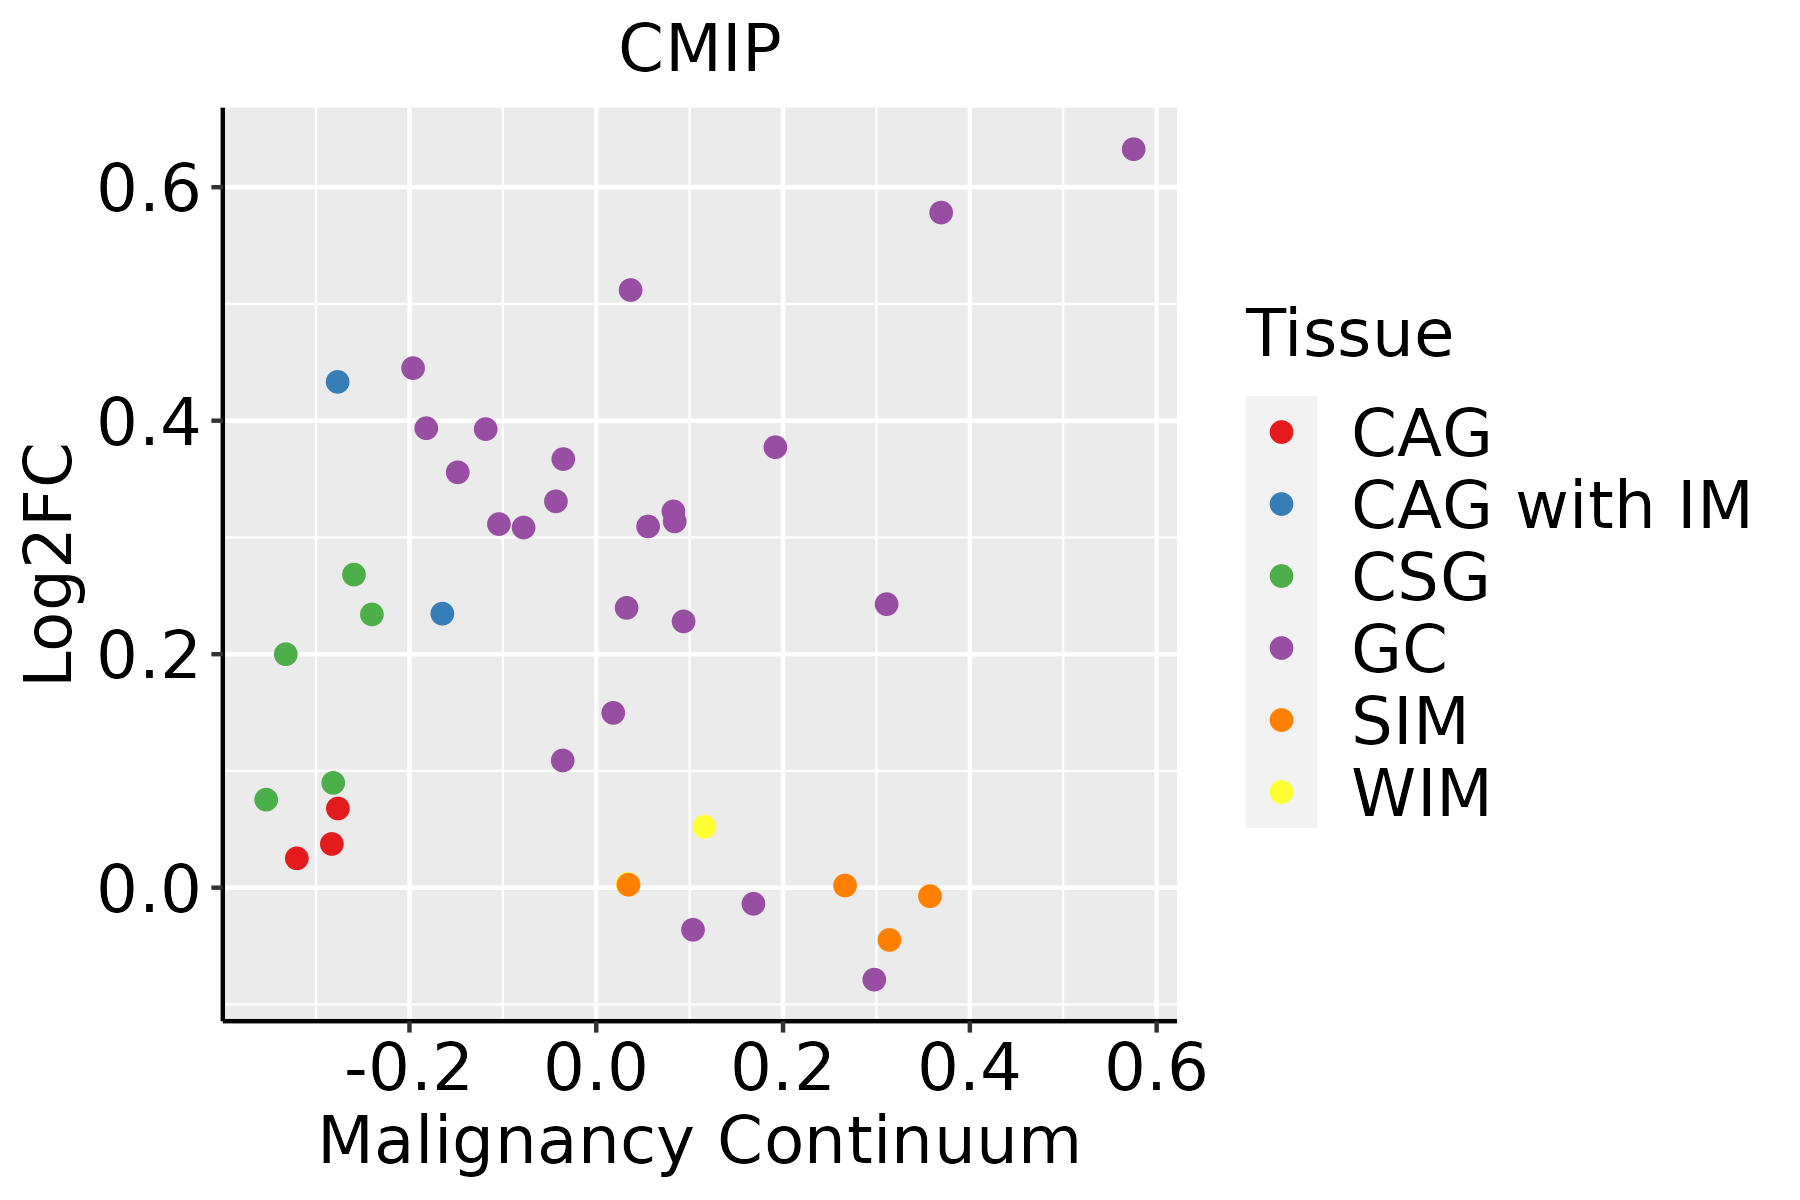 | CAG: Chronic atrophic gastritis |
| CAG with IM: Chronic atrophic gastritis with intestinal metaplasia | ||
| CSG: Chronic superficial gastritis | ||
| GC: Gastric cancer | ||
| SIM: Severe intestinal metaplasia | ||
| WIM: Wild intestinal metaplasia | ||
| Liver |  | HCC: Hepatocellular carcinoma |
| NAFLD: Non-alcoholic fatty liver disease | ||
| Lung | 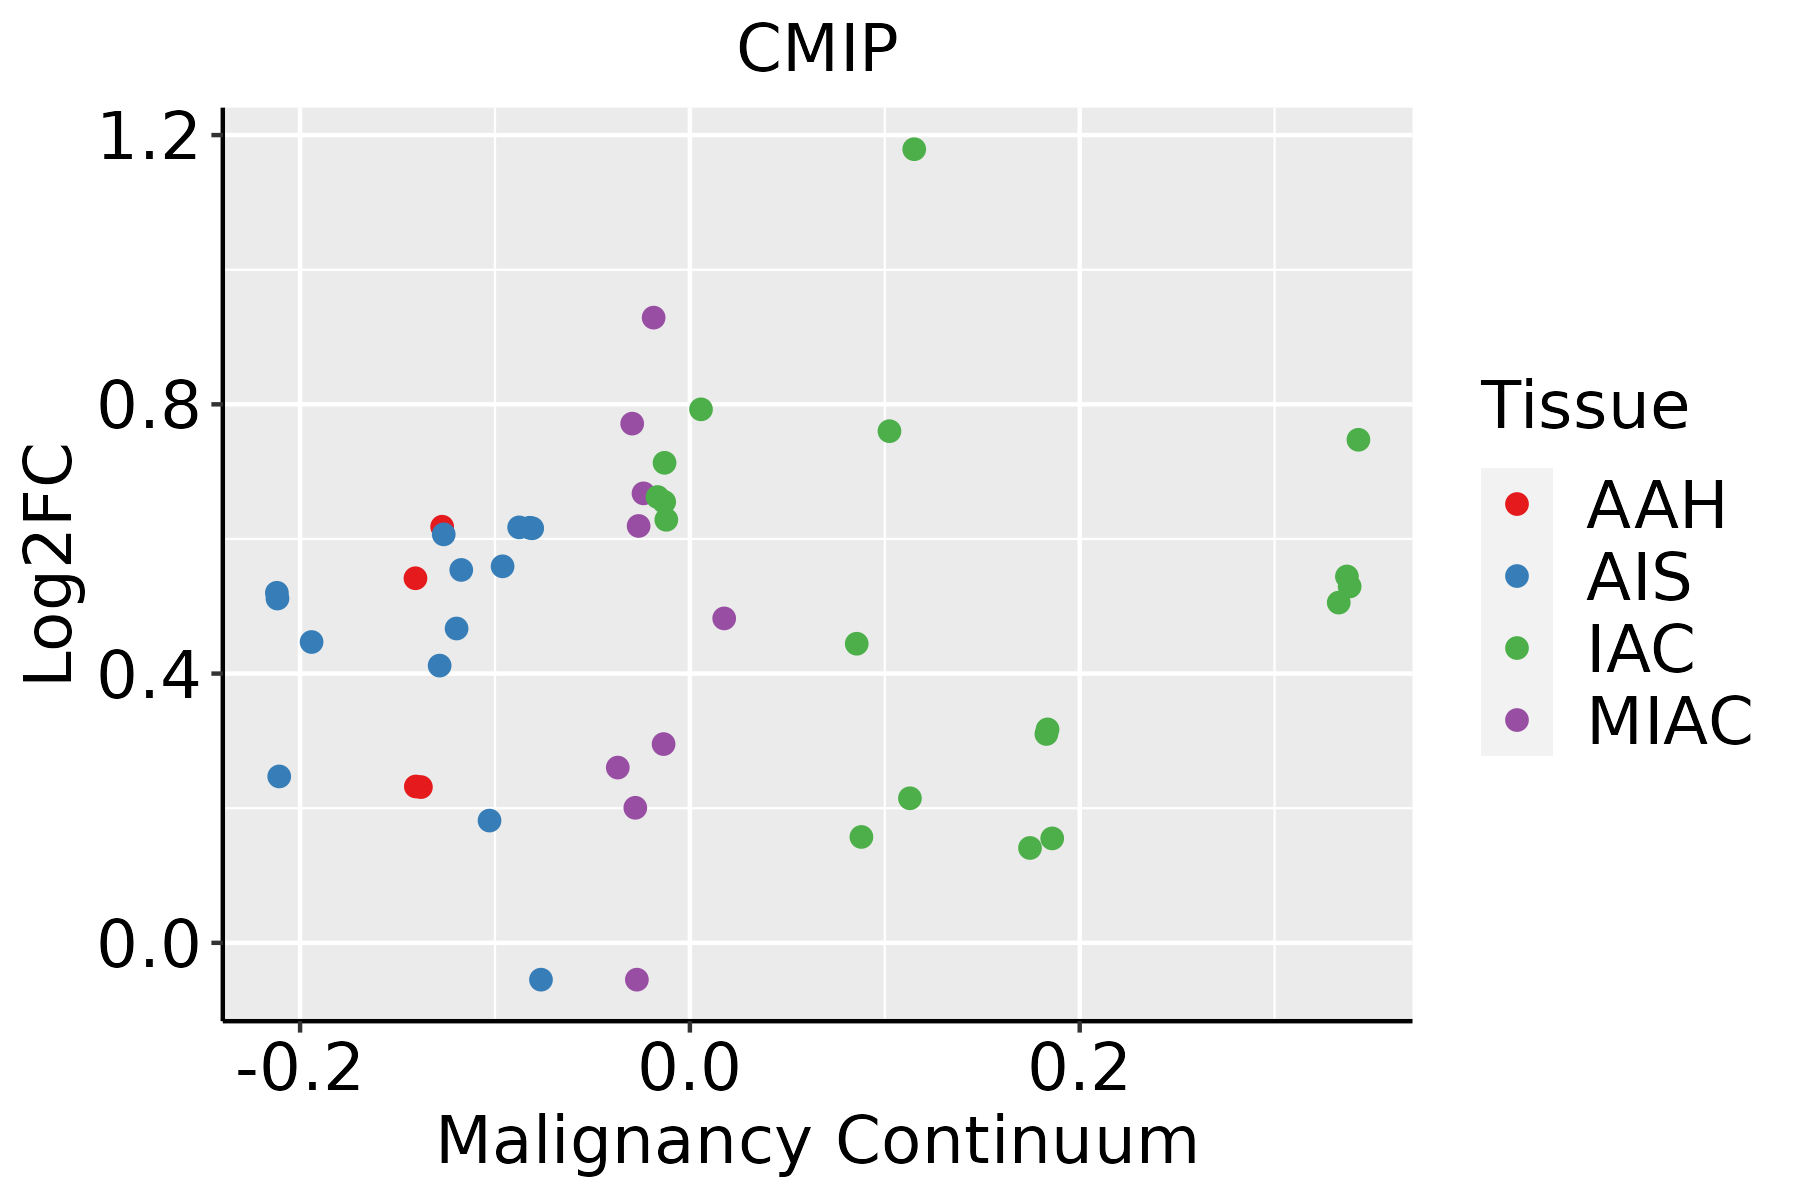 | AAH: Atypical adenomatous hyperplasia |
| AIS: Adenocarcinoma in situ | ||
| IAC: Invasive lung adenocarcinoma | ||
| MIA: Minimally invasive adenocarcinoma | ||
| Oral Cavity | 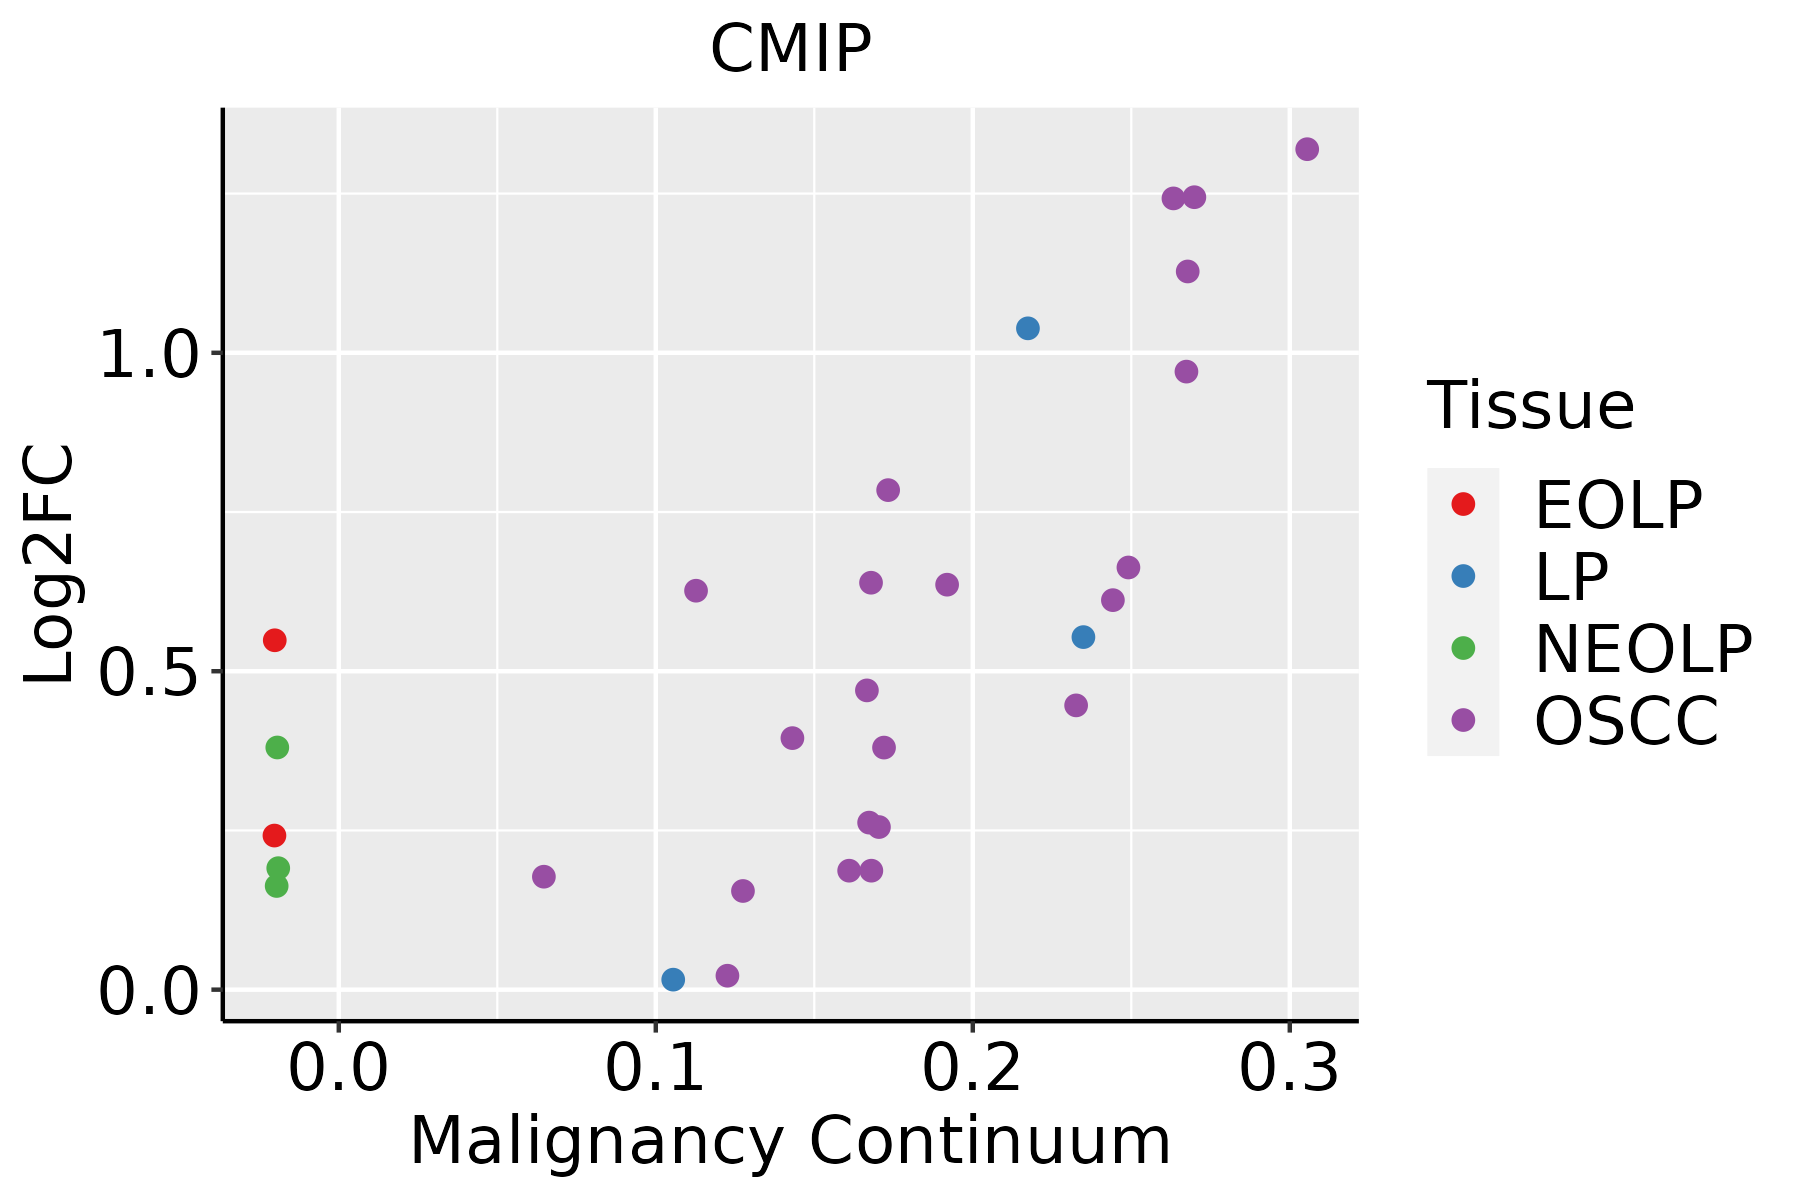 | EOLP: Erosive Oral lichen planus |
| LP: leukoplakia | ||
| NEOLP: Non-erosive oral lichen planus | ||
| OSCC: Oral squamous cell carcinoma | ||
| Prostate |  | BPH: Benign Prostatic Hyperplasia |
| Skin | 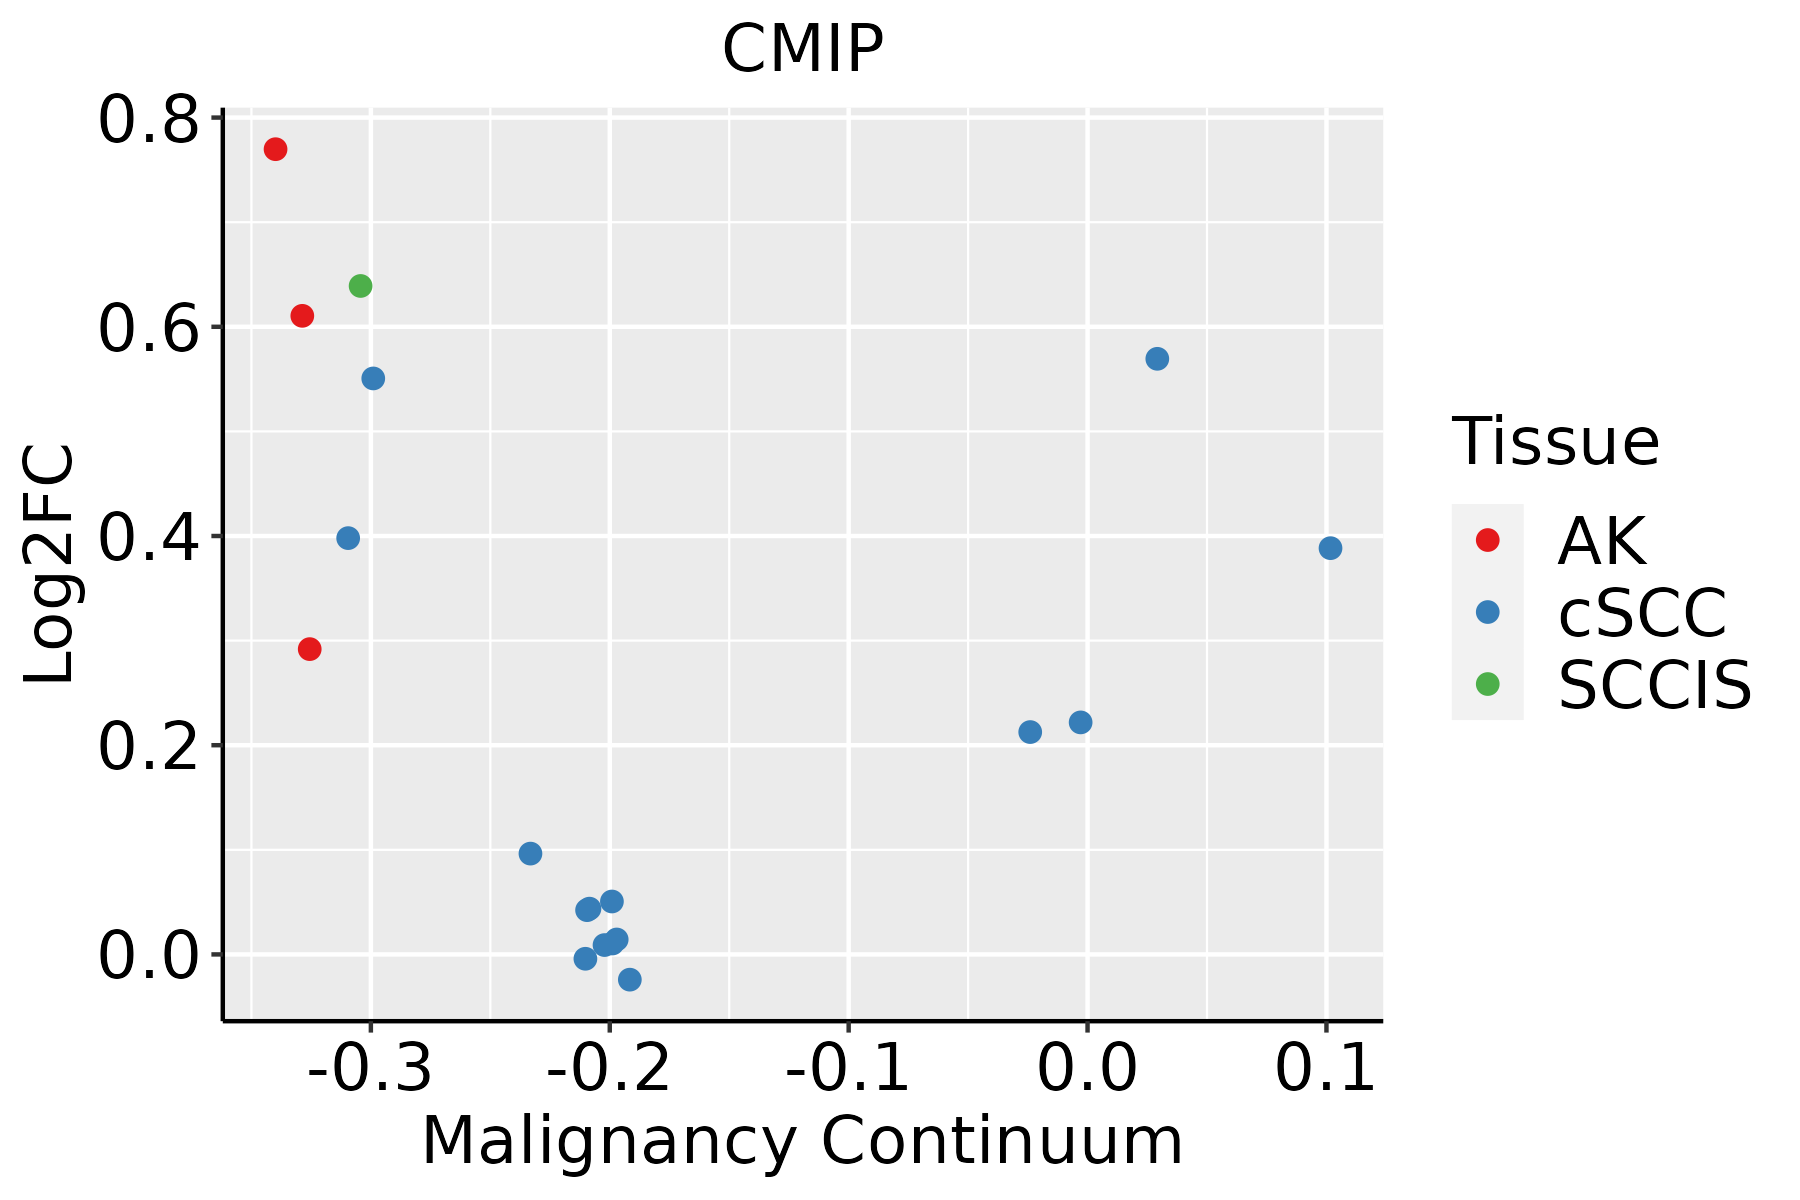 | AK: Actinic keratosis |
| cSCC: Cutaneous squamous cell carcinoma | ||
| SCCIS:squamous cell carcinoma in situ |
| ∗log2FC in expression of this searched gene in stem-like cells from each diseased tissue sample relative to stem-like cells in normal samples in each tissue plotted against the malignancy continuum. Samples are colored based on if they are from different disease stage. |
Top |
Malignant transformation related pathway analysis |
| Find out the enriched GO biological processes and KEGG pathways involved in transition from healthy to precancer to cancer |
| Tissue | Disease Stage | Enriched GO biological Processes |
| Colorectum | AD |  |
| Colorectum | SER |  |
| Colorectum | MSS |  |
| Colorectum | MSI-H |  |
| Colorectum | FAP |  |
| ∗Top 15 enriched GO BP terms are showed in the bar plot of each disease state in each tissue. Each row represents a significant GO biological process which is colored according to the -log10(p.adjust). |
| Page: 1 2 3 4 5 6 7 8 9 |
| GO ID | Tissue | Disease Stage | Description | Gene Ratio | Bg Ratio | pvalue | p.adjust | Count |
| GO:00017018 | Cervix | CC | in utero embryonic development | 71/2311 | 367/18723 | 7.21e-05 | 1.00e-03 | 71 |
| GO:0001701 | Colorectum | AD | in utero embryonic development | 110/3918 | 367/18723 | 2.36e-05 | 4.62e-04 | 110 |
| GO:00017011 | Colorectum | SER | in utero embryonic development | 77/2897 | 367/18723 | 2.77e-03 | 2.48e-02 | 77 |
| GO:00017012 | Colorectum | MSS | in utero embryonic development | 99/3467 | 367/18723 | 3.71e-05 | 7.10e-04 | 99 |
| GO:00017013 | Colorectum | FAP | in utero embryonic development | 81/2622 | 367/18723 | 1.58e-05 | 4.10e-04 | 81 |
| GO:00017014 | Colorectum | CRC | in utero embryonic development | 57/2078 | 367/18723 | 5.54e-03 | 4.19e-02 | 57 |
| GO:00017019 | Endometrium | AEH | in utero embryonic development | 73/2100 | 367/18723 | 7.18e-07 | 2.63e-05 | 73 |
| GO:000170114 | Endometrium | EEC | in utero embryonic development | 75/2168 | 367/18723 | 5.86e-07 | 2.16e-05 | 75 |
| GO:000170119 | Esophagus | ESCC | in utero embryonic development | 243/8552 | 367/18723 | 1.00e-15 | 6.86e-14 | 243 |
| GO:00017015 | Liver | Cirrhotic | in utero embryonic development | 134/4634 | 367/18723 | 2.78e-07 | 6.86e-06 | 134 |
| GO:000170111 | Liver | HCC | in utero embryonic development | 204/7958 | 367/18723 | 2.44e-07 | 4.30e-06 | 204 |
| GO:00017016 | Lung | IAC | in utero embryonic development | 68/2061 | 367/18723 | 1.12e-05 | 3.45e-04 | 68 |
| GO:000170112 | Lung | AIS | in utero embryonic development | 59/1849 | 367/18723 | 1.20e-04 | 2.75e-03 | 59 |
| GO:000170121 | Lung | AAH | in utero embryonic development | 24/613 | 367/18723 | 1.09e-03 | 3.25e-02 | 24 |
| GO:000170131 | Lung | MIAC | in utero embryonic development | 33/967 | 367/18723 | 1.44e-03 | 2.54e-02 | 33 |
| GO:000170116 | Oral cavity | OSCC | in utero embryonic development | 207/7305 | 367/18723 | 7.92e-12 | 2.95e-10 | 207 |
| GO:000170117 | Oral cavity | LP | in utero embryonic development | 142/4623 | 367/18723 | 1.48e-09 | 6.75e-08 | 142 |
| GO:000170123 | Oral cavity | EOLP | in utero embryonic development | 72/2218 | 367/18723 | 1.02e-05 | 1.83e-04 | 72 |
| GO:000170132 | Oral cavity | NEOLP | in utero embryonic development | 76/2005 | 367/18723 | 1.11e-08 | 5.44e-07 | 76 |
| GO:000170110 | Prostate | BPH | in utero embryonic development | 104/3107 | 367/18723 | 9.17e-09 | 3.10e-07 | 104 |
| Page: 1 2 |
| Pathway ID | Tissue | Disease Stage | Description | Gene Ratio | Bg Ratio | pvalue | p.adjust | qvalue | Count |
| Page: 1 |
Top |
Cell-cell communication analysis |
| Identification of potential cell-cell interactions between two cell types and their ligand-receptor pairs for different disease states |
| Ligand | Receptor | LRpair | Pathway | Tissue | Disease Stage |
| Page: 1 |
Top |
Single-cell gene regulatory network inference analysis |
| Find out the significant the regulons (TFs) and the target genes of each regulon across cell types for different disease states |
| TF | Cell Type | Tissue | Disease Stage | Target Gene | RSS | Regulon Activity |
| ∗The dot plots of a searched regulon are shown for all cell subpopulations in each disease state of each tissue based on the regulon specific score inferred using pySCENIC and by calculating the average expression. |
| Page: 1 |
Top |
Somatic mutation of malignant transformation related genes |
| Annotation of somatic variants for genes involved in malignant transformation |
| Hugo Symbol | Variant Class | Variant Classification | dbSNP RS | HGVSc | HGVSp | HGVSp Short | SWISSPROT | BIOTYPE | SIFT | PolyPhen | Tumor Sample Barcode | Tissue | Histology | Sex | Age | Stage | Therapy Types | Drugs | Outcome |
| CMIP | SNV | Missense_Mutation | c.2110C>T | p.Arg704Trp | p.R704W | Q8IY22 | protein_coding | deleterious(0.01) | possibly_damaging(0.841) | TCGA-C8-A12T-01 | Breast | breast invasive carcinoma | Female | <65 | I/II | Unknown | Unknown | SD | |
| CMIP | SNV | Missense_Mutation | c.1975N>T | p.Gly659Cys | p.G659C | Q8IY22 | protein_coding | deleterious(0) | probably_damaging(0.999) | TCGA-E2-A1IK-01 | Breast | breast invasive carcinoma | Female | >=65 | I/II | Hormone Therapy | arimidex | SD | |
| CMIP | SNV | Missense_Mutation | c.203C>T | p.Pro68Leu | p.P68L | Q8IY22 | protein_coding | deleterious(0.02) | benign(0.007) | TCGA-EK-A3GK-01 | Cervix | cervical & endocervical cancer | Female | <65 | I/II | Unknown | Unknown | SD | |
| CMIP | SNV | Missense_Mutation | novel | c.1984G>A | p.Gly662Arg | p.G662R | Q8IY22 | protein_coding | deleterious(0.03) | probably_damaging(0.997) | TCGA-VS-A8QM-01 | Cervix | cervical & endocervical cancer | Female | <65 | I/II | Chemotherapy | cisplatin | PD |
| CMIP | SNV | Missense_Mutation | c.1187N>A | p.Val396Asp | p.V396D | Q8IY22 | protein_coding | deleterious_low_confidence(0) | benign(0.125) | TCGA-AA-3492-01 | Colorectum | colon adenocarcinoma | Female | >=65 | I/II | Unknown | Unknown | SD | |
| CMIP | SNV | Missense_Mutation | c.1654N>T | p.Gly552Cys | p.G552C | Q8IY22 | protein_coding | deleterious(0.01) | probably_damaging(0.998) | TCGA-AA-3502-01 | Colorectum | colon adenocarcinoma | Male | >=65 | I/II | Unknown | Unknown | SD | |
| CMIP | SNV | Missense_Mutation | c.688N>A | p.Ala230Thr | p.A230T | Q8IY22 | protein_coding | tolerated(0.07) | probably_damaging(0.981) | TCGA-AZ-4313-01 | Colorectum | colon adenocarcinoma | Female | <65 | I/II | Unknown | Unknown | SD | |
| CMIP | SNV | Missense_Mutation | c.635C>T | p.Ser212Leu | p.S212L | Q8IY22 | protein_coding | tolerated(0.18) | benign(0.057) | TCGA-CK-4951-01 | Colorectum | colon adenocarcinoma | Female | >=65 | I/II | Unknown | Unknown | PD | |
| CMIP | SNV | Missense_Mutation | c.2276N>C | p.Leu759Pro | p.L759P | Q8IY22 | protein_coding | deleterious(0) | probably_damaging(0.996) | TCGA-CM-5861-01 | Colorectum | colon adenocarcinoma | Female | <65 | I/II | Unknown | Unknown | PD | |
| CMIP | SNV | Missense_Mutation | c.1114C>T | p.Arg372Cys | p.R372C | Q8IY22 | protein_coding | deleterious_low_confidence(0) | probably_damaging(0.982) | TCGA-D5-6930-01 | Colorectum | colon adenocarcinoma | Male | >=65 | I/II | Unknown | Unknown | SD |
| Page: 1 2 3 4 5 6 |
Top |
Related drugs of malignant transformation related genes |
| Identification of chemicals and drugs interact with genes involved in malignant transfromation |
| (DGIdb 4.0) |
| Entrez ID | Symbol | Category | Interaction Types | Drug Claim Name | Drug Name | PMIDs |
| Page: 1 |

Copyright 2023-Present -The University of Texas Health Science Center at Houston |