
|
|||||
|
 | |
| |
| |
| |
| |
| |
|
Gene: CMC2 |
Gene summary for CMC2 |
| Gene information | Species | Human | Gene symbol | CMC2 | Gene ID | 56942 |
| Gene name | C-X9-C motif containing 2 | |
| Gene Alias | 2310061C15Rik | |
| Cytomap | 16q23.2 | |
| Gene Type | protein-coding | GO ID | GO:0005575 | UniProtAcc | Q9NRP2 |
Top |
Malignant transformation analysis |
| Identification of the aberrant gene expression in precancerous and cancerous lesions by comparing the gene expression of stem-like cells in diseased tissues with normal stem cells |
| Entrez ID | Symbol | Replicates | Species | Organ | Tissue | Adj P-value | Log2FC | Malignancy |
| 56942 | CMC2 | LZE4T | Human | Esophagus | ESCC | 8.28e-15 | 5.39e-01 | 0.0811 |
| 56942 | CMC2 | LZE7T | Human | Esophagus | ESCC | 1.25e-11 | 7.77e-01 | 0.0667 |
| 56942 | CMC2 | LZE8T | Human | Esophagus | ESCC | 8.73e-09 | 3.79e-01 | 0.067 |
| 56942 | CMC2 | LZE20T | Human | Esophagus | ESCC | 7.33e-04 | 2.13e-01 | 0.0662 |
| 56942 | CMC2 | LZE22D1 | Human | Esophagus | HGIN | 1.27e-02 | -6.62e-02 | 0.0595 |
| 56942 | CMC2 | LZE22T | Human | Esophagus | ESCC | 1.01e-05 | 6.44e-01 | 0.068 |
| 56942 | CMC2 | LZE24T | Human | Esophagus | ESCC | 2.87e-18 | 4.80e-01 | 0.0596 |
| 56942 | CMC2 | LZE21T | Human | Esophagus | ESCC | 2.71e-05 | 4.55e-01 | 0.0655 |
| 56942 | CMC2 | LZE6T | Human | Esophagus | ESCC | 1.38e-12 | 4.90e-01 | 0.0845 |
| 56942 | CMC2 | P1T-E | Human | Esophagus | ESCC | 4.23e-04 | 4.85e-01 | 0.0875 |
| 56942 | CMC2 | P2T-E | Human | Esophagus | ESCC | 1.69e-17 | 2.82e-01 | 0.1177 |
| 56942 | CMC2 | P4T-E | Human | Esophagus | ESCC | 3.54e-29 | 7.62e-01 | 0.1323 |
| 56942 | CMC2 | P5T-E | Human | Esophagus | ESCC | 5.15e-29 | 7.80e-01 | 0.1327 |
| 56942 | CMC2 | P8T-E | Human | Esophagus | ESCC | 1.40e-24 | 5.92e-01 | 0.0889 |
| 56942 | CMC2 | P9T-E | Human | Esophagus | ESCC | 2.12e-16 | 4.21e-01 | 0.1131 |
| 56942 | CMC2 | P10T-E | Human | Esophagus | ESCC | 1.14e-10 | 2.21e-01 | 0.116 |
| 56942 | CMC2 | P11T-E | Human | Esophagus | ESCC | 4.37e-17 | 7.88e-01 | 0.1426 |
| 56942 | CMC2 | P12T-E | Human | Esophagus | ESCC | 3.28e-40 | 9.27e-01 | 0.1122 |
| 56942 | CMC2 | P15T-E | Human | Esophagus | ESCC | 2.03e-35 | 9.48e-01 | 0.1149 |
| 56942 | CMC2 | P16T-E | Human | Esophagus | ESCC | 2.18e-16 | 1.85e-01 | 0.1153 |
| Page: 1 2 3 4 5 6 |
| Tissue | Expression Dynamics | Abbreviation |
| Esophagus |  | ESCC: Esophageal squamous cell carcinoma |
| HGIN: High-grade intraepithelial neoplasias | ||
| LGIN: Low-grade intraepithelial neoplasias | ||
| Liver |  | HCC: Hepatocellular carcinoma |
| NAFLD: Non-alcoholic fatty liver disease | ||
| Oral Cavity | 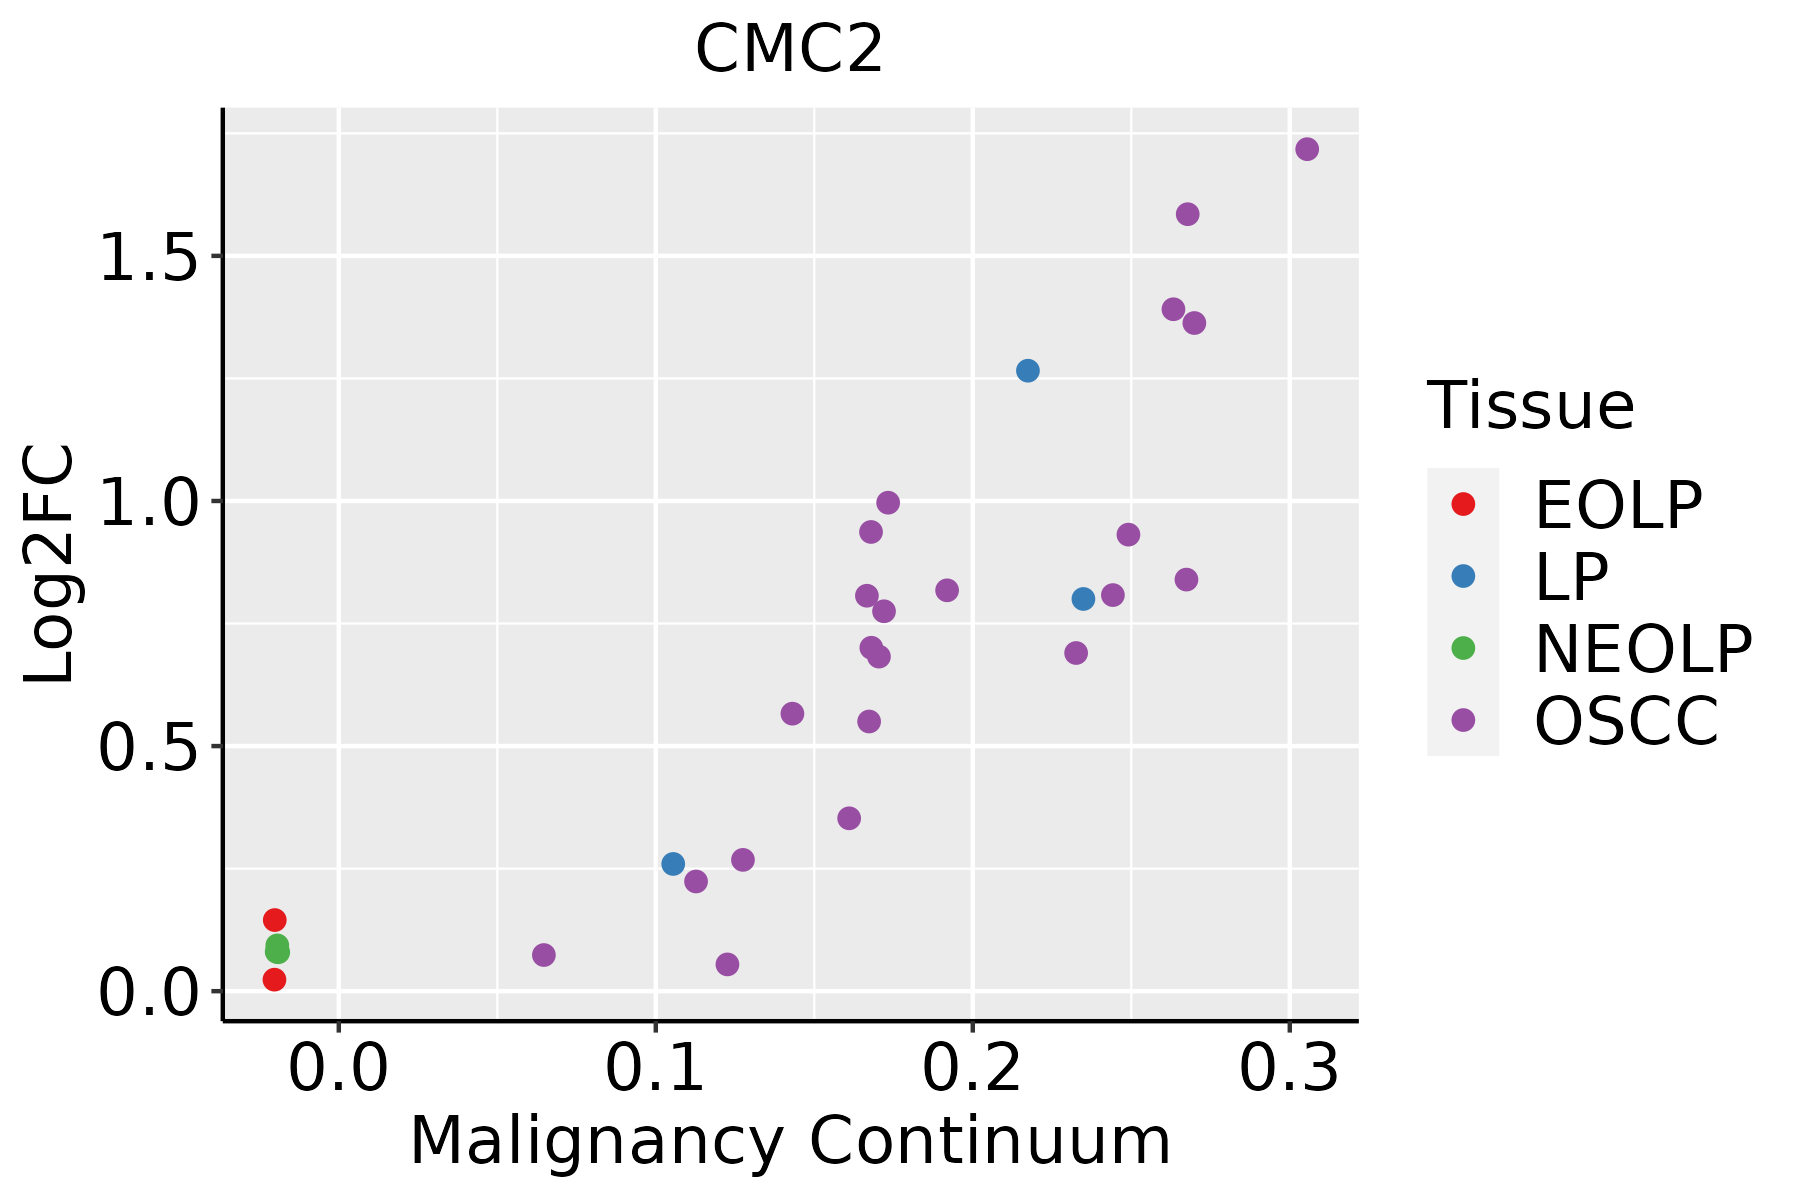 | EOLP: Erosive Oral lichen planus |
| LP: leukoplakia | ||
| NEOLP: Non-erosive oral lichen planus | ||
| OSCC: Oral squamous cell carcinoma | ||
| Prostate | 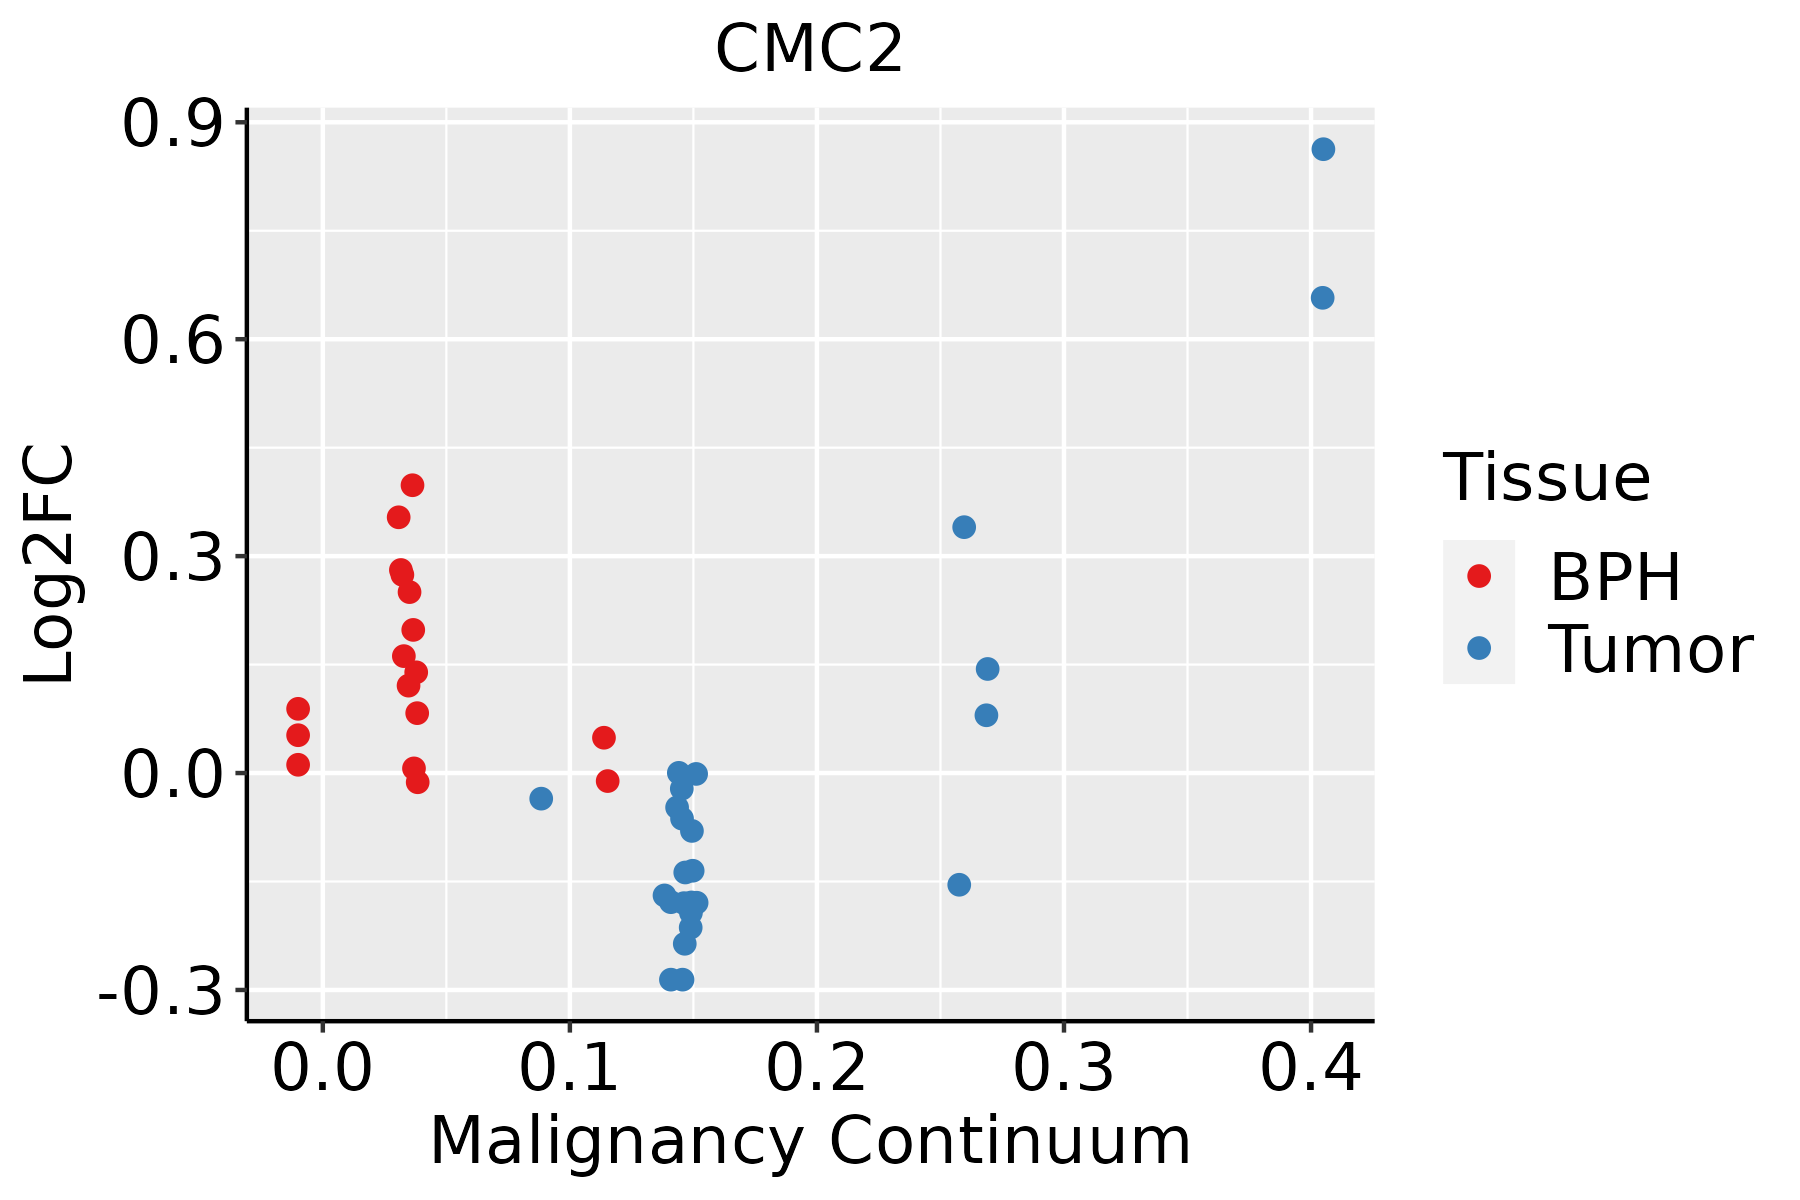 | BPH: Benign Prostatic Hyperplasia |
| Thyroid |  | ATC: Anaplastic thyroid cancer |
| HT: Hashimoto's thyroiditis | ||
| PTC: Papillary thyroid cancer |
| ∗log2FC in expression of this searched gene in stem-like cells from each diseased tissue sample relative to stem-like cells in normal samples in each tissue plotted against the malignancy continuum. Samples are colored based on if they are from different disease stage. |
Top |
Malignant transformation related pathway analysis |
| Find out the enriched GO biological processes and KEGG pathways involved in transition from healthy to precancer to cancer |
| Tissue | Disease Stage | Enriched GO biological Processes |
| Colorectum | AD |  |
| Colorectum | SER |  |
| Colorectum | MSS |  |
| Colorectum | MSI-H |  |
| Colorectum | FAP |  |
| ∗Top 15 enriched GO BP terms are showed in the bar plot of each disease state in each tissue. Each row represents a significant GO biological process which is colored according to the -log10(p.adjust). |
| Page: 1 2 3 4 5 6 7 8 9 |
| GO ID | Tissue | Disease Stage | Description | Gene Ratio | Bg Ratio | pvalue | p.adjust | Count |
| Page: 1 |
| Pathway ID | Tissue | Disease Stage | Description | Gene Ratio | Bg Ratio | pvalue | p.adjust | qvalue | Count |
| Page: 1 |
Top |
Cell-cell communication analysis |
| Identification of potential cell-cell interactions between two cell types and their ligand-receptor pairs for different disease states |
| Ligand | Receptor | LRpair | Pathway | Tissue | Disease Stage |
| Page: 1 |
Top |
Single-cell gene regulatory network inference analysis |
| Find out the significant the regulons (TFs) and the target genes of each regulon across cell types for different disease states |
| TF | Cell Type | Tissue | Disease Stage | Target Gene | RSS | Regulon Activity |
| ∗The dot plots of a searched regulon are shown for all cell subpopulations in each disease state of each tissue based on the regulon specific score inferred using pySCENIC and by calculating the average expression. |
| Page: 1 |
Top |
Somatic mutation of malignant transformation related genes |
| Annotation of somatic variants for genes involved in malignant transformation |
| Hugo Symbol | Variant Class | Variant Classification | dbSNP RS | HGVSc | HGVSp | HGVSp Short | SWISSPROT | BIOTYPE | SIFT | PolyPhen | Tumor Sample Barcode | Tissue | Histology | Sex | Age | Stage | Therapy Types | Drugs | Outcome |
| CMC2 | SNV | Missense_Mutation | rs781067998 | c.125N>A | p.Arg42Gln | p.R42Q | Q9NRP2 | protein_coding | tolerated(0.26) | benign(0.047) | TCGA-CM-5861-01 | Colorectum | colon adenocarcinoma | Female | <65 | I/II | Unknown | Unknown | PD |
| CMC2 | insertion | Frame_Shift_Ins | novel | c.102_103insT | p.Gly35TrpfsTer4 | p.G35Wfs*4 | Q9NRP2 | protein_coding | TCGA-D5-6540-01 | Colorectum | colon adenocarcinoma | Male | >=65 | I/II | Unknown | Unknown | SD | ||
| CMC2 | SNV | Missense_Mutation | rs376325635 | c.232N>A | p.Glu78Lys | p.E78K | Q9NRP2 | protein_coding | deleterious(0.04) | benign(0) | TCGA-A5-A0G2-01 | Endometrium | uterine corpus endometrioid carcinoma | Female | <65 | III/IV | Unknown | Unknown | SD |
| CMC2 | SNV | Missense_Mutation | novel | c.81N>G | p.Asn27Lys | p.N27K | Q9NRP2 | protein_coding | tolerated(0.1) | benign(0.011) | TCGA-A5-A7WJ-01 | Endometrium | uterine corpus endometrioid carcinoma | Female | <65 | I/II | Unknown | Unknown | SD |
| CMC2 | SNV | Missense_Mutation | rs541435706 | c.204G>T | p.Lys68Asn | p.K68N | Q9NRP2 | protein_coding | deleterious(0.02) | benign(0.197) | TCGA-AJ-A3EL-01 | Endometrium | uterine corpus endometrioid carcinoma | Female | <65 | I/II | Unknown | Unknown | SD |
| CMC2 | SNV | Missense_Mutation | rs781067998 | c.125N>A | p.Arg42Gln | p.R42Q | Q9NRP2 | protein_coding | tolerated(0.26) | benign(0.047) | TCGA-B5-A1MX-01 | Endometrium | uterine corpus endometrioid carcinoma | Female | <65 | I/II | Hormone Therapy | megace | SD |
| CMC2 | SNV | Missense_Mutation | novel | c.188N>T | p.Gly63Val | p.G63V | Q9NRP2 | protein_coding | deleterious(0.01) | benign(0.435) | TCGA-B5-A3FC-01 | Endometrium | uterine corpus endometrioid carcinoma | Female | <65 | I/II | Unknown | Unknown | SD |
| CMC2 | SNV | Missense_Mutation | rs768875620 | c.112N>G | p.Asn38Asp | p.N38D | Q9NRP2 | protein_coding | deleterious(0.01) | probably_damaging(0.946) | TCGA-D1-A175-01 | Endometrium | uterine corpus endometrioid carcinoma | Female | <65 | I/II | Chemotherapy | paclitaxel | SD |
| CMC2 | SNV | Missense_Mutation | novel | c.198N>T | p.Met66Ile | p.M66I | Q9NRP2 | protein_coding | deleterious(0.04) | benign(0.087) | TCGA-37-3792-01 | Lung | lung squamous cell carcinoma | Male | >=65 | I/II | Unknown | Unknown | SD |
| CMC2 | SNV | Missense_Mutation | rs745359055 | c.217C>T | p.Pro73Ser | p.P73S | Q9NRP2 | protein_coding | tolerated(0.64) | benign(0) | TCGA-56-8083-01 | Lung | lung squamous cell carcinoma | Male | <65 | I/II | Unknown | Unknown | SD |
| Page: 1 2 |
Top |
Related drugs of malignant transformation related genes |
| Identification of chemicals and drugs interact with genes involved in malignant transfromation |
| (DGIdb 4.0) |
| Entrez ID | Symbol | Category | Interaction Types | Drug Claim Name | Drug Name | PMIDs |
| Page: 1 |

Copyright 2023-Present -The University of Texas Health Science Center at Houston |