
|
|||||
|
 | |
| |
| |
| |
| |
| |
|
Gene: CMC1 |
Gene summary for CMC1 |
| Gene information | Species | Human | Gene symbol | CMC1 | Gene ID | 152100 |
| Gene name | C-X9-C motif containing 1 | |
| Gene Alias | C3orf68 | |
| Cytomap | 3p24.1 | |
| Gene Type | protein-coding | GO ID | GO:0005575 | UniProtAcc | C9JES7 |
Top |
Malignant transformation analysis |
| Identification of the aberrant gene expression in precancerous and cancerous lesions by comparing the gene expression of stem-like cells in diseased tissues with normal stem cells |
| Entrez ID | Symbol | Replicates | Species | Organ | Tissue | Adj P-value | Log2FC | Malignancy |
| 152100 | CMC1 | HTA11_3410_2000001011 | Human | Colorectum | AD | 7.35e-15 | -5.41e-01 | 0.0155 |
| 152100 | CMC1 | HTA11_2487_2000001011 | Human | Colorectum | SER | 2.94e-02 | -3.13e-01 | -0.1808 |
| 152100 | CMC1 | HTA11_696_2000001011 | Human | Colorectum | AD | 1.76e-05 | -3.54e-01 | -0.1464 |
| 152100 | CMC1 | HTA11_866_3004761011 | Human | Colorectum | AD | 1.08e-03 | -4.18e-01 | 0.096 |
| 152100 | CMC1 | HTA11_10711_2000001011 | Human | Colorectum | AD | 1.24e-02 | -4.36e-01 | 0.0338 |
| 152100 | CMC1 | HTA11_7696_3000711011 | Human | Colorectum | AD | 1.38e-10 | -4.82e-01 | 0.0674 |
| 152100 | CMC1 | HTA11_6818_2000001021 | Human | Colorectum | AD | 4.99e-02 | -3.85e-01 | 0.0588 |
| 152100 | CMC1 | HTA11_99999970781_79442 | Human | Colorectum | MSS | 4.30e-03 | -3.36e-01 | 0.294 |
| 152100 | CMC1 | HTA11_99999973899_84307 | Human | Colorectum | MSS | 9.89e-05 | -5.59e-01 | 0.2585 |
| 152100 | CMC1 | HTA11_99999974143_84620 | Human | Colorectum | MSS | 3.57e-15 | -5.18e-01 | 0.3005 |
| 152100 | CMC1 | A001-C-207 | Human | Colorectum | FAP | 2.23e-03 | -3.07e-01 | 0.1278 |
| 152100 | CMC1 | A015-C-203 | Human | Colorectum | FAP | 1.23e-23 | -4.61e-01 | -0.1294 |
| 152100 | CMC1 | A015-C-204 | Human | Colorectum | FAP | 1.00e-06 | -3.86e-01 | -0.0228 |
| 152100 | CMC1 | A014-C-040 | Human | Colorectum | FAP | 4.48e-03 | -3.27e-01 | -0.1184 |
| 152100 | CMC1 | A002-C-201 | Human | Colorectum | FAP | 9.38e-18 | -4.83e-01 | 0.0324 |
| 152100 | CMC1 | A002-C-203 | Human | Colorectum | FAP | 9.94e-06 | -2.53e-01 | 0.2786 |
| 152100 | CMC1 | A001-C-119 | Human | Colorectum | FAP | 4.00e-10 | -5.74e-01 | -0.1557 |
| 152100 | CMC1 | A001-C-108 | Human | Colorectum | FAP | 1.85e-20 | -4.32e-01 | -0.0272 |
| 152100 | CMC1 | A002-C-205 | Human | Colorectum | FAP | 1.33e-24 | -5.46e-01 | -0.1236 |
| 152100 | CMC1 | A001-C-104 | Human | Colorectum | FAP | 1.74e-06 | -3.29e-01 | 0.0184 |
| Page: 1 2 3 4 5 6 7 8 |
| Tissue | Expression Dynamics | Abbreviation |
| Colorectum (GSE201348) |  | FAP: Familial adenomatous polyposis |
| CRC: Colorectal cancer | ||
| Colorectum (HTA11) |  | AD: Adenomas |
| SER: Sessile serrated lesions | ||
| MSI-H: Microsatellite-high colorectal cancer | ||
| MSS: Microsatellite stable colorectal cancer | ||
| Esophagus | 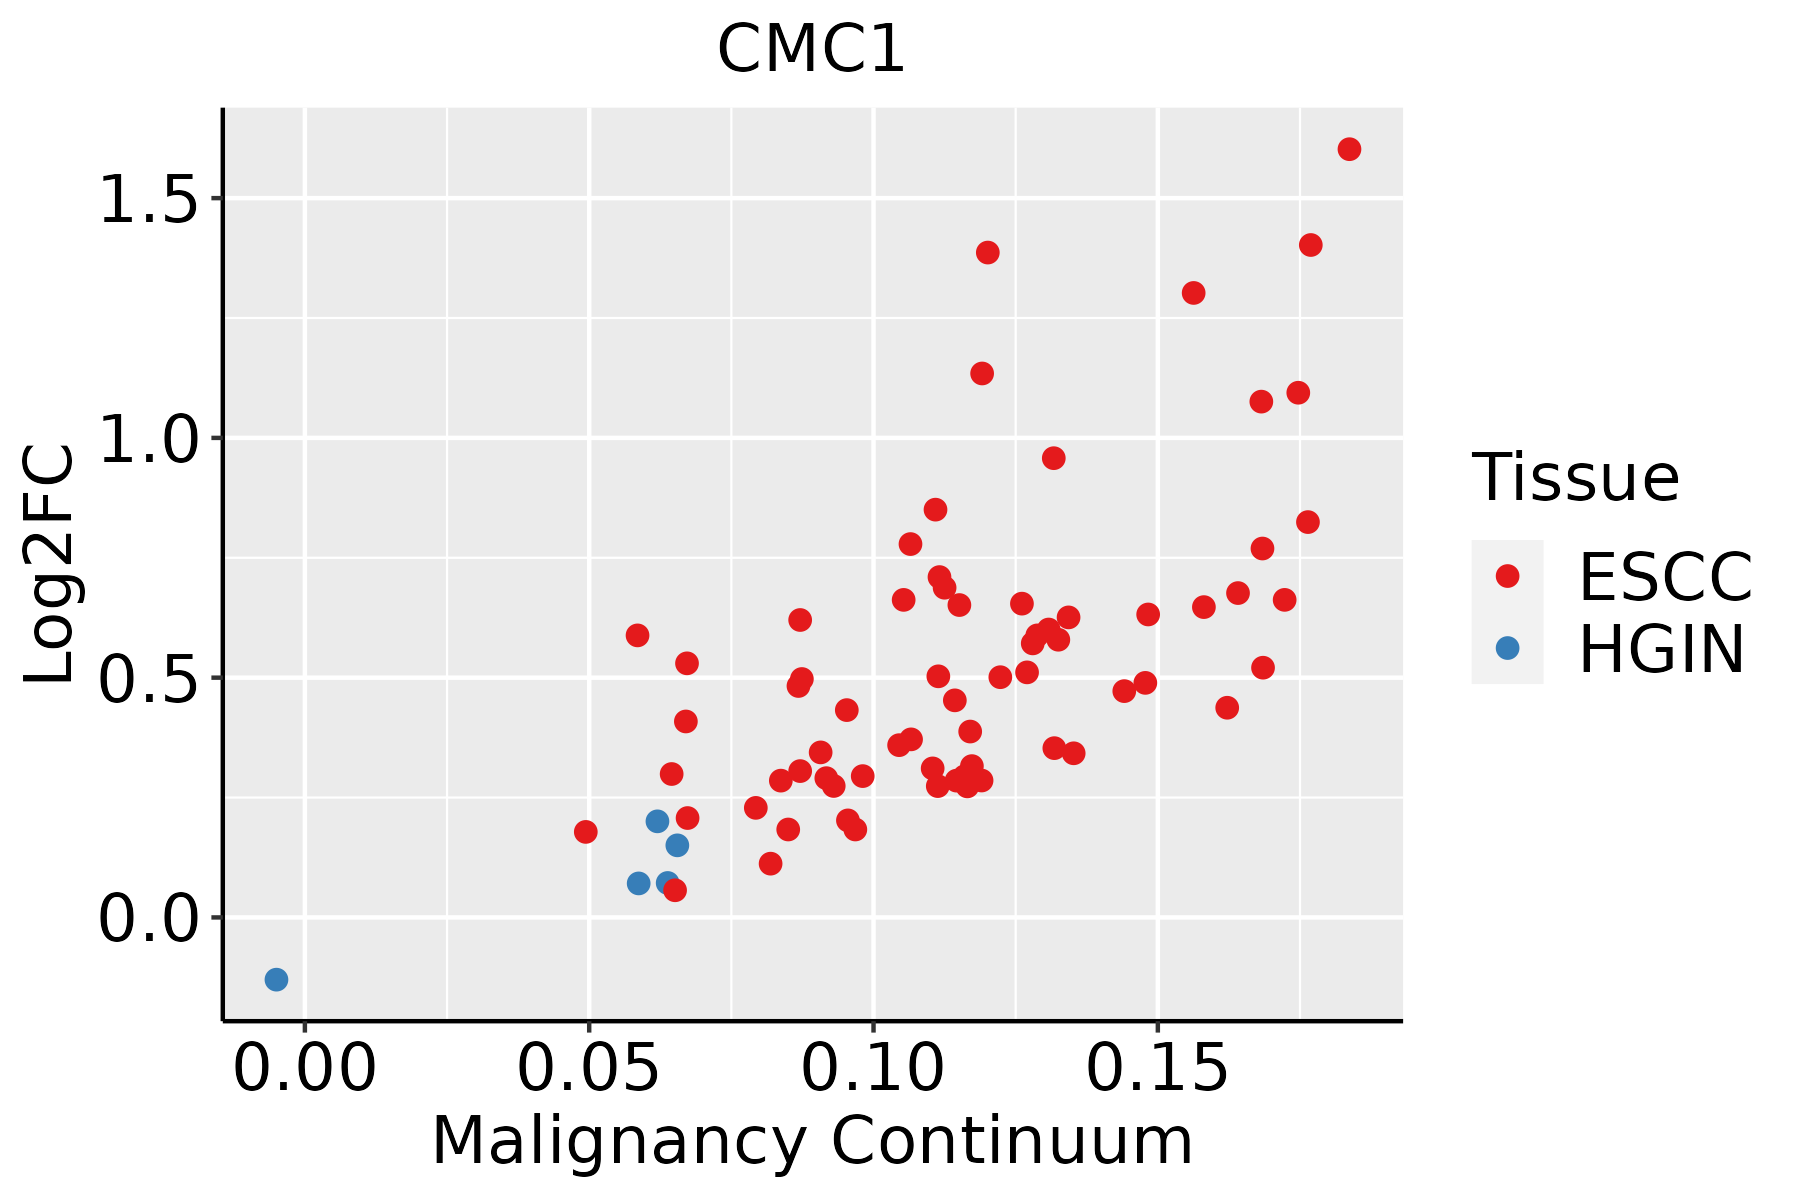 | ESCC: Esophageal squamous cell carcinoma |
| HGIN: High-grade intraepithelial neoplasias | ||
| LGIN: Low-grade intraepithelial neoplasias | ||
| Liver | 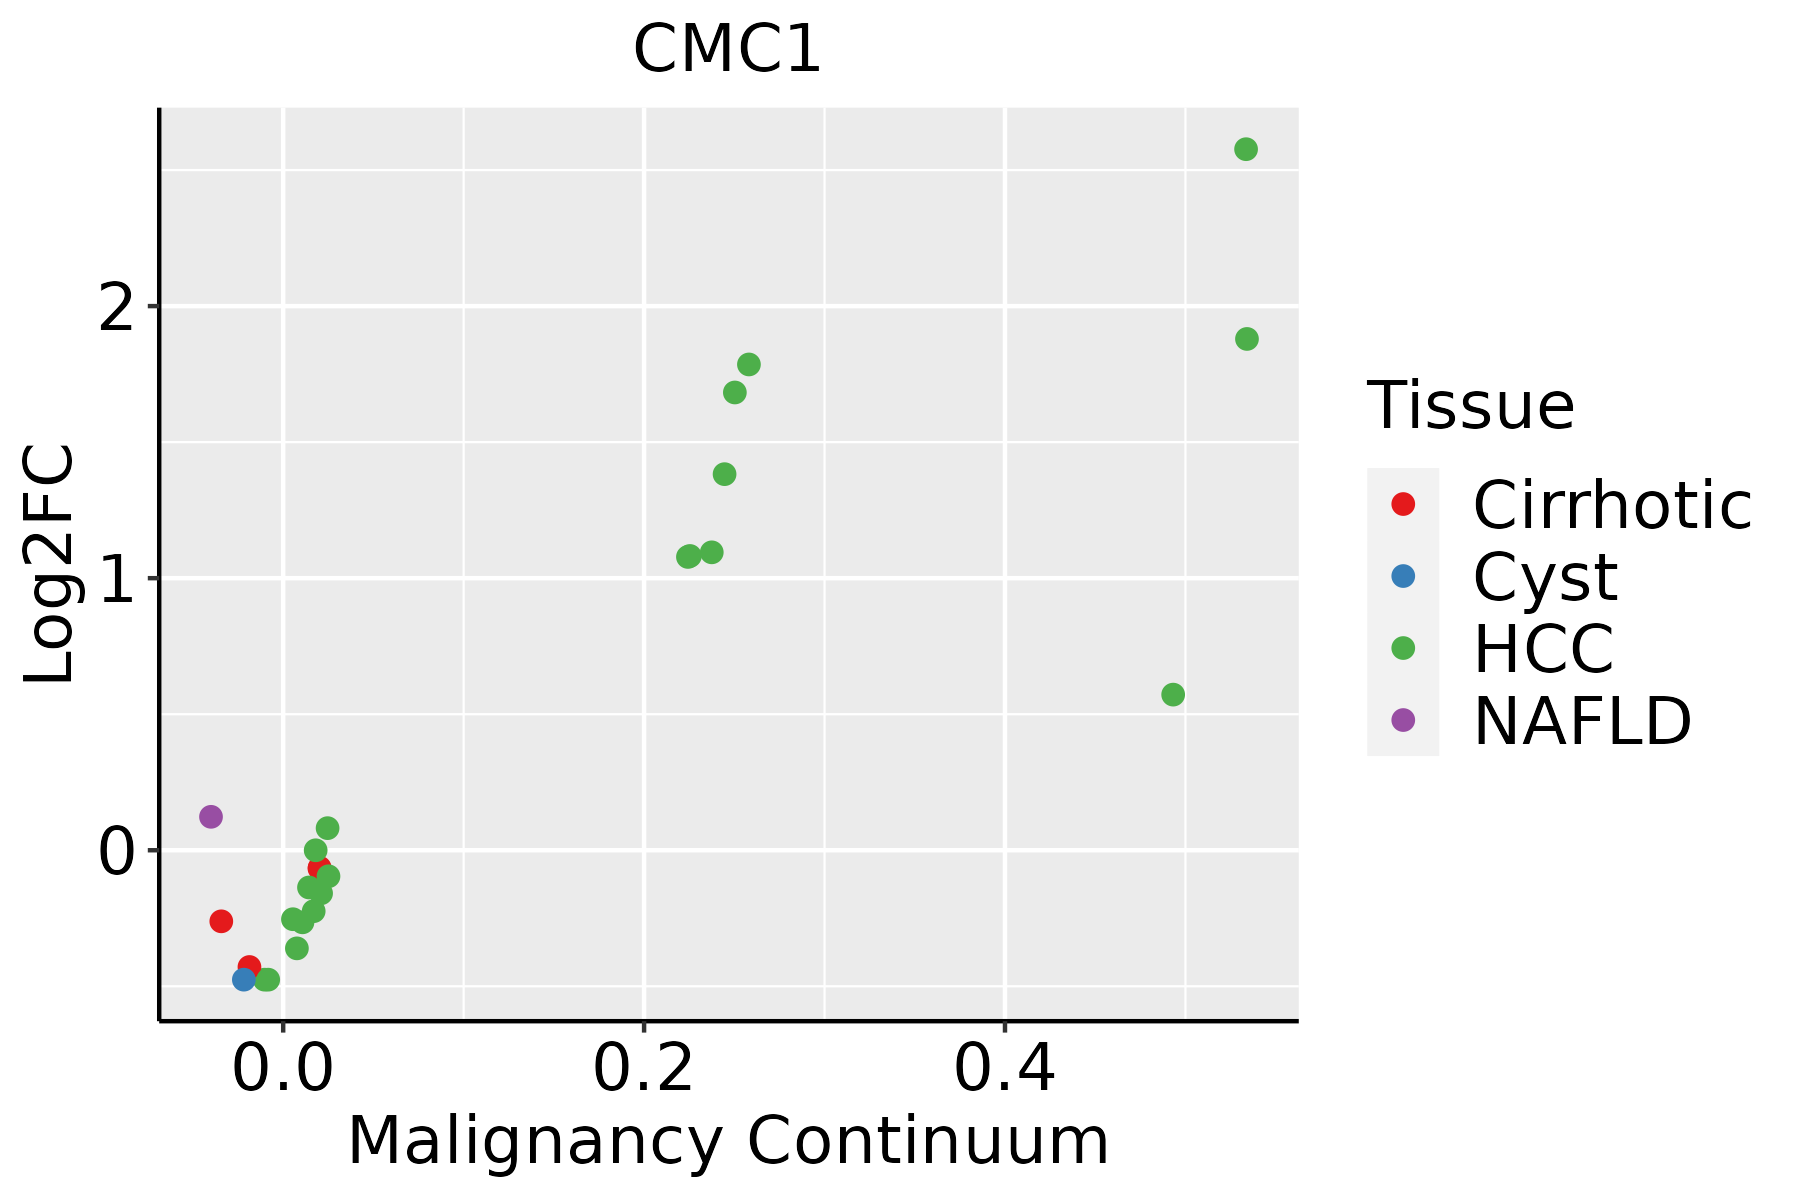 | HCC: Hepatocellular carcinoma |
| NAFLD: Non-alcoholic fatty liver disease | ||
| Oral Cavity | 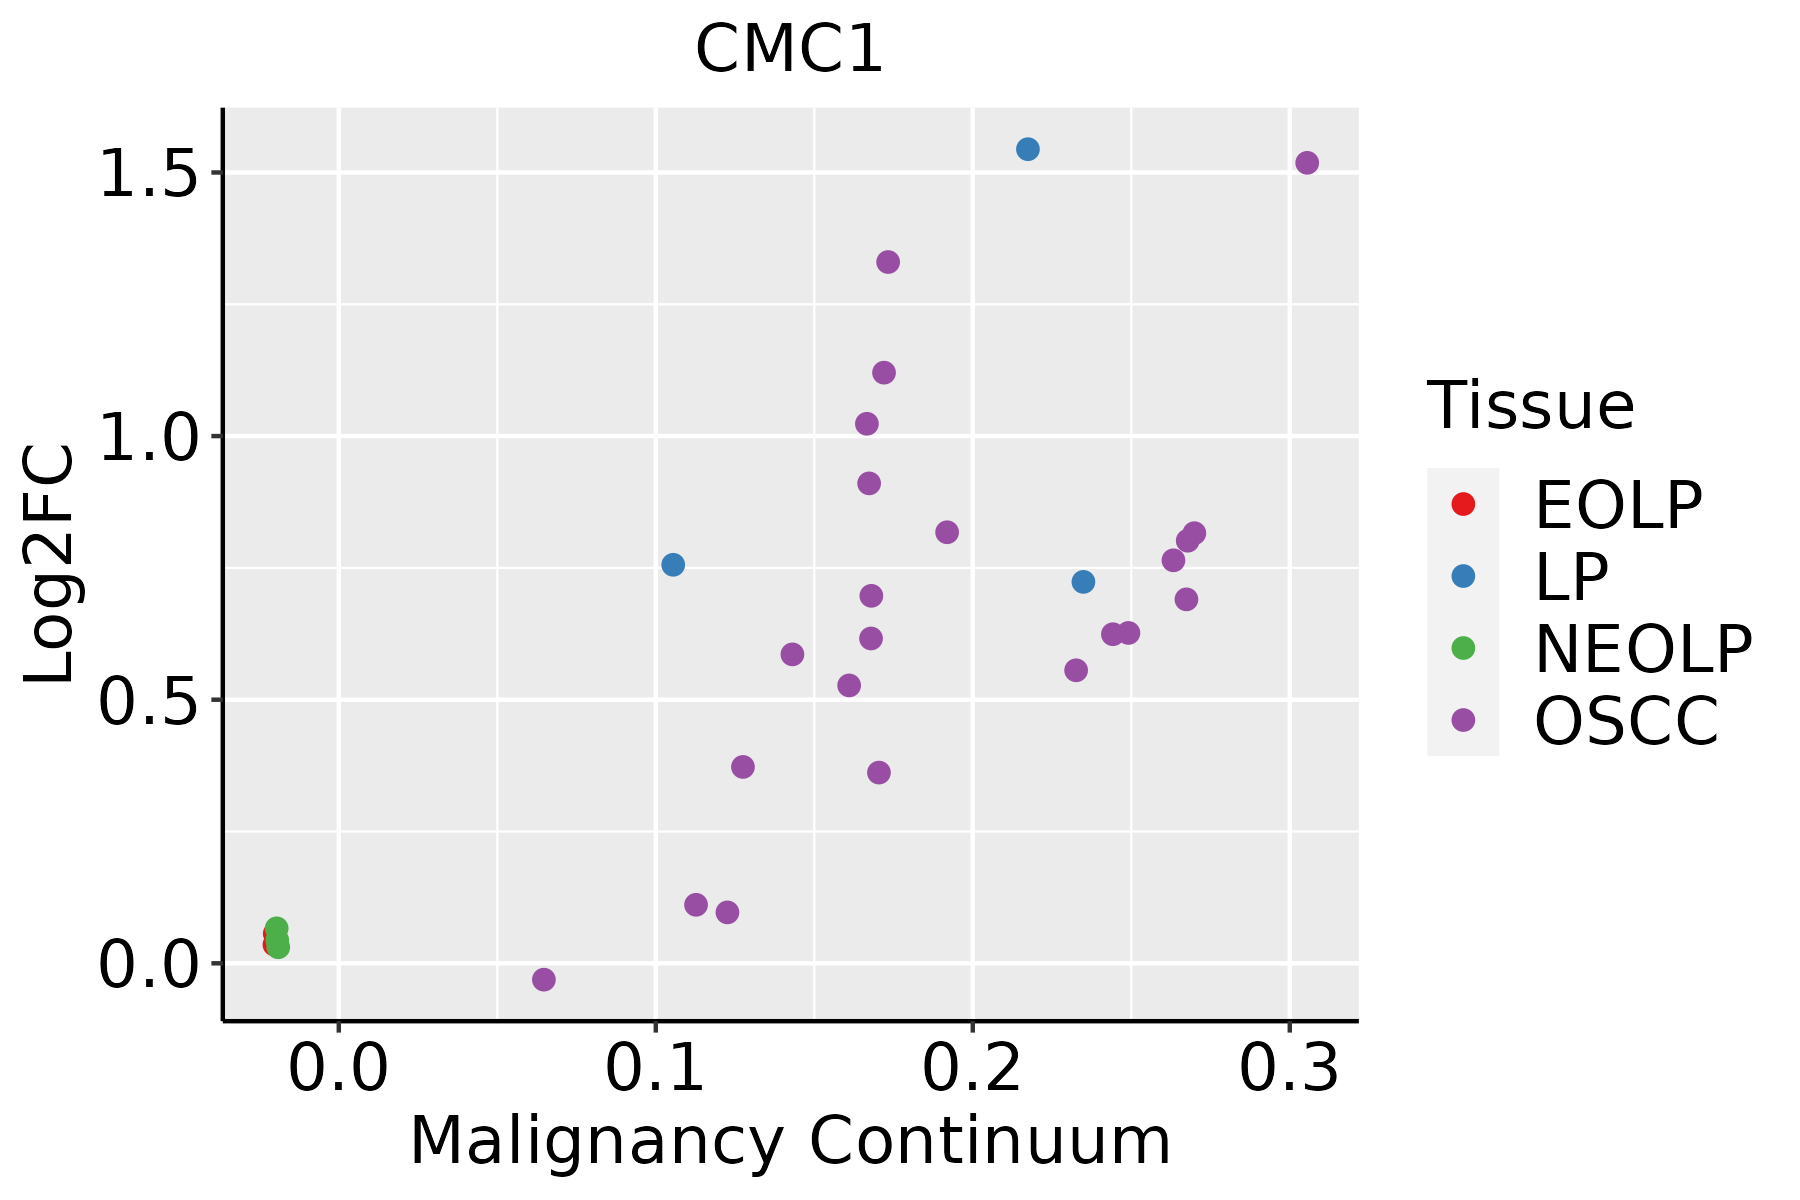 | EOLP: Erosive Oral lichen planus |
| LP: leukoplakia | ||
| NEOLP: Non-erosive oral lichen planus | ||
| OSCC: Oral squamous cell carcinoma | ||
| Prostate | 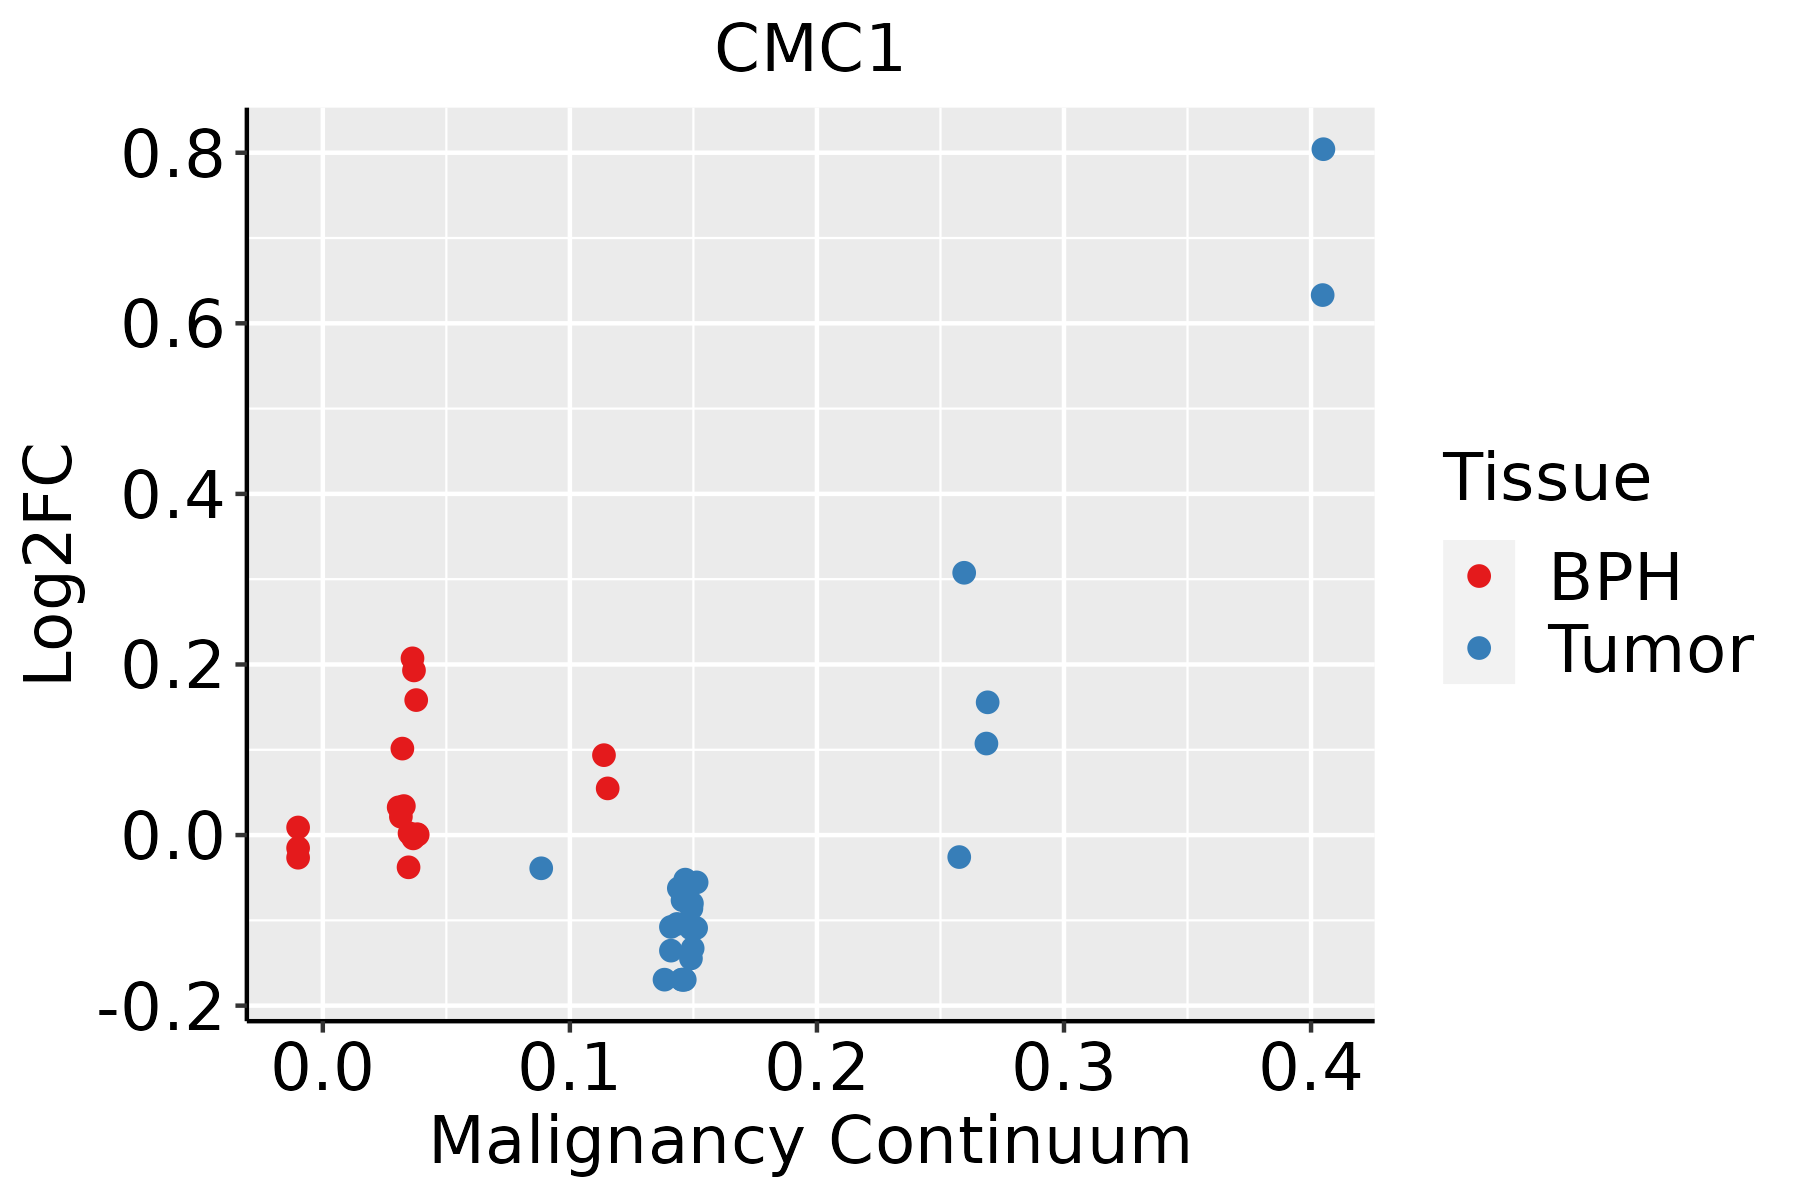 | BPH: Benign Prostatic Hyperplasia |
| Skin | 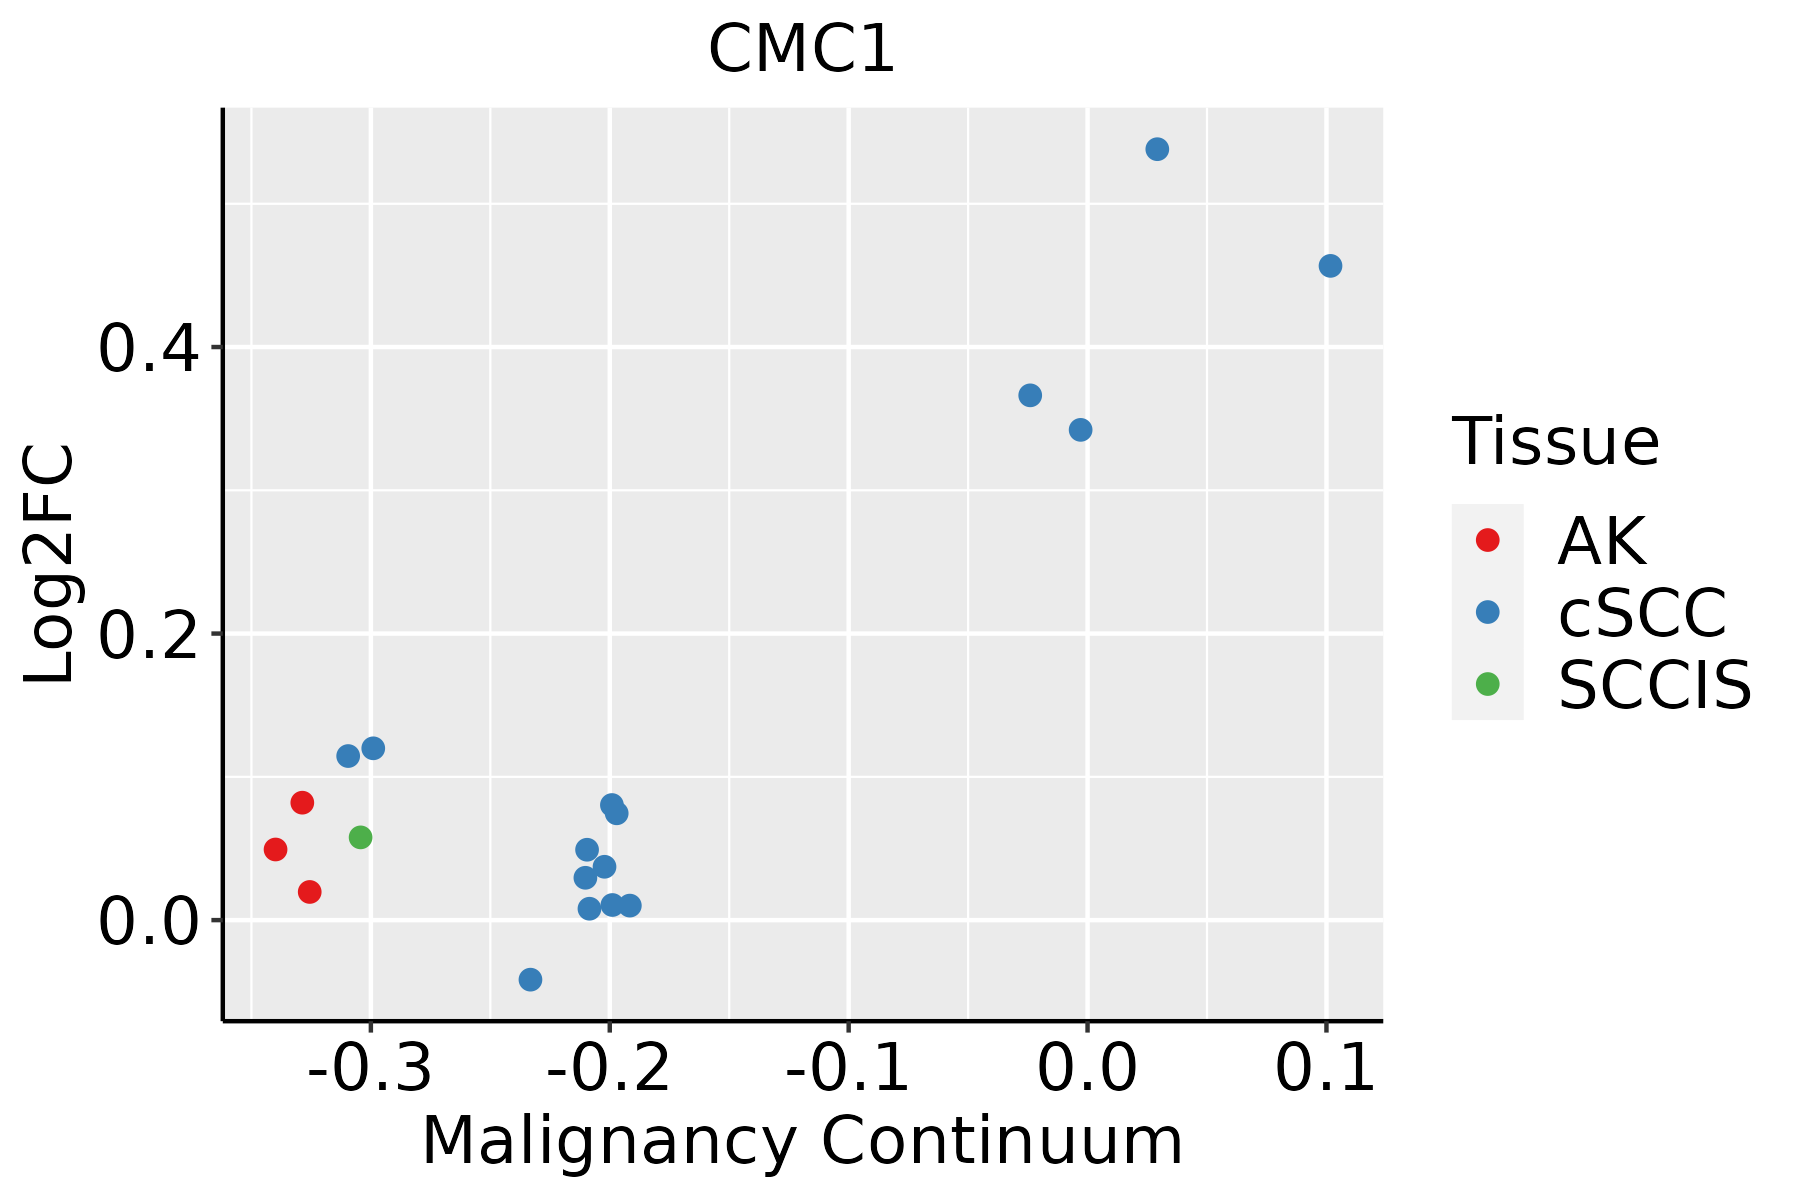 | AK: Actinic keratosis |
| cSCC: Cutaneous squamous cell carcinoma | ||
| SCCIS:squamous cell carcinoma in situ | ||
| Thyroid | 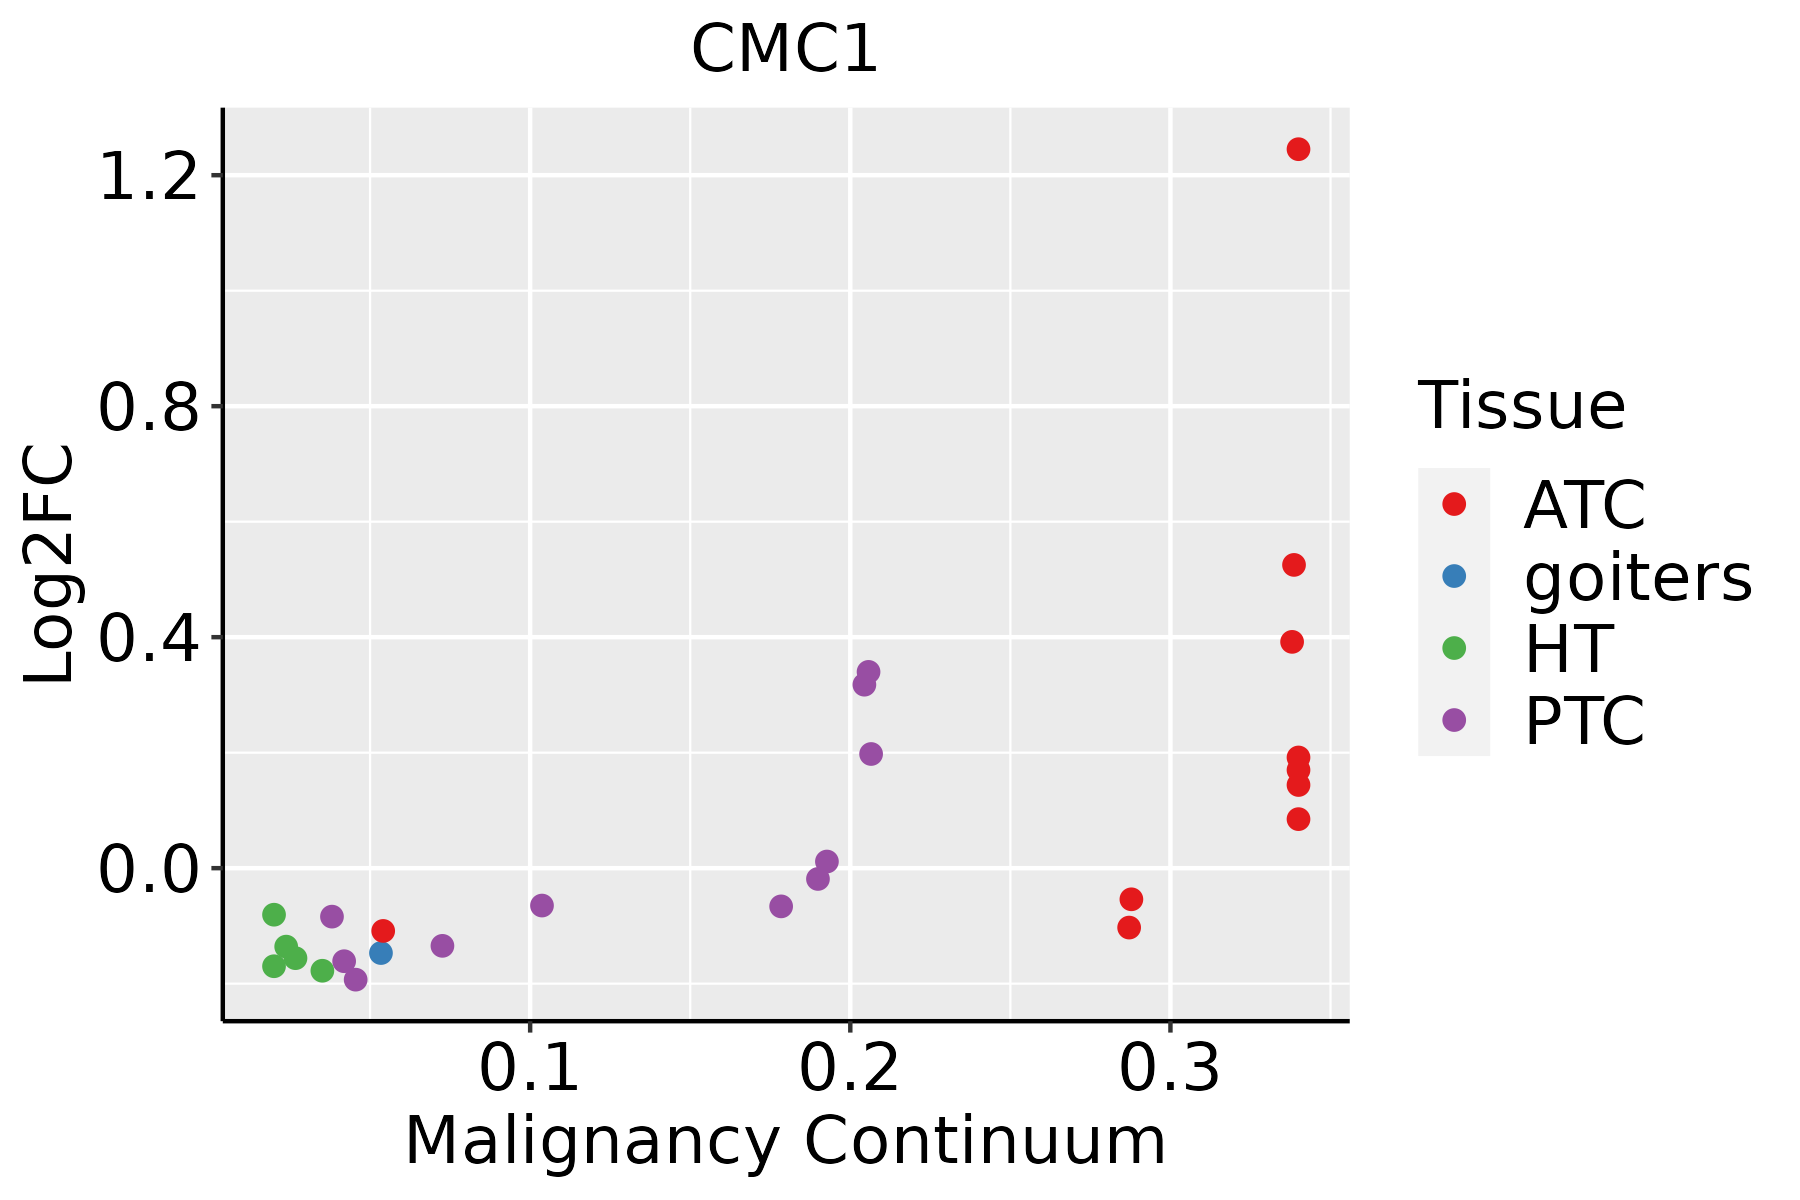 | ATC: Anaplastic thyroid cancer |
| HT: Hashimoto's thyroiditis | ||
| PTC: Papillary thyroid cancer |
| ∗log2FC in expression of this searched gene in stem-like cells from each diseased tissue sample relative to stem-like cells in normal samples in each tissue plotted against the malignancy continuum. Samples are colored based on if they are from different disease stage. |
Top |
Malignant transformation related pathway analysis |
| Find out the enriched GO biological processes and KEGG pathways involved in transition from healthy to precancer to cancer |
| Tissue | Disease Stage | Enriched GO biological Processes |
| Colorectum | AD |  |
| Colorectum | SER |  |
| Colorectum | MSS |  |
| Colorectum | MSI-H |  |
| Colorectum | FAP |  |
| ∗Top 15 enriched GO BP terms are showed in the bar plot of each disease state in each tissue. Each row represents a significant GO biological process which is colored according to the -log10(p.adjust). |
| Page: 1 2 3 4 5 6 7 8 9 |
| GO ID | Tissue | Disease Stage | Description | Gene Ratio | Bg Ratio | pvalue | p.adjust | Count |
| Page: 1 |
| Pathway ID | Tissue | Disease Stage | Description | Gene Ratio | Bg Ratio | pvalue | p.adjust | qvalue | Count |
| Page: 1 |
Top |
Cell-cell communication analysis |
| Identification of potential cell-cell interactions between two cell types and their ligand-receptor pairs for different disease states |
| Ligand | Receptor | LRpair | Pathway | Tissue | Disease Stage |
| Page: 1 |
Top |
Single-cell gene regulatory network inference analysis |
| Find out the significant the regulons (TFs) and the target genes of each regulon across cell types for different disease states |
| TF | Cell Type | Tissue | Disease Stage | Target Gene | RSS | Regulon Activity |
| ∗The dot plots of a searched regulon are shown for all cell subpopulations in each disease state of each tissue based on the regulon specific score inferred using pySCENIC and by calculating the average expression. |
| Page: 1 |
Top |
Somatic mutation of malignant transformation related genes |
| Annotation of somatic variants for genes involved in malignant transformation |
| Hugo Symbol | Variant Class | Variant Classification | dbSNP RS | HGVSc | HGVSp | HGVSp Short | SWISSPROT | BIOTYPE | SIFT | PolyPhen | Tumor Sample Barcode | Tissue | Histology | Sex | Age | Stage | Therapy Types | Drugs | Outcome |
| CMC1 | SNV | Missense_Mutation | rs147199271 | c.40N>A | p.Glu14Lys | p.E14K | Q7Z7K0 | protein_coding | deleterious(0.03) | benign(0.007) | TCGA-AZ-4315-01 | Colorectum | colon adenocarcinoma | Male | <65 | I/II | Unknown | Unknown | SD |
| CMC1 | insertion | Frame_Shift_Ins | novel | c.288_289insA | p.Arg98LysfsTer21 | p.R98Kfs*21 | Q7Z7K0 | protein_coding | TCGA-CM-5861-01 | Colorectum | colon adenocarcinoma | Female | <65 | I/II | Unknown | Unknown | PD | ||
| CMC1 | insertion | Frame_Shift_Ins | novel | c.110_111insT | p.Thr39TyrfsTer31 | p.T39Yfs*31 | Q7Z7K0 | protein_coding | TCGA-NH-A5IV-01 | Colorectum | colon adenocarcinoma | Female | >=65 | I/II | Unknown | Unknown | SD | ||
| CMC1 | SNV | Missense_Mutation | novel | c.64N>G | p.Ile22Val | p.I22V | Q7Z7K0 | protein_coding | tolerated(0.36) | benign(0.039) | TCGA-A5-A1OF-01 | Endometrium | uterine corpus endometrioid carcinoma | Female | <65 | I/II | Unknown | Unknown | SD |
| CMC1 | SNV | Missense_Mutation | rs147199271 | c.40N>A | p.Glu14Lys | p.E14K | Q7Z7K0 | protein_coding | deleterious(0.03) | benign(0.007) | TCGA-AJ-A3EL-01 | Endometrium | uterine corpus endometrioid carcinoma | Female | <65 | I/II | Unknown | Unknown | SD |
| CMC1 | SNV | Missense_Mutation | rs147199271 | c.40G>A | p.Glu14Lys | p.E14K | Q7Z7K0 | protein_coding | deleterious(0.03) | benign(0.007) | TCGA-AP-A056-01 | Endometrium | uterine corpus endometrioid carcinoma | Female | <65 | I/II | Unknown | Unknown | SD |
| CMC1 | SNV | Missense_Mutation | c.176N>A | p.Ala59Glu | p.A59E | Q7Z7K0 | protein_coding | tolerated(0.09) | probably_damaging(0.946) | TCGA-AP-A0LM-01 | Endometrium | uterine corpus endometrioid carcinoma | Female | <65 | III/IV | Chemotherapy | cisplatin | SD | |
| CMC1 | SNV | Missense_Mutation | novel | c.288N>T | p.Lys96Asn | p.K96N | Q7Z7K0 | protein_coding | tolerated(0.05) | possibly_damaging(0.459) | TCGA-EO-A3B0-01 | Endometrium | uterine corpus endometrioid carcinoma | Female | <65 | III/IV | Unknown | Unknown | SD |
| CMC1 | SNV | Missense_Mutation | novel | c.148G>A | p.Val50Ile | p.V50I | Q7Z7K0 | protein_coding | tolerated(0.16) | possibly_damaging(0.573) | TCGA-EO-A3KX-01 | Endometrium | uterine corpus endometrioid carcinoma | Female | >=65 | I/II | Unknown | Unknown | SD |
| CMC1 | SNV | Missense_Mutation | novel | c.284C>A | p.Thr95Lys | p.T95K | Q7Z7K0 | protein_coding | tolerated(1) | benign(0) | TCGA-CN-6010-01 | Oral cavity | head & neck squamous cell carcinoma | Male | <65 | I/II | Chemotherapy | cisplatin | PD |
| Page: 1 2 |
Top |
Related drugs of malignant transformation related genes |
| Identification of chemicals and drugs interact with genes involved in malignant transfromation |
| (DGIdb 4.0) |
| Entrez ID | Symbol | Category | Interaction Types | Drug Claim Name | Drug Name | PMIDs |
| Page: 1 |

Copyright 2023-Present -The University of Texas Health Science Center at Houston |