
|
|||||
|
 | |
| |
| |
| |
| |
| |
|
Gene: CMBL |
Gene summary for CMBL |
| Gene information | Species | Human | Gene symbol | CMBL | Gene ID | 134147 |
| Gene name | carboxymethylenebutenolidase homolog | |
| Gene Alias | JS-1 | |
| Cytomap | 5p15.2 | |
| Gene Type | protein-coding | GO ID | GO:0006805 | UniProtAcc | Q96DG6 |
Top |
Malignant transformation analysis |
| Identification of the aberrant gene expression in precancerous and cancerous lesions by comparing the gene expression of stem-like cells in diseased tissues with normal stem cells |
| Entrez ID | Symbol | Replicates | Species | Organ | Tissue | Adj P-value | Log2FC | Malignancy |
| 134147 | CMBL | GSM4909291 | Human | Breast | IDC | 4.14e-13 | 5.81e-01 | 0.1753 |
| 134147 | CMBL | GSM4909298 | Human | Breast | IDC | 5.06e-04 | 1.46e-01 | 0.1551 |
| 134147 | CMBL | GSM4909308 | Human | Breast | IDC | 4.98e-20 | 5.07e-01 | 0.158 |
| 134147 | CMBL | M5 | Human | Breast | IDC | 1.98e-03 | 5.86e-01 | 0.1598 |
| 134147 | CMBL | NCCBC14 | Human | Breast | DCIS | 2.11e-09 | 5.49e-01 | 0.2021 |
| 134147 | CMBL | DCIS2 | Human | Breast | DCIS | 1.08e-11 | -3.34e-03 | 0.0085 |
| 134147 | CMBL | HTA11_2487_2000001011 | Human | Colorectum | SER | 1.02e-04 | 4.70e-01 | -0.1808 |
| 134147 | CMBL | HTA11_1938_2000001011 | Human | Colorectum | AD | 2.55e-05 | 4.98e-01 | -0.0811 |
| 134147 | CMBL | HTA11_78_2000001011 | Human | Colorectum | AD | 1.09e-12 | 9.16e-01 | -0.1088 |
| 134147 | CMBL | HTA11_347_2000001011 | Human | Colorectum | AD | 1.35e-68 | 1.54e+00 | -0.1954 |
| 134147 | CMBL | HTA11_83_2000001011 | Human | Colorectum | SER | 4.84e-23 | 1.16e+00 | -0.1526 |
| 134147 | CMBL | HTA11_696_2000001011 | Human | Colorectum | AD | 1.51e-17 | 6.18e-01 | -0.1464 |
| 134147 | CMBL | HTA11_866_2000001011 | Human | Colorectum | AD | 2.17e-15 | 6.06e-01 | -0.1001 |
| 134147 | CMBL | HTA11_1391_2000001011 | Human | Colorectum | AD | 1.64e-10 | 6.34e-01 | -0.059 |
| 134147 | CMBL | HTA11_546_2000001011 | Human | Colorectum | AD | 3.92e-05 | 6.81e-01 | -0.0842 |
| 134147 | CMBL | A015-C-203 | Human | Colorectum | FAP | 4.48e-06 | -1.92e-01 | -0.1294 |
| 134147 | CMBL | A002-C-201 | Human | Colorectum | FAP | 5.74e-05 | -2.28e-01 | 0.0324 |
| 134147 | CMBL | A002-C-203 | Human | Colorectum | FAP | 1.16e-04 | -2.15e-01 | 0.2786 |
| 134147 | CMBL | A001-C-108 | Human | Colorectum | FAP | 1.60e-06 | -2.41e-01 | -0.0272 |
| 134147 | CMBL | A002-C-205 | Human | Colorectum | FAP | 6.70e-06 | -2.52e-01 | -0.1236 |
| Page: 1 2 3 4 5 6 7 |
| Tissue | Expression Dynamics | Abbreviation |
| Breast |  | IDC: Invasive ductal carcinoma |
| DCIS: Ductal carcinoma in situ | ||
| Precancer(BRCA1-mut): Precancerous lesion from BRCA1 mutation carriers | ||
| Colorectum (GSE201348) |  | FAP: Familial adenomatous polyposis |
| CRC: Colorectal cancer | ||
| Colorectum (HTA11) | 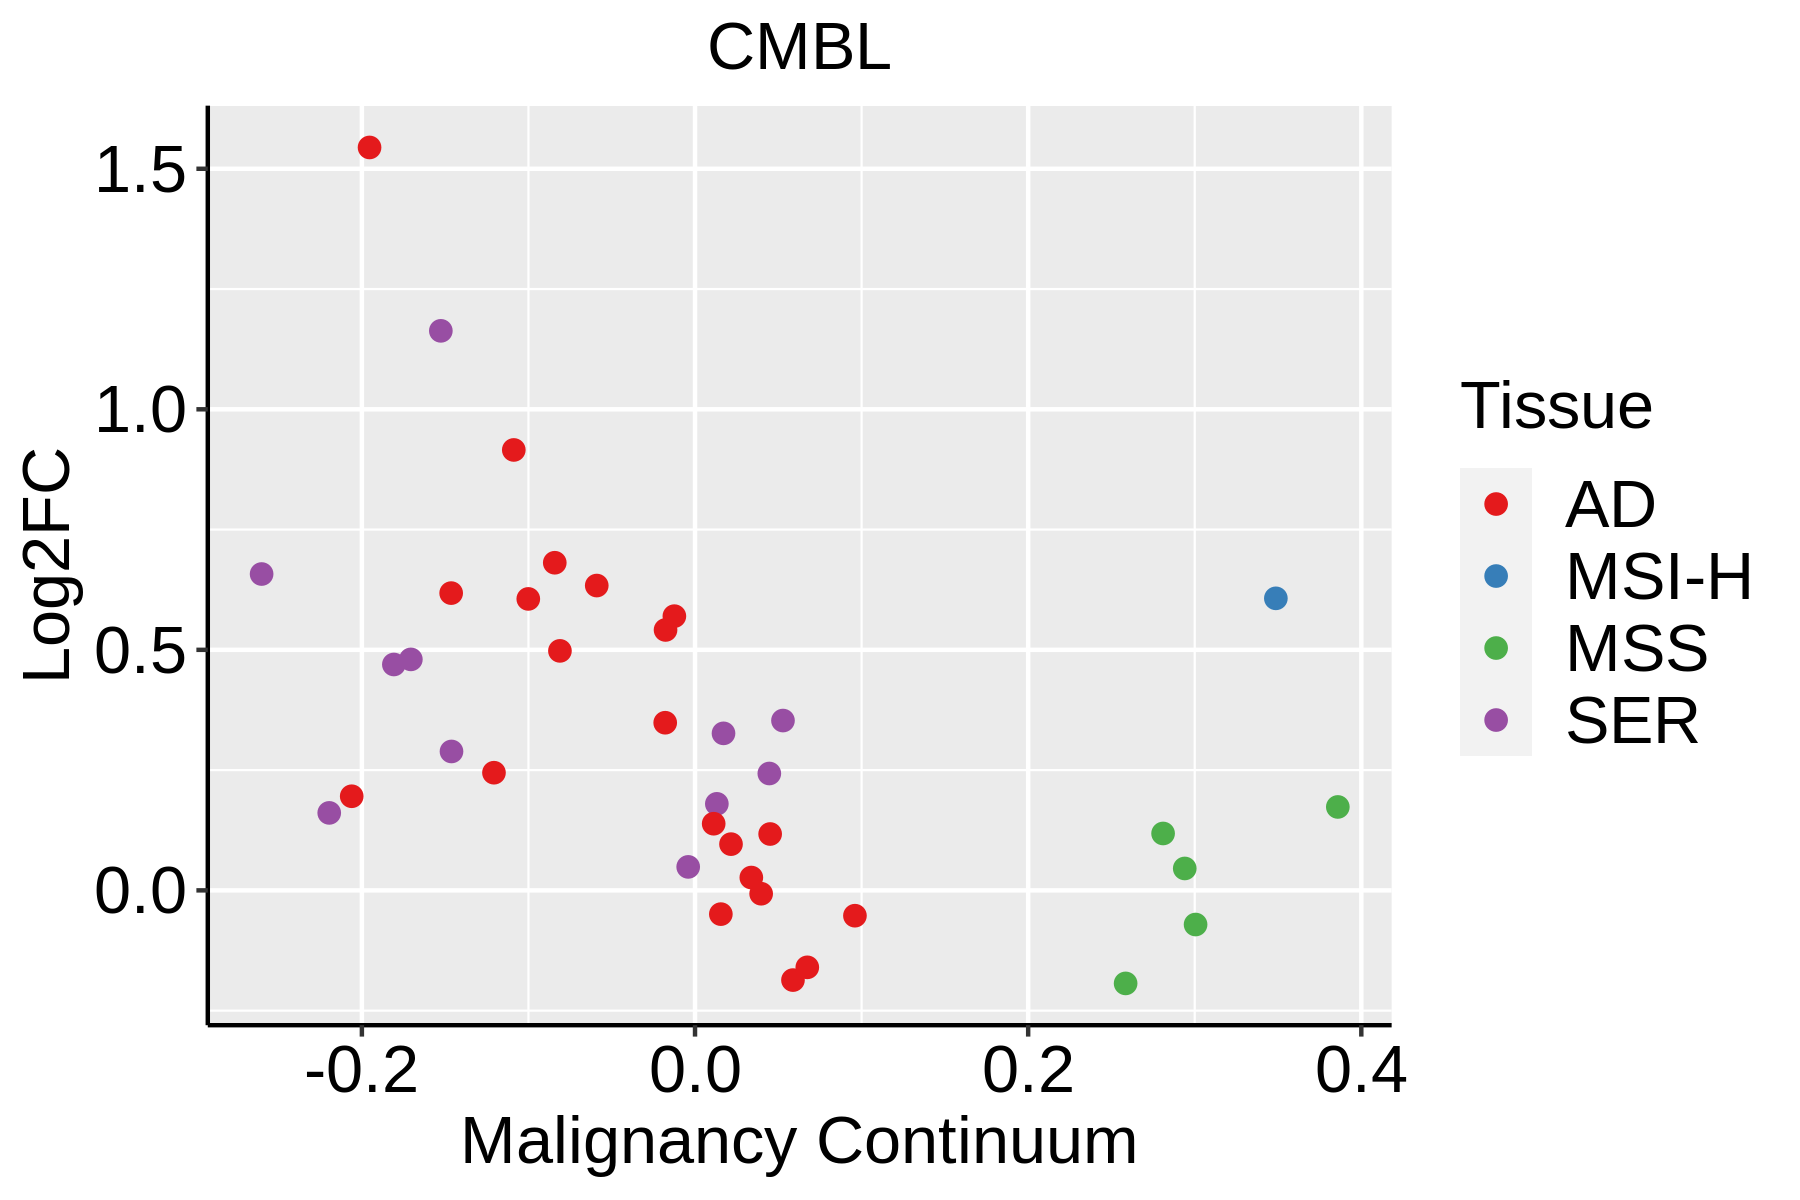 | AD: Adenomas |
| SER: Sessile serrated lesions | ||
| MSI-H: Microsatellite-high colorectal cancer | ||
| MSS: Microsatellite stable colorectal cancer | ||
| Esophagus |  | ESCC: Esophageal squamous cell carcinoma |
| HGIN: High-grade intraepithelial neoplasias | ||
| LGIN: Low-grade intraepithelial neoplasias | ||
| Liver | 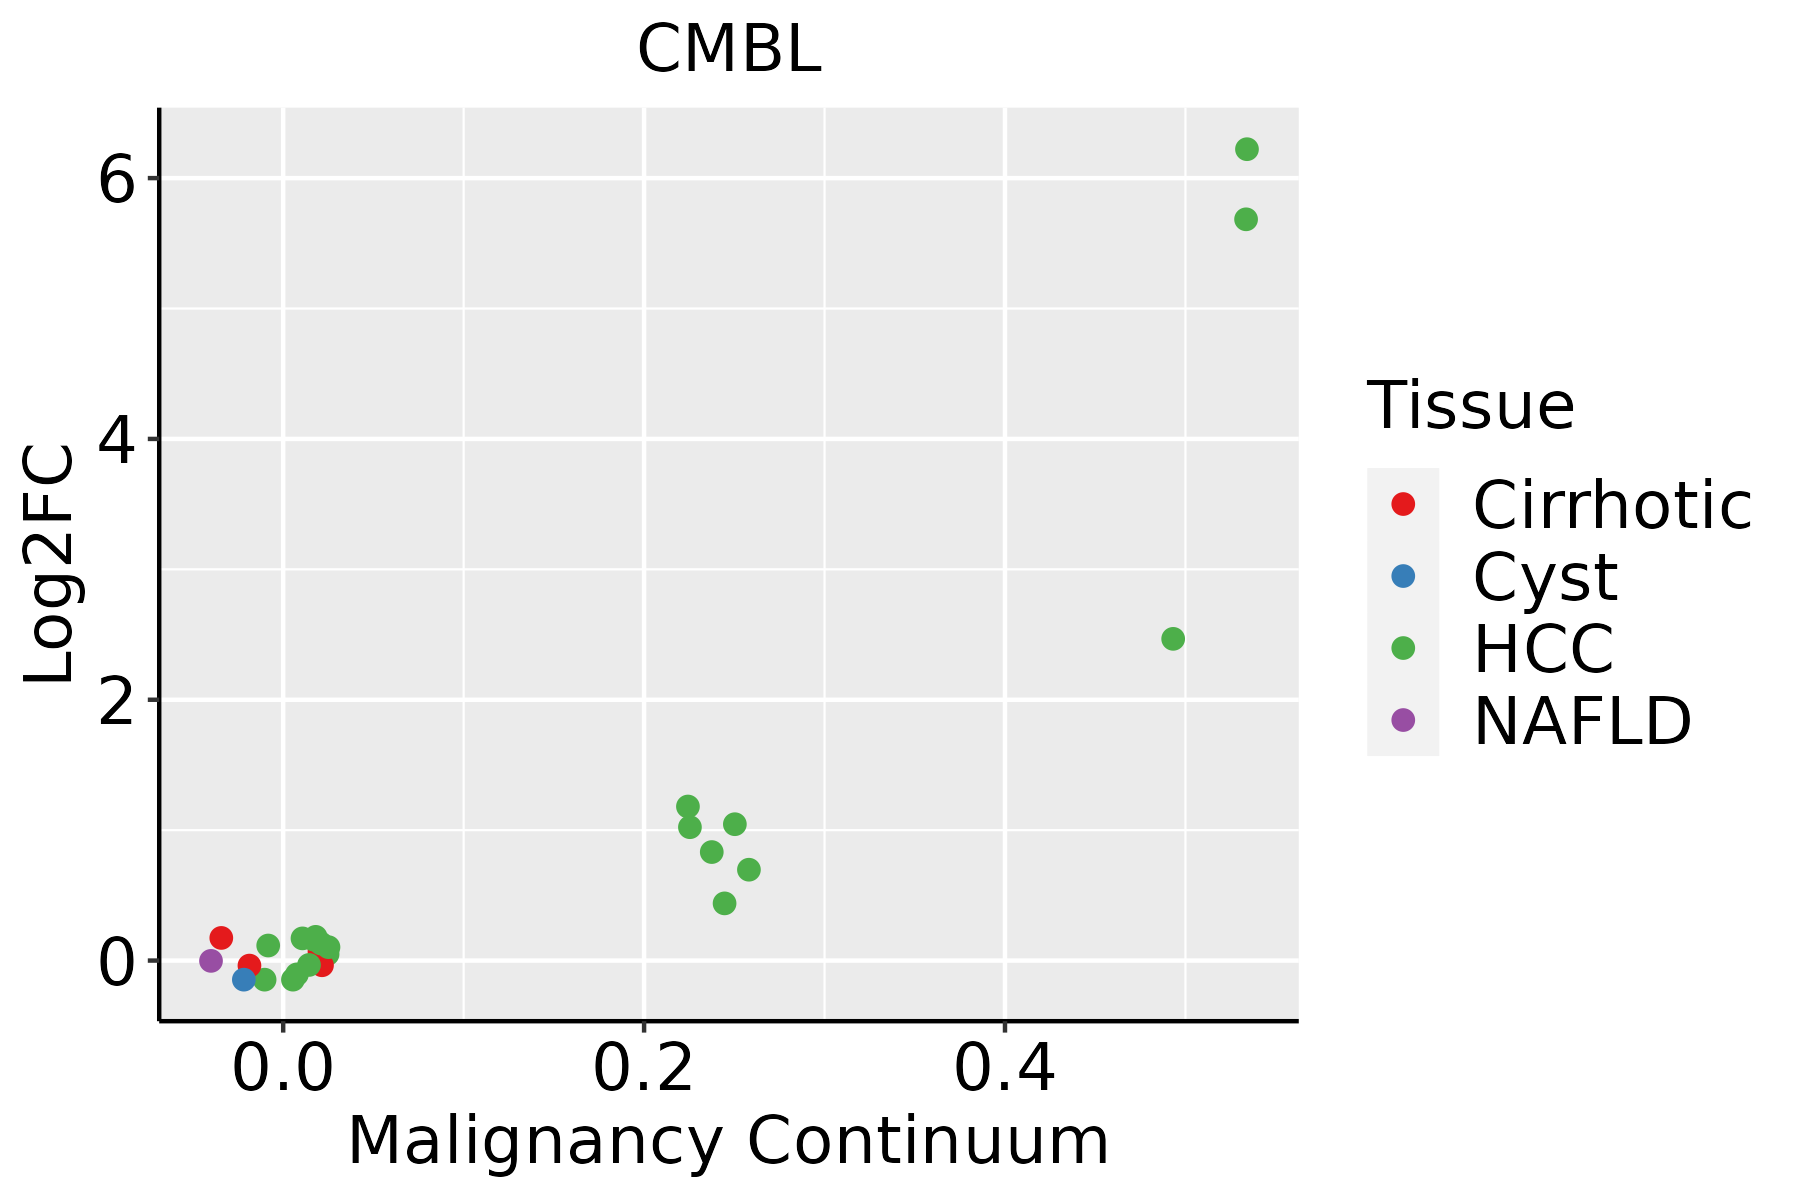 | HCC: Hepatocellular carcinoma |
| NAFLD: Non-alcoholic fatty liver disease | ||
| Oral Cavity |  | EOLP: Erosive Oral lichen planus |
| LP: leukoplakia | ||
| NEOLP: Non-erosive oral lichen planus | ||
| OSCC: Oral squamous cell carcinoma |
| ∗log2FC in expression of this searched gene in stem-like cells from each diseased tissue sample relative to stem-like cells in normal samples in each tissue plotted against the malignancy continuum. Samples are colored based on if they are from different disease stage. |
Top |
Malignant transformation related pathway analysis |
| Find out the enriched GO biological processes and KEGG pathways involved in transition from healthy to precancer to cancer |
| Tissue | Disease Stage | Enriched GO biological Processes |
| Colorectum | AD |  |
| Colorectum | SER |  |
| Colorectum | MSS |  |
| Colorectum | MSI-H |  |
| Colorectum | FAP |  |
| ∗Top 15 enriched GO BP terms are showed in the bar plot of each disease state in each tissue. Each row represents a significant GO biological process which is colored according to the -log10(p.adjust). |
| Page: 1 2 3 4 5 6 7 8 9 |
| GO ID | Tissue | Disease Stage | Description | Gene Ratio | Bg Ratio | pvalue | p.adjust | Count |
| GO:000941013 | Breast | IDC | response to xenobiotic stimulus | 62/1434 | 462/18723 | 1.05e-05 | 2.88e-04 | 62 |
| GO:000941023 | Breast | DCIS | response to xenobiotic stimulus | 59/1390 | 462/18723 | 3.00e-05 | 6.61e-04 | 59 |
| GO:0009410 | Colorectum | AD | response to xenobiotic stimulus | 128/3918 | 462/18723 | 2.69e-04 | 3.31e-03 | 128 |
| GO:00094102 | Colorectum | FAP | response to xenobiotic stimulus | 87/2622 | 462/18723 | 2.15e-03 | 1.77e-02 | 87 |
| GO:00094103 | Colorectum | CRC | response to xenobiotic stimulus | 69/2078 | 462/18723 | 6.34e-03 | 4.61e-02 | 69 |
| GO:000941020 | Esophagus | ESCC | response to xenobiotic stimulus | 253/8552 | 462/18723 | 4.55e-05 | 3.58e-04 | 253 |
| GO:000941012 | Liver | Cirrhotic | response to xenobiotic stimulus | 165/4634 | 462/18723 | 6.82e-08 | 2.09e-06 | 165 |
| GO:00714661 | Liver | Cirrhotic | cellular response to xenobiotic stimulus | 66/4634 | 177/18723 | 1.34e-04 | 1.31e-03 | 66 |
| GO:000680511 | Liver | Cirrhotic | xenobiotic metabolic process | 43/4634 | 111/18723 | 7.51e-04 | 5.54e-03 | 43 |
| GO:000941022 | Liver | HCC | response to xenobiotic stimulus | 248/7958 | 462/18723 | 6.47e-07 | 1.02e-05 | 248 |
| GO:00714662 | Liver | HCC | cellular response to xenobiotic stimulus | 93/7958 | 177/18723 | 4.35e-03 | 1.89e-02 | 93 |
| GO:000941018 | Oral cavity | OSCC | response to xenobiotic stimulus | 222/7305 | 462/18723 | 4.00e-05 | 3.48e-04 | 222 |
| GO:000941019 | Oral cavity | LP | response to xenobiotic stimulus | 141/4623 | 462/18723 | 2.33e-03 | 1.68e-02 | 141 |
| Page: 1 |
| Pathway ID | Tissue | Disease Stage | Description | Gene Ratio | Bg Ratio | pvalue | p.adjust | qvalue | Count |
| Page: 1 |
Top |
Cell-cell communication analysis |
| Identification of potential cell-cell interactions between two cell types and their ligand-receptor pairs for different disease states |
| Ligand | Receptor | LRpair | Pathway | Tissue | Disease Stage |
| Page: 1 |
Top |
Single-cell gene regulatory network inference analysis |
| Find out the significant the regulons (TFs) and the target genes of each regulon across cell types for different disease states |
| TF | Cell Type | Tissue | Disease Stage | Target Gene | RSS | Regulon Activity |
| ∗The dot plots of a searched regulon are shown for all cell subpopulations in each disease state of each tissue based on the regulon specific score inferred using pySCENIC and by calculating the average expression. |
| Page: 1 |
Top |
Somatic mutation of malignant transformation related genes |
| Annotation of somatic variants for genes involved in malignant transformation |
| Hugo Symbol | Variant Class | Variant Classification | dbSNP RS | HGVSc | HGVSp | HGVSp Short | SWISSPROT | BIOTYPE | SIFT | PolyPhen | Tumor Sample Barcode | Tissue | Histology | Sex | Age | Stage | Therapy Types | Drugs | Outcome |
| CMBL | SNV | Missense_Mutation | rs199662372 | c.277A>G | p.Ile93Val | p.I93V | Q96DG6 | protein_coding | tolerated(0.1) | benign(0.022) | TCGA-AR-A5QP-01 | Breast | breast invasive carcinoma | Female | <65 | I/II | Hormone Therapy | tamoxiphen | SD |
| CMBL | insertion | In_Frame_Ins | novel | c.3_4insTTTCTGTTGTTTCACGGAGGG | p.Met1_Ala2insPheLeuLeuPheHisGlyGly | p.M1_A2insFLLFHGG | Q96DG6 | protein_coding | TCGA-A7-A0D9-01 | Breast | breast invasive carcinoma | Female | <65 | I/II | Chemotherapy | taxotere | SD | ||
| CMBL | insertion | In_Frame_Ins | novel | c.486_487insAAAGCAGAA | p.Glu162_Asp163insLysAlaGlu | p.E162_D163insKAE | Q96DG6 | protein_coding | TCGA-AO-A0J9-01 | Breast | breast invasive carcinoma | Female | <65 | III/IV | Chemotherapy | cyclophosphamide | PD | ||
| CMBL | deletion | In_Frame_Del | c.104_127delNNNNNNNNNNNNNNNNNNNNNNNN | p.Thr35_Gly42del | p.T35_G42del | Q96DG6 | protein_coding | TCGA-E2-A1AZ-01 | Breast | breast invasive carcinoma | Female | <65 | I/II | Chemotherapy | adriamycin | SD | |||
| CMBL | SNV | Missense_Mutation | novel | c.654N>T | p.Lys218Asn | p.K218N | Q96DG6 | protein_coding | deleterious(0.01) | possibly_damaging(0.824) | TCGA-VS-A958-01 | Cervix | cervical & endocervical cancer | Female | <65 | I/II | Chemotherapy | cisplatin | CR |
| CMBL | SNV | Missense_Mutation | rs780957157 | c.460G>A | p.Val154Ile | p.V154I | Q96DG6 | protein_coding | tolerated(0.2) | benign(0.018) | TCGA-CM-4746-01 | Colorectum | colon adenocarcinoma | Male | <65 | I/II | Unknown | Unknown | SD |
| CMBL | SNV | Missense_Mutation | c.616N>C | p.Thr206Pro | p.T206P | Q96DG6 | protein_coding | deleterious(0) | possibly_damaging(0.686) | TCGA-EI-6513-01 | Colorectum | rectum adenocarcinoma | Male | <65 | III/IV | Unknown | Unknown | SD | |
| CMBL | SNV | Missense_Mutation | novel | c.10N>A | p.Glu4Lys | p.E4K | Q96DG6 | protein_coding | tolerated(0.09) | possibly_damaging(0.883) | TCGA-AJ-A3EL-01 | Endometrium | uterine corpus endometrioid carcinoma | Female | <65 | I/II | Unknown | Unknown | SD |
| CMBL | SNV | Missense_Mutation | rs147855838 | c.650N>T | p.Arg217Leu | p.R217L | Q96DG6 | protein_coding | tolerated(0.14) | benign(0.224) | TCGA-AP-A0L8-01 | Endometrium | uterine corpus endometrioid carcinoma | Female | >=65 | III/IV | Unknown | Unknown | PD |
| CMBL | SNV | Missense_Mutation | novel | c.735G>A | p.Met245Ile | p.M245I | Q96DG6 | protein_coding | tolerated(1) | benign(0) | TCGA-AX-A2HD-01 | Endometrium | uterine corpus endometrioid carcinoma | Female | >=65 | III/IV | Unknown | Unknown | SD |
| Page: 1 2 |
Top |
Related drugs of malignant transformation related genes |
| Identification of chemicals and drugs interact with genes involved in malignant transfromation |
| (DGIdb 4.0) |
| Entrez ID | Symbol | Category | Interaction Types | Drug Claim Name | Drug Name | PMIDs |
| Page: 1 |

Copyright 2023-Present -The University of Texas Health Science Center at Houston |