
|
|||||
|
 | |
| |
| |
| |
| |
| |
|
Gene: CMAS |
Gene summary for CMAS |
| Gene information | Species | Human | Gene symbol | CMAS | Gene ID | 55907 |
| Gene name | cytidine monophosphate N-acetylneuraminic acid synthetase | |
| Gene Alias | CSS | |
| Cytomap | 12p12.1 | |
| Gene Type | protein-coding | GO ID | GO:0006040 | UniProtAcc | Q8NFW8 |
Top |
Malignant transformation analysis |
| Identification of the aberrant gene expression in precancerous and cancerous lesions by comparing the gene expression of stem-like cells in diseased tissues with normal stem cells |
| Entrez ID | Symbol | Replicates | Species | Organ | Tissue | Adj P-value | Log2FC | Malignancy |
| 55907 | CMAS | HTA11_78_2000001011 | Human | Colorectum | AD | 2.40e-02 | 4.86e-01 | -0.1088 |
| 55907 | CMAS | HTA11_347_2000001011 | Human | Colorectum | AD | 1.08e-17 | 8.15e-01 | -0.1954 |
| 55907 | CMAS | HTA11_99999970781_79442 | Human | Colorectum | MSS | 2.12e-13 | 7.25e-01 | 0.294 |
| 55907 | CMAS | A015-C-203 | Human | Colorectum | FAP | 1.58e-04 | -1.60e-01 | -0.1294 |
| 55907 | CMAS | A015-C-204 | Human | Colorectum | FAP | 9.76e-04 | -2.17e-01 | -0.0228 |
| 55907 | CMAS | A002-C-201 | Human | Colorectum | FAP | 6.60e-06 | -1.42e-01 | 0.0324 |
| 55907 | CMAS | A001-C-119 | Human | Colorectum | FAP | 3.74e-05 | -3.01e-01 | -0.1557 |
| 55907 | CMAS | A001-C-108 | Human | Colorectum | FAP | 4.45e-02 | -1.54e-01 | -0.0272 |
| 55907 | CMAS | A002-C-205 | Human | Colorectum | FAP | 8.27e-12 | -2.93e-01 | -0.1236 |
| 55907 | CMAS | A015-C-005 | Human | Colorectum | FAP | 1.14e-04 | -2.26e-01 | -0.0336 |
| 55907 | CMAS | A015-C-006 | Human | Colorectum | FAP | 1.93e-04 | -1.63e-01 | -0.0994 |
| 55907 | CMAS | A015-C-106 | Human | Colorectum | FAP | 2.29e-02 | -1.54e-01 | -0.0511 |
| 55907 | CMAS | A002-C-114 | Human | Colorectum | FAP | 9.69e-07 | -1.34e-01 | -0.1561 |
| 55907 | CMAS | A015-C-104 | Human | Colorectum | FAP | 9.97e-07 | -2.30e-01 | -0.1899 |
| 55907 | CMAS | A001-C-014 | Human | Colorectum | FAP | 2.06e-02 | -1.80e-01 | 0.0135 |
| 55907 | CMAS | A002-C-016 | Human | Colorectum | FAP | 2.71e-05 | -1.66e-01 | 0.0521 |
| 55907 | CMAS | A015-C-002 | Human | Colorectum | FAP | 2.23e-04 | -2.14e-01 | -0.0763 |
| 55907 | CMAS | A001-C-203 | Human | Colorectum | FAP | 4.75e-02 | -1.45e-01 | -0.0481 |
| 55907 | CMAS | A002-C-116 | Human | Colorectum | FAP | 2.65e-06 | -1.68e-01 | -0.0452 |
| 55907 | CMAS | A014-C-008 | Human | Colorectum | FAP | 5.93e-05 | -2.34e-01 | -0.191 |
| Page: 1 2 3 4 5 6 7 8 |
| Tissue | Expression Dynamics | Abbreviation |
| Colorectum (GSE201348) | 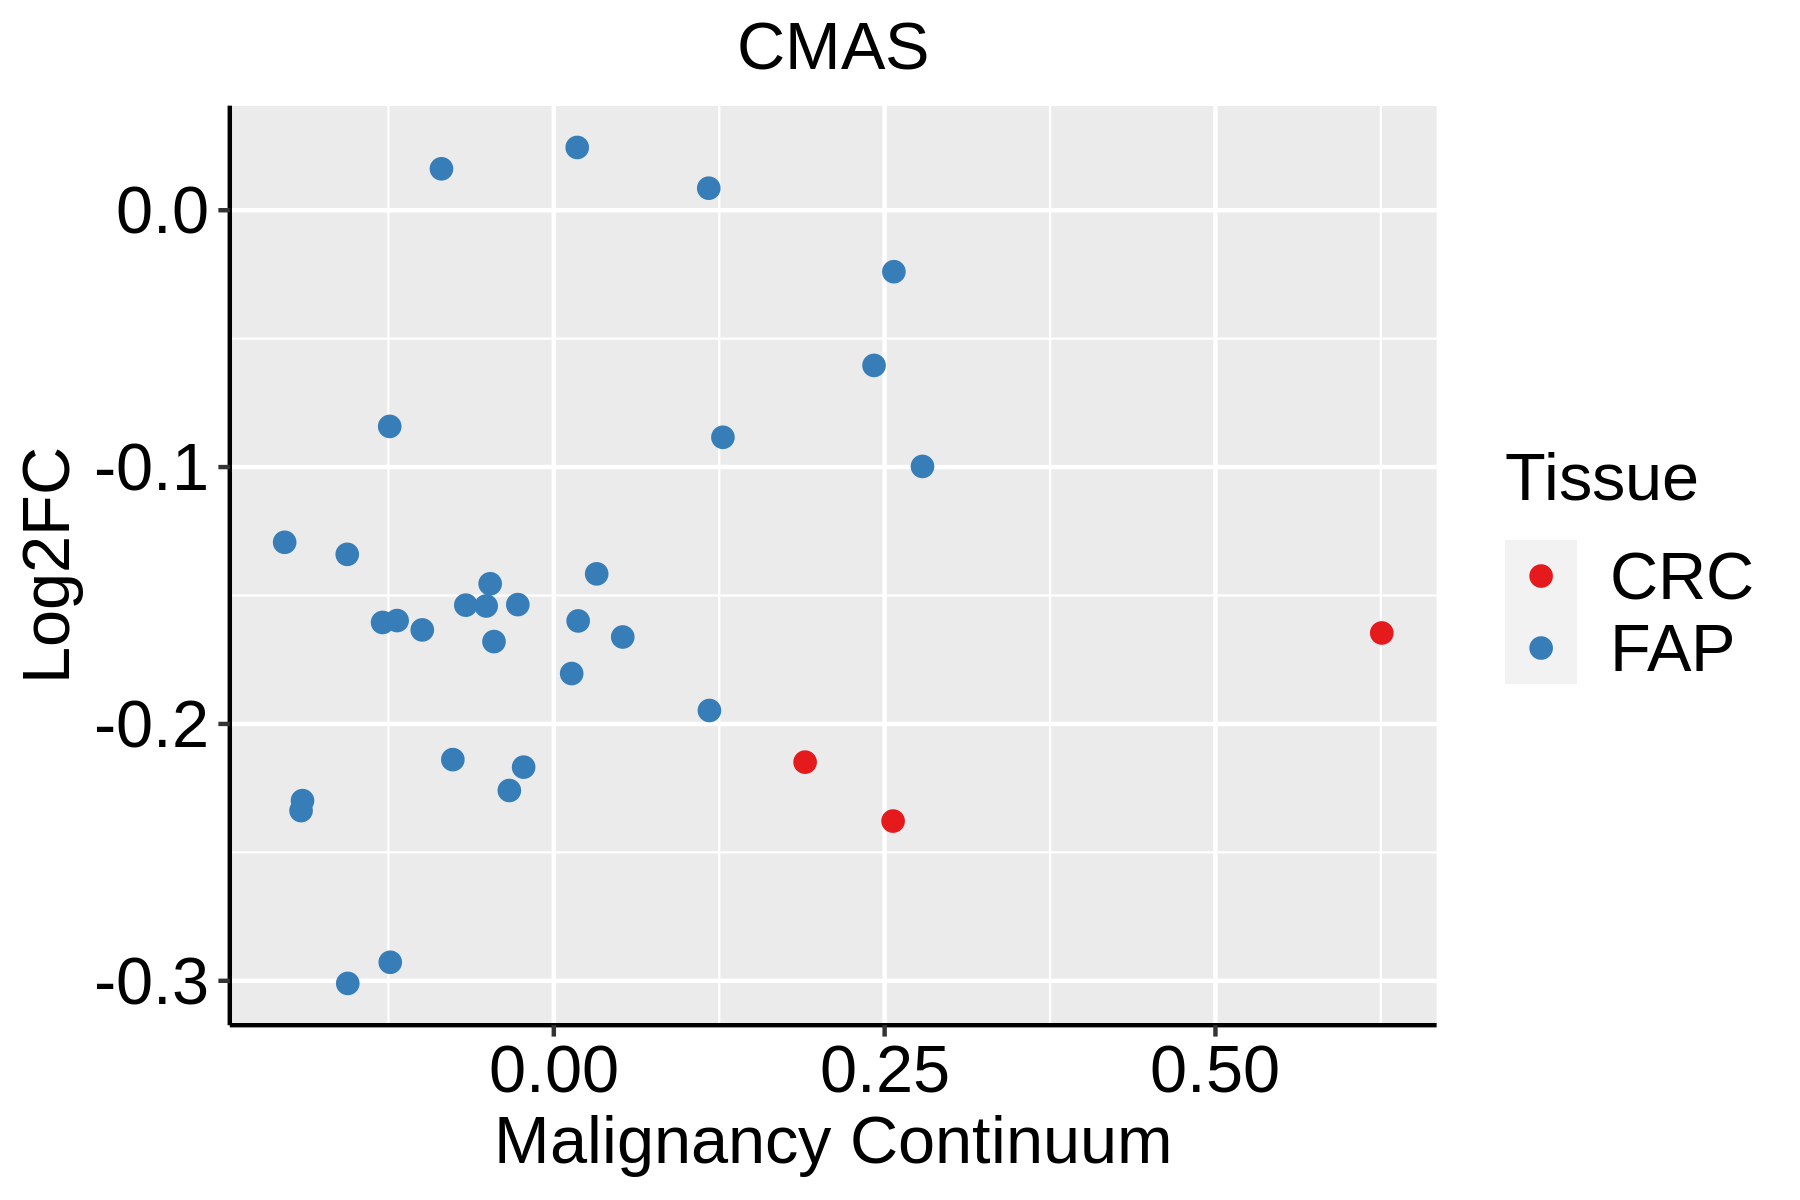 | FAP: Familial adenomatous polyposis |
| CRC: Colorectal cancer | ||
| Colorectum (HTA11) |  | AD: Adenomas |
| SER: Sessile serrated lesions | ||
| MSI-H: Microsatellite-high colorectal cancer | ||
| MSS: Microsatellite stable colorectal cancer | ||
| Esophagus |  | ESCC: Esophageal squamous cell carcinoma |
| HGIN: High-grade intraepithelial neoplasias | ||
| LGIN: Low-grade intraepithelial neoplasias | ||
| Liver | 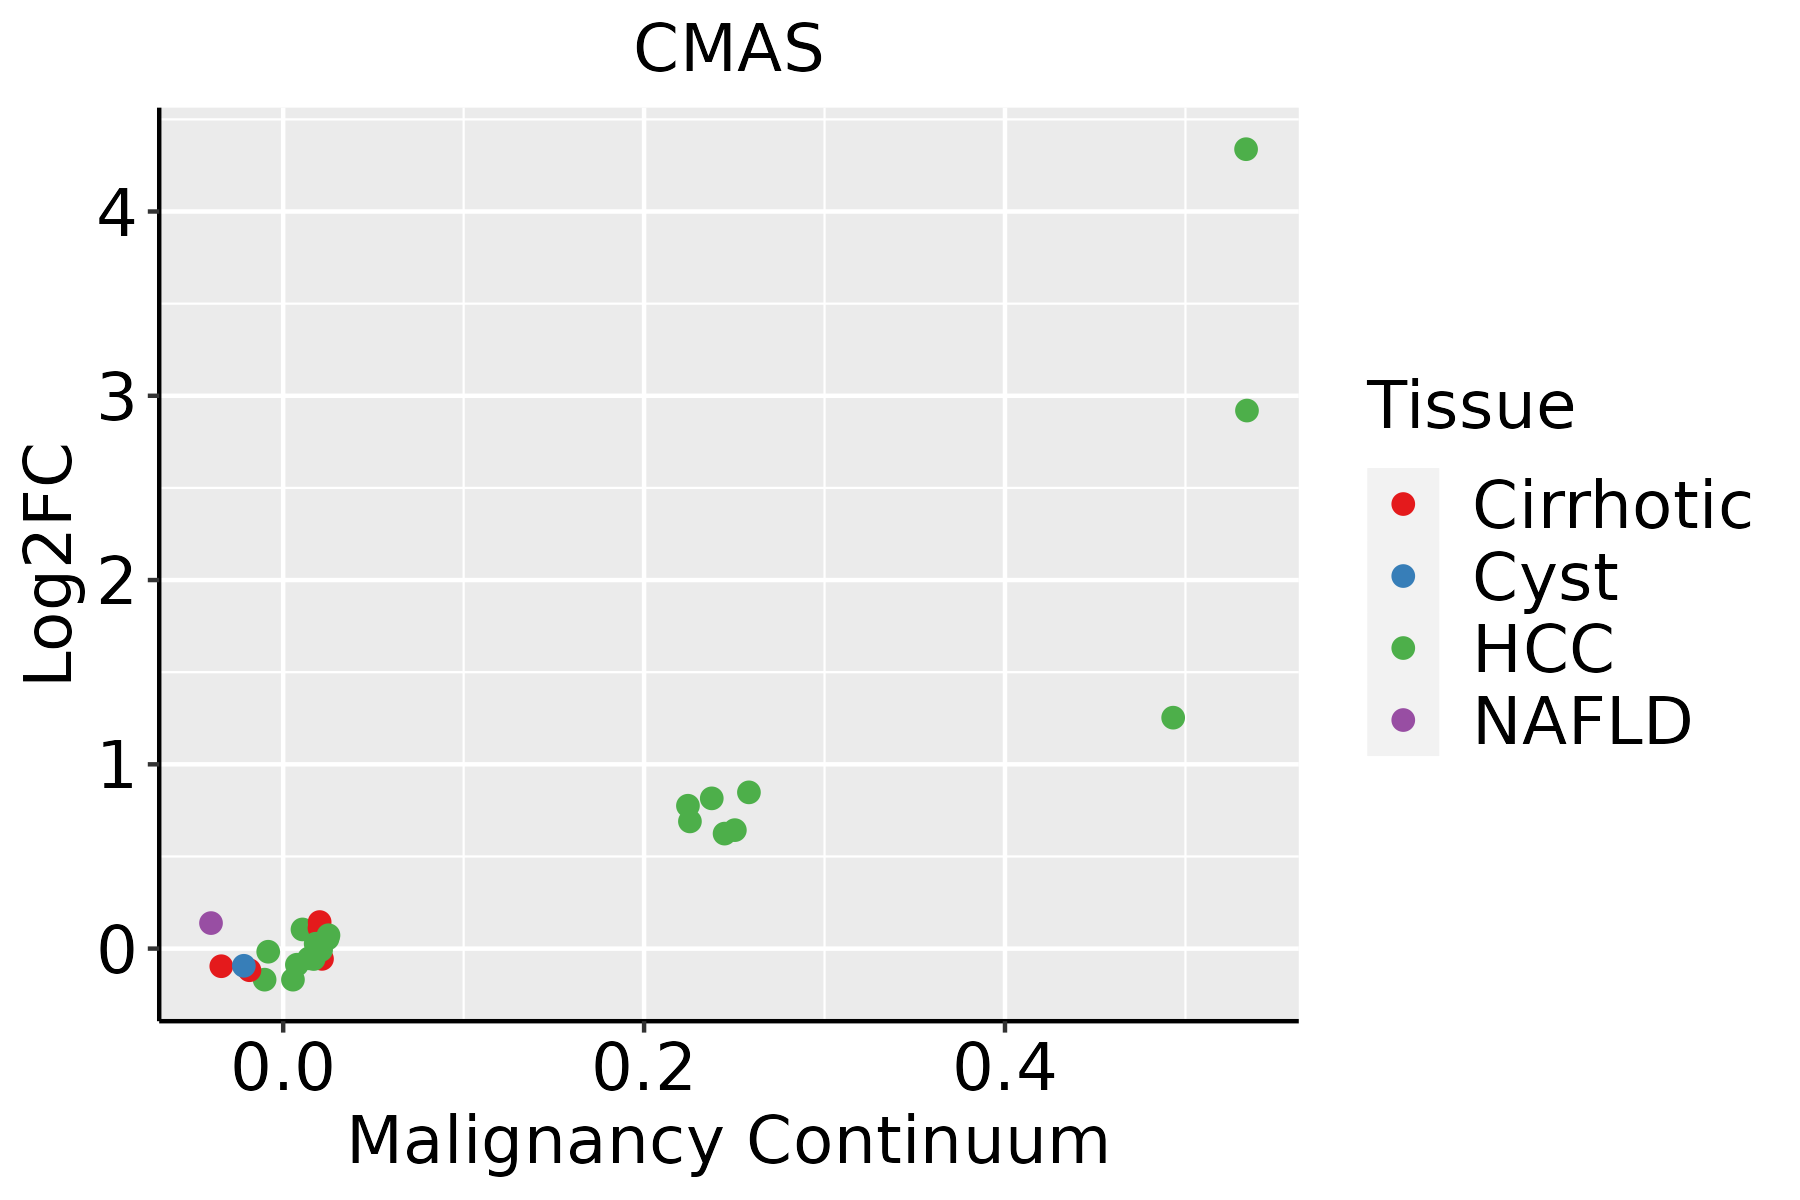 | HCC: Hepatocellular carcinoma |
| NAFLD: Non-alcoholic fatty liver disease | ||
| Oral Cavity |  | EOLP: Erosive Oral lichen planus |
| LP: leukoplakia | ||
| NEOLP: Non-erosive oral lichen planus | ||
| OSCC: Oral squamous cell carcinoma | ||
| Skin | 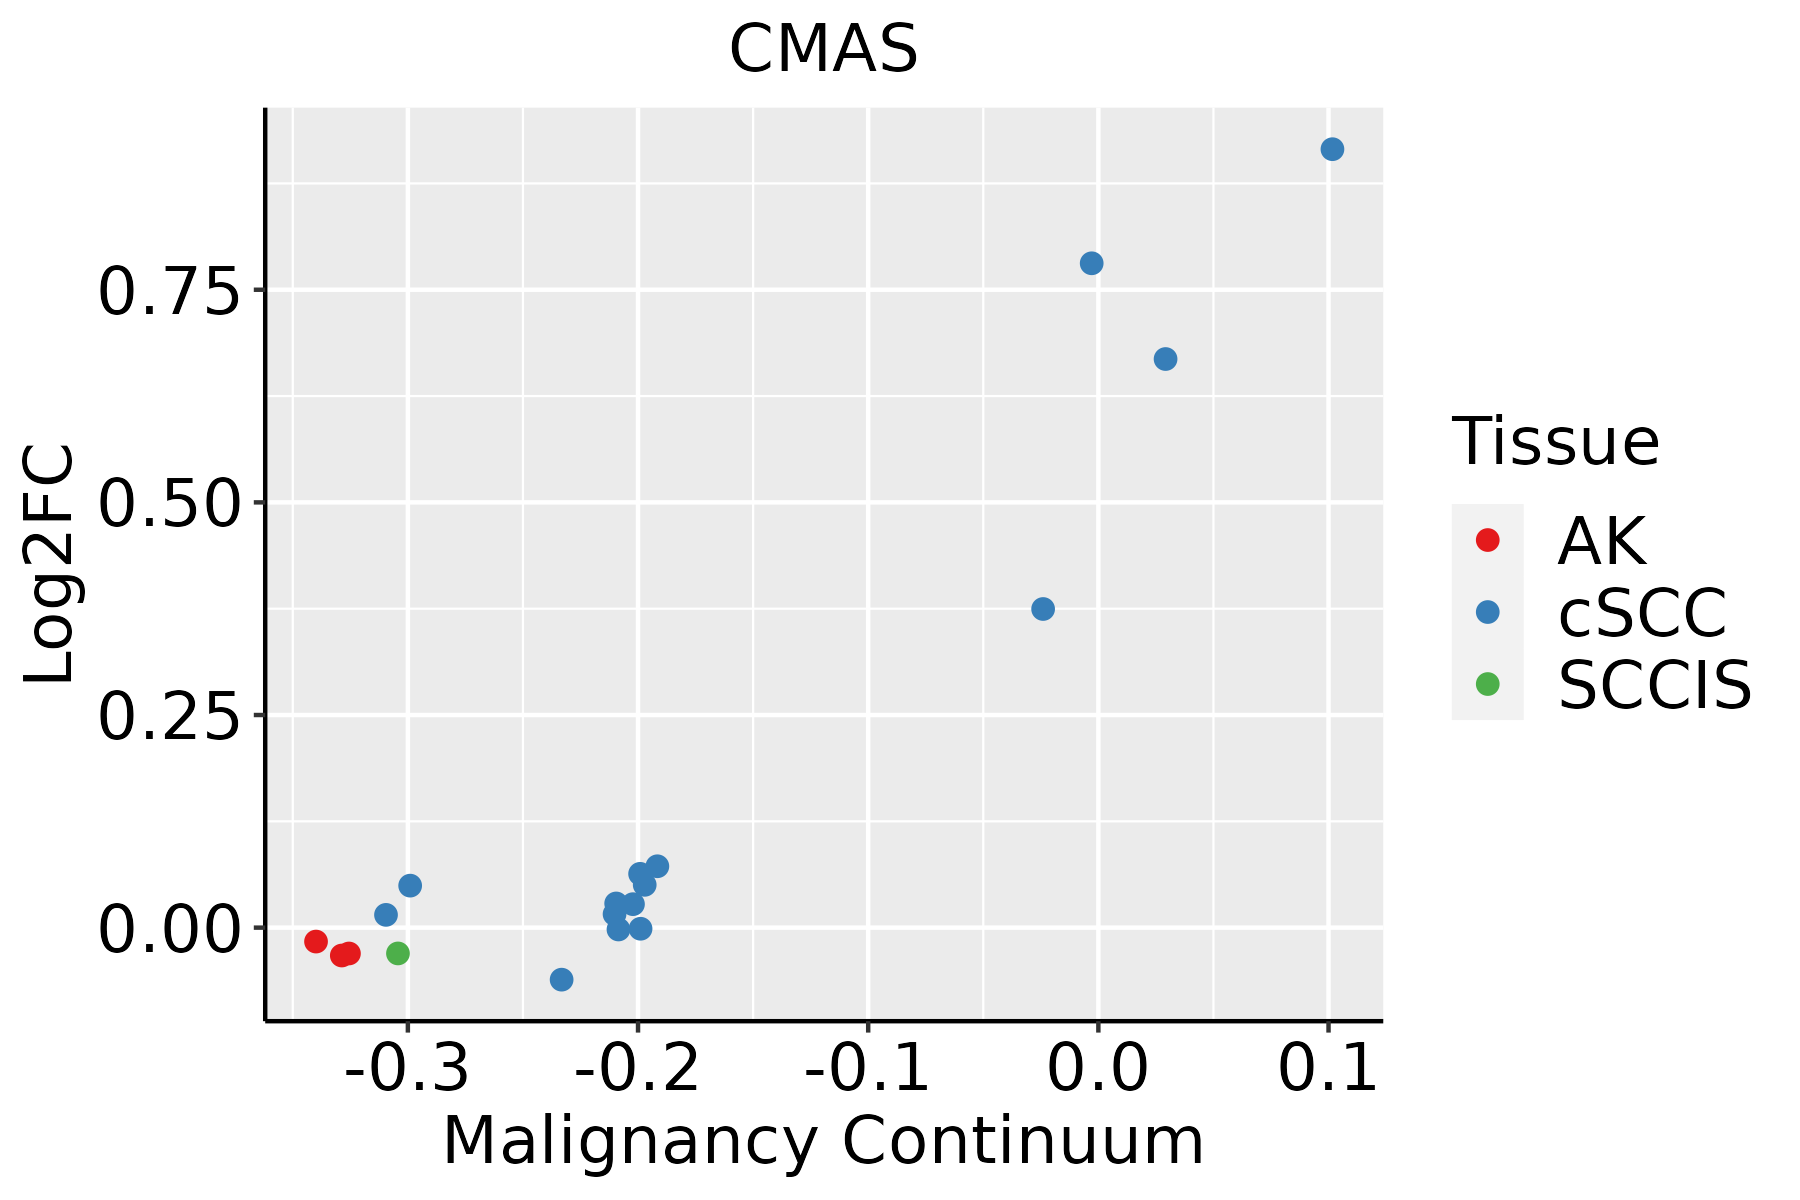 | AK: Actinic keratosis |
| cSCC: Cutaneous squamous cell carcinoma | ||
| SCCIS:squamous cell carcinoma in situ | ||
| Thyroid |  | ATC: Anaplastic thyroid cancer |
| HT: Hashimoto's thyroiditis | ||
| PTC: Papillary thyroid cancer |
| ∗log2FC in expression of this searched gene in stem-like cells from each diseased tissue sample relative to stem-like cells in normal samples in each tissue plotted against the malignancy continuum. Samples are colored based on if they are from different disease stage. |
Top |
Malignant transformation related pathway analysis |
| Find out the enriched GO biological processes and KEGG pathways involved in transition from healthy to precancer to cancer |
| Tissue | Disease Stage | Enriched GO biological Processes |
| Colorectum | AD |  |
| Colorectum | SER |  |
| Colorectum | MSS |  |
| Colorectum | MSI-H |  |
| Colorectum | FAP |  |
| ∗Top 15 enriched GO BP terms are showed in the bar plot of each disease state in each tissue. Each row represents a significant GO biological process which is colored according to the -log10(p.adjust). |
| Page: 1 2 3 4 5 6 7 8 9 |
| GO ID | Tissue | Disease Stage | Description | Gene Ratio | Bg Ratio | pvalue | p.adjust | Count |
| GO:0006040 | Oral cavity | OSCC | amino sugar metabolic process | 24/7305 | 42/18723 | 1.30e-02 | 4.34e-02 | 24 |
| Page: 1 |
| Pathway ID | Tissue | Disease Stage | Description | Gene Ratio | Bg Ratio | pvalue | p.adjust | qvalue | Count |
| hsa01250 | Colorectum | FAP | Biosynthesis of nucleotide sugars | 13/1404 | 37/8465 | 4.79e-03 | 1.91e-02 | 1.16e-02 | 13 |
| hsa012501 | Colorectum | FAP | Biosynthesis of nucleotide sugars | 13/1404 | 37/8465 | 4.79e-03 | 1.91e-02 | 1.16e-02 | 13 |
| hsa012502 | Colorectum | CRC | Biosynthesis of nucleotide sugars | 12/1091 | 37/8465 | 1.66e-03 | 1.20e-02 | 8.16e-03 | 12 |
| hsa012503 | Colorectum | CRC | Biosynthesis of nucleotide sugars | 12/1091 | 37/8465 | 1.66e-03 | 1.20e-02 | 8.16e-03 | 12 |
| hsa00520 | Oral cavity | OSCC | Amino sugar and nucleotide sugar metabolism | 34/3704 | 49/8465 | 2.48e-04 | 8.08e-04 | 4.11e-04 | 34 |
| hsa005201 | Oral cavity | OSCC | Amino sugar and nucleotide sugar metabolism | 34/3704 | 49/8465 | 2.48e-04 | 8.08e-04 | 4.11e-04 | 34 |
| Page: 1 |
Top |
Cell-cell communication analysis |
| Identification of potential cell-cell interactions between two cell types and their ligand-receptor pairs for different disease states |
| Ligand | Receptor | LRpair | Pathway | Tissue | Disease Stage |
| Page: 1 |
Top |
Single-cell gene regulatory network inference analysis |
| Find out the significant the regulons (TFs) and the target genes of each regulon across cell types for different disease states |
| TF | Cell Type | Tissue | Disease Stage | Target Gene | RSS | Regulon Activity |
| ∗The dot plots of a searched regulon are shown for all cell subpopulations in each disease state of each tissue based on the regulon specific score inferred using pySCENIC and by calculating the average expression. |
| Page: 1 |
Top |
Somatic mutation of malignant transformation related genes |
| Annotation of somatic variants for genes involved in malignant transformation |
| Hugo Symbol | Variant Class | Variant Classification | dbSNP RS | HGVSc | HGVSp | HGVSp Short | SWISSPROT | BIOTYPE | SIFT | PolyPhen | Tumor Sample Barcode | Tissue | Histology | Sex | Age | Stage | Therapy Types | Drugs | Outcome |
| CMAS | SNV | Missense_Mutation | novel | c.751N>C | p.Asp251His | p.D251H | Q8NFW8 | protein_coding | deleterious(0.01) | probably_damaging(0.987) | TCGA-5L-AAT0-01 | Breast | breast invasive carcinoma | Female | <65 | I/II | Hormone Therapy | tamoxiphen | SD |
| CMAS | SNV | Missense_Mutation | novel | c.808N>A | p.Glu270Lys | p.E270K | Q8NFW8 | protein_coding | tolerated(0.23) | benign(0.304) | TCGA-A8-A0A7-01 | Breast | breast invasive carcinoma | Female | <65 | I/II | Unknown | Unknown | SD |
| CMAS | SNV | Missense_Mutation | rs757760901 | c.485N>A | p.Arg162Gln | p.R162Q | Q8NFW8 | protein_coding | tolerated(0.55) | benign(0.003) | TCGA-AN-A046-01 | Breast | breast invasive carcinoma | Female | >=65 | I/II | Unknown | Unknown | SD |
| CMAS | SNV | Missense_Mutation | novel | c.1043N>T | p.Ser348Leu | p.S348L | Q8NFW8 | protein_coding | tolerated(0.24) | benign(0) | TCGA-LD-A74U-01 | Breast | breast invasive carcinoma | Female | >=65 | III/IV | Chemotherapy | taxotere | SD |
| CMAS | insertion | In_Frame_Ins | novel | c.132_133insACACTCTTTCACAGCACAAATCACACTCTA | p.His44_Leu45insThrLeuPheHisSerThrAsnHisThrLeu | p.H44_L45insTLFHSTNHTL | Q8NFW8 | protein_coding | TCGA-AN-A041-01 | Breast | breast invasive carcinoma | Female | <65 | I/II | Unknown | Unknown | SD | ||
| CMAS | deletion | Frame_Shift_Del | novel | c.958delN | p.Glu320ArgfsTer2 | p.E320Rfs*2 | Q8NFW8 | protein_coding | TCGA-EW-A2FV-01 | Breast | breast invasive carcinoma | Female | <65 | III/IV | Chemotherapy | docetaxel | SD | ||
| CMAS | SNV | Missense_Mutation | c.760T>C | p.Trp254Arg | p.W254R | Q8NFW8 | protein_coding | deleterious(0) | probably_damaging(0.997) | TCGA-AA-3672-01 | Colorectum | colon adenocarcinoma | Female | >=65 | III/IV | Unknown | Unknown | SD | |
| CMAS | SNV | Missense_Mutation | c.353N>T | p.Asp118Val | p.D118V | Q8NFW8 | protein_coding | deleterious(0) | probably_damaging(0.998) | TCGA-AA-3715-01 | Colorectum | colon adenocarcinoma | Male | >=65 | I/II | Unknown | Unknown | PD | |
| CMAS | SNV | Missense_Mutation | rs753560501 | c.329N>A | p.Arg110Gln | p.R110Q | Q8NFW8 | protein_coding | tolerated(0.06) | benign(0.318) | TCGA-AA-A00N-01 | Colorectum | colon adenocarcinoma | Male | >=65 | I/II | Unknown | Unknown | PD |
| CMAS | SNV | Missense_Mutation | c.828N>C | p.Lys276Asn | p.K276N | Q8NFW8 | protein_coding | deleterious(0.01) | probably_damaging(0.993) | TCGA-AA-A010-01 | Colorectum | colon adenocarcinoma | Female | <65 | I/II | Chemotherapy | folinic | CR |
| Page: 1 2 3 4 5 6 |
Top |
Related drugs of malignant transformation related genes |
| Identification of chemicals and drugs interact with genes involved in malignant transfromation |
| (DGIdb 4.0) |
| Entrez ID | Symbol | Category | Interaction Types | Drug Claim Name | Drug Name | PMIDs |
| Page: 1 |

Copyright 2023-Present -The University of Texas Health Science Center at Houston |