
|
|||||
|
 | |
| |
| |
| |
| |
| |
|
Gene: CLYBL |
Gene summary for CLYBL |
| Gene information | Species | Human | Gene symbol | CLYBL | Gene ID | 171425 |
| Gene name | citramalyl-CoA lyase | |
| Gene Alias | CLB | |
| Cytomap | 13q32.3 | |
| Gene Type | protein-coding | GO ID | GO:0006725 | UniProtAcc | Q8N0X4 |
Top |
Malignant transformation analysis |
| Identification of the aberrant gene expression in precancerous and cancerous lesions by comparing the gene expression of stem-like cells in diseased tissues with normal stem cells |
| Entrez ID | Symbol | Replicates | Species | Organ | Tissue | Adj P-value | Log2FC | Malignancy |
| 171425 | CLYBL | HTA11_3410_2000001011 | Human | Colorectum | AD | 1.62e-08 | -5.05e-01 | 0.0155 |
| 171425 | CLYBL | HTA11_347_2000001011 | Human | Colorectum | AD | 3.06e-08 | 6.07e-01 | -0.1954 |
| 171425 | CLYBL | HTA11_696_2000001011 | Human | Colorectum | AD | 8.87e-03 | -3.23e-01 | -0.1464 |
| 171425 | CLYBL | HTA11_866_3004761011 | Human | Colorectum | AD | 1.11e-07 | -4.60e-01 | 0.096 |
| 171425 | CLYBL | HTA11_7696_3000711011 | Human | Colorectum | AD | 3.50e-04 | -3.62e-01 | 0.0674 |
| 171425 | CLYBL | HTA11_99999970781_79442 | Human | Colorectum | MSS | 8.25e-04 | -3.21e-01 | 0.294 |
| 171425 | CLYBL | HTA11_99999965104_69814 | Human | Colorectum | MSS | 1.84e-03 | 4.99e-01 | 0.281 |
| 171425 | CLYBL | HTA11_99999974143_84620 | Human | Colorectum | MSS | 2.43e-03 | -3.30e-01 | 0.3005 |
| 171425 | CLYBL | A001-C-207 | Human | Colorectum | FAP | 1.51e-02 | -3.15e-01 | 0.1278 |
| 171425 | CLYBL | A015-C-203 | Human | Colorectum | FAP | 6.09e-31 | -5.76e-01 | -0.1294 |
| 171425 | CLYBL | A015-C-204 | Human | Colorectum | FAP | 1.95e-07 | -4.47e-01 | -0.0228 |
| 171425 | CLYBL | A014-C-040 | Human | Colorectum | FAP | 5.91e-06 | -5.68e-01 | -0.1184 |
| 171425 | CLYBL | A002-C-201 | Human | Colorectum | FAP | 1.07e-16 | -5.18e-01 | 0.0324 |
| 171425 | CLYBL | A002-C-203 | Human | Colorectum | FAP | 6.93e-04 | -2.99e-01 | 0.2786 |
| 171425 | CLYBL | A001-C-119 | Human | Colorectum | FAP | 1.61e-07 | -5.11e-01 | -0.1557 |
| 171425 | CLYBL | A001-C-108 | Human | Colorectum | FAP | 2.97e-22 | -4.82e-01 | -0.0272 |
| 171425 | CLYBL | A002-C-205 | Human | Colorectum | FAP | 2.95e-26 | -6.29e-01 | -0.1236 |
| 171425 | CLYBL | A001-C-104 | Human | Colorectum | FAP | 2.94e-03 | -2.96e-01 | 0.0184 |
| 171425 | CLYBL | A015-C-005 | Human | Colorectum | FAP | 6.18e-08 | -4.77e-01 | -0.0336 |
| 171425 | CLYBL | A015-C-006 | Human | Colorectum | FAP | 3.32e-12 | -4.14e-01 | -0.0994 |
| Page: 1 2 3 |
| Tissue | Expression Dynamics | Abbreviation |
| Colorectum (GSE201348) |  | FAP: Familial adenomatous polyposis |
| CRC: Colorectal cancer | ||
| Colorectum (HTA11) |  | AD: Adenomas |
| SER: Sessile serrated lesions | ||
| MSI-H: Microsatellite-high colorectal cancer | ||
| MSS: Microsatellite stable colorectal cancer | ||
| Liver | 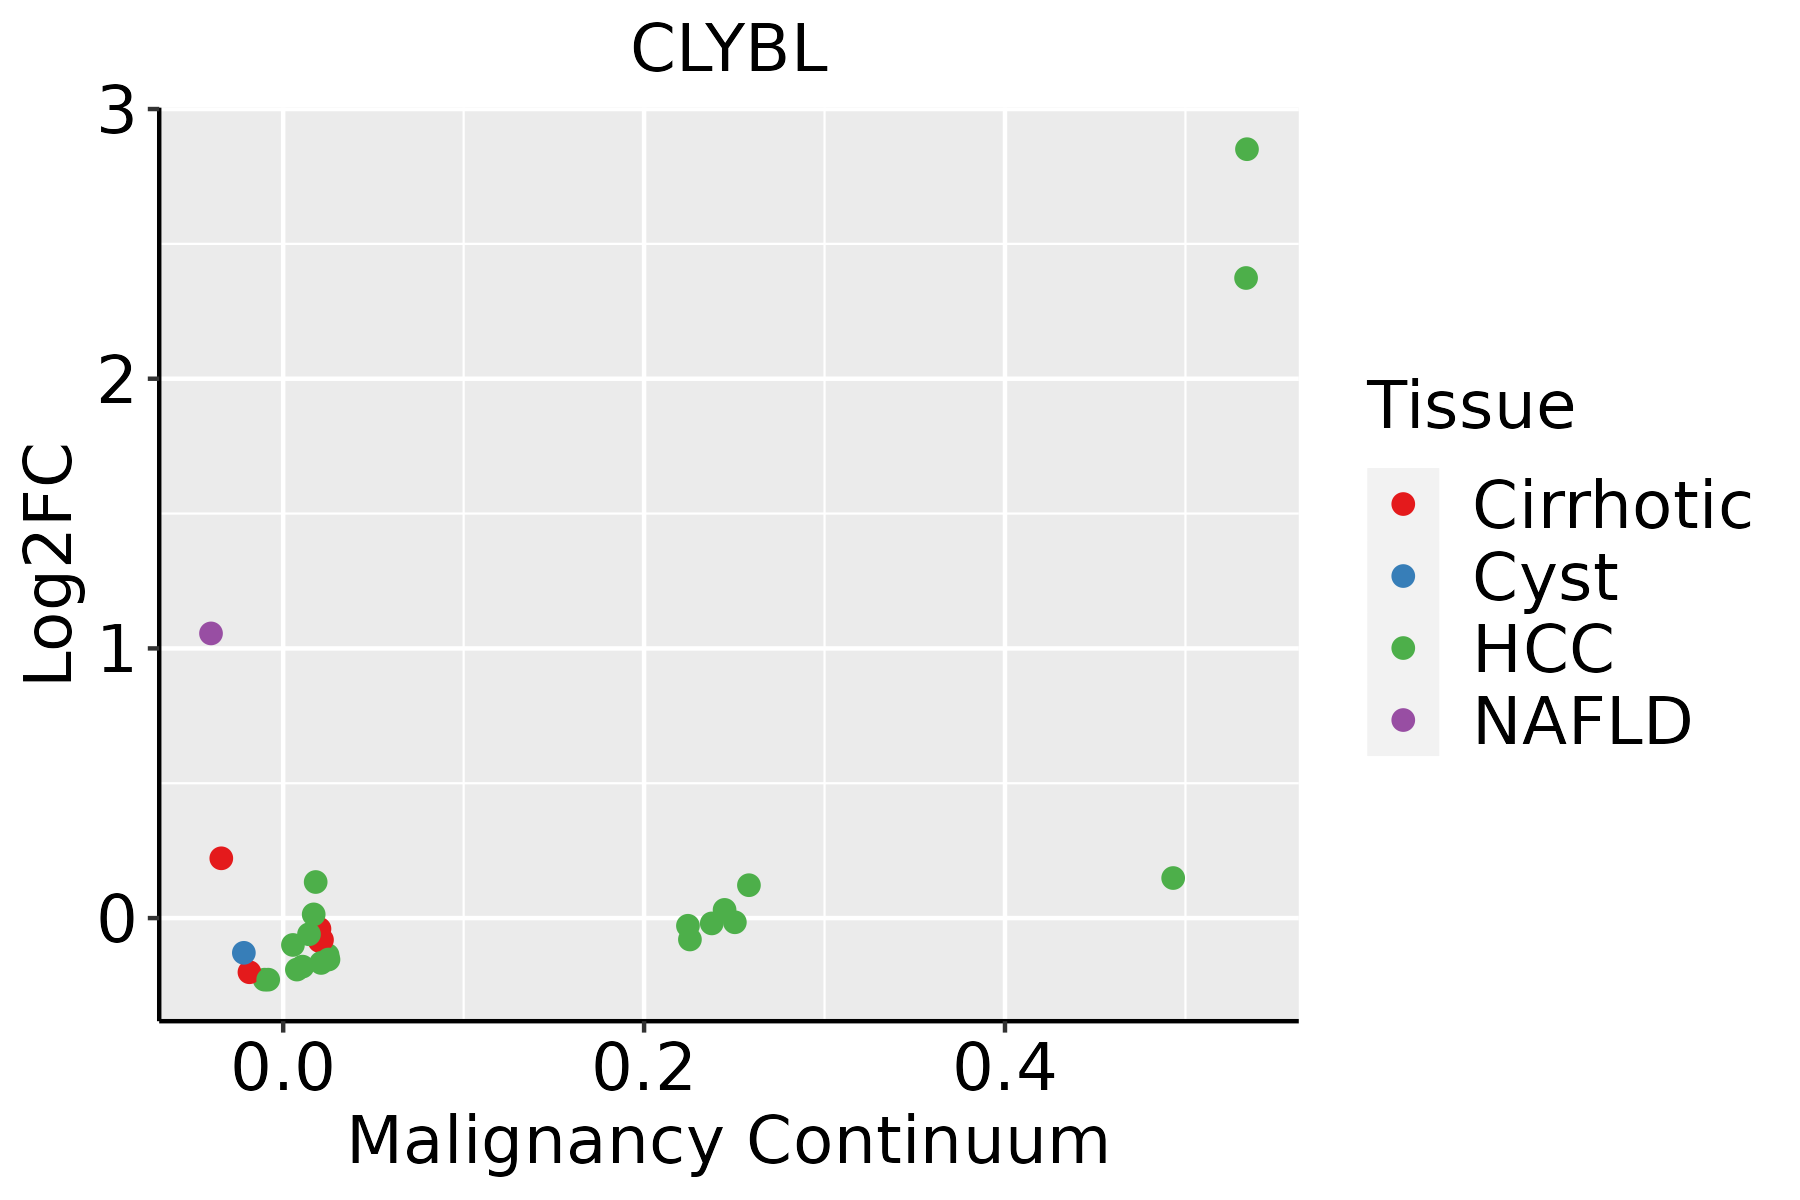 | HCC: Hepatocellular carcinoma |
| NAFLD: Non-alcoholic fatty liver disease |
| ∗log2FC in expression of this searched gene in stem-like cells from each diseased tissue sample relative to stem-like cells in normal samples in each tissue plotted against the malignancy continuum. Samples are colored based on if they are from different disease stage. |
Top |
Malignant transformation related pathway analysis |
| Find out the enriched GO biological processes and KEGG pathways involved in transition from healthy to precancer to cancer |
| Tissue | Disease Stage | Enriched GO biological Processes |
| Colorectum | AD |  |
| Colorectum | SER |  |
| Colorectum | MSS |  |
| Colorectum | MSI-H |  |
| Colorectum | FAP |  |
| ∗Top 15 enriched GO BP terms are showed in the bar plot of each disease state in each tissue. Each row represents a significant GO biological process which is colored according to the -log10(p.adjust). |
| Page: 1 2 3 4 5 6 7 8 9 |
| GO ID | Tissue | Disease Stage | Description | Gene Ratio | Bg Ratio | pvalue | p.adjust | Count |
| GO:0062012 | Colorectum | AD | regulation of small molecule metabolic process | 93/3918 | 334/18723 | 1.46e-03 | 1.24e-02 | 93 |
| GO:00620121 | Colorectum | MSS | regulation of small molecule metabolic process | 83/3467 | 334/18723 | 2.25e-03 | 1.85e-02 | 83 |
| GO:0062013 | Colorectum | MSS | positive regulation of small molecule metabolic process | 39/3467 | 143/18723 | 6.34e-03 | 4.23e-02 | 39 |
| GO:00620122 | Colorectum | FAP | regulation of small molecule metabolic process | 74/2622 | 334/18723 | 3.15e-05 | 7.13e-04 | 74 |
| GO:00620131 | Colorectum | FAP | positive regulation of small molecule metabolic process | 34/2622 | 143/18723 | 1.15e-03 | 1.10e-02 | 34 |
| GO:00620132 | Colorectum | CRC | positive regulation of small molecule metabolic process | 27/2078 | 143/18723 | 3.97e-03 | 3.29e-02 | 27 |
| GO:00620125 | Liver | NAFLD | regulation of small molecule metabolic process | 63/1882 | 334/18723 | 6.55e-07 | 3.79e-05 | 63 |
| GO:006201212 | Liver | Cirrhotic | regulation of small molecule metabolic process | 124/4634 | 334/18723 | 2.74e-07 | 6.79e-06 | 124 |
| GO:0033013 | Liver | Cirrhotic | tetrapyrrole metabolic process | 24/4634 | 59/18723 | 5.06e-03 | 2.62e-02 | 24 |
| GO:006201222 | Liver | HCC | regulation of small molecule metabolic process | 190/7958 | 334/18723 | 6.77e-08 | 1.40e-06 | 190 |
| GO:0006767 | Liver | HCC | water-soluble vitamin metabolic process | 39/7958 | 59/18723 | 2.14e-04 | 1.63e-03 | 39 |
| GO:00330131 | Liver | HCC | tetrapyrrole metabolic process | 39/7958 | 59/18723 | 2.14e-04 | 1.63e-03 | 39 |
| GO:0006766 | Liver | HCC | vitamin metabolic process | 57/7958 | 106/18723 | 1.25e-02 | 4.53e-02 | 57 |
| Page: 1 |
| Pathway ID | Tissue | Disease Stage | Description | Gene Ratio | Bg Ratio | pvalue | p.adjust | qvalue | Count |
| Page: 1 |
Top |
Cell-cell communication analysis |
| Identification of potential cell-cell interactions between two cell types and their ligand-receptor pairs for different disease states |
| Ligand | Receptor | LRpair | Pathway | Tissue | Disease Stage |
| Page: 1 |
Top |
Single-cell gene regulatory network inference analysis |
| Find out the significant the regulons (TFs) and the target genes of each regulon across cell types for different disease states |
| TF | Cell Type | Tissue | Disease Stage | Target Gene | RSS | Regulon Activity |
| ∗The dot plots of a searched regulon are shown for all cell subpopulations in each disease state of each tissue based on the regulon specific score inferred using pySCENIC and by calculating the average expression. |
| Page: 1 |
Top |
Somatic mutation of malignant transformation related genes |
| Annotation of somatic variants for genes involved in malignant transformation |
| Hugo Symbol | Variant Class | Variant Classification | dbSNP RS | HGVSc | HGVSp | HGVSp Short | SWISSPROT | BIOTYPE | SIFT | PolyPhen | Tumor Sample Barcode | Tissue | Histology | Sex | Age | Stage | Therapy Types | Drugs | Outcome |
| CLYBL | SNV | Missense_Mutation | c.221N>C | p.Cys74Ser | p.C74S | Q8N0X4 | protein_coding | deleterious(0) | probably_damaging(0.989) | TCGA-A7-A26I-01 | Breast | breast invasive carcinoma | Female | >=65 | I/II | Chemotherapy | cytoxan | SD | |
| CLYBL | SNV | Missense_Mutation | c.638N>G | p.Ala213Gly | p.A213G | Q8N0X4 | protein_coding | tolerated(0.05) | benign(0.327) | TCGA-BH-A18N-01 | Breast | breast invasive carcinoma | Female | >=65 | I/II | Unknown | Unknown | SD | |
| CLYBL | SNV | Missense_Mutation | c.355N>C | p.Asp119His | p.D119H | Q8N0X4 | protein_coding | deleterious(0) | probably_damaging(0.996) | TCGA-E2-A14Y-01 | Breast | breast invasive carcinoma | Female | <65 | I/II | Chemotherapy | carboplatin | SD | |
| CLYBL | SNV | Missense_Mutation | c.946N>T | p.Gly316Trp | p.G316W | Q8N0X4 | protein_coding | deleterious(0) | probably_damaging(1) | TCGA-AA-3672-01 | Colorectum | colon adenocarcinoma | Female | >=65 | III/IV | Unknown | Unknown | SD | |
| CLYBL | SNV | Missense_Mutation | c.818A>G | p.His273Arg | p.H273R | Q8N0X4 | protein_coding | deleterious(0) | probably_damaging(0.951) | TCGA-AA-3715-01 | Colorectum | colon adenocarcinoma | Male | >=65 | I/II | Unknown | Unknown | PD | |
| CLYBL | SNV | Missense_Mutation | rs200083846 | c.347N>T | p.Ala116Val | p.A116V | Q8N0X4 | protein_coding | deleterious(0.02) | benign(0.395) | TCGA-AA-3966-01 | Colorectum | colon adenocarcinoma | Female | >=65 | I/II | Unknown | Unknown | SD |
| CLYBL | SNV | Missense_Mutation | c.691N>A | p.Val231Ile | p.V231I | Q8N0X4 | protein_coding | tolerated(0.06) | benign(0.033) | TCGA-AA-A01R-01 | Colorectum | colon adenocarcinoma | Male | <65 | III/IV | Chemotherapy | 5-fluorouracil | PD | |
| CLYBL | SNV | Missense_Mutation | c.992T>C | p.Val331Ala | p.V331A | Q8N0X4 | protein_coding | deleterious(0) | possibly_damaging(0.573) | TCGA-AZ-6601-01 | Colorectum | colon adenocarcinoma | Male | >=65 | I/II | Unknown | Unknown | PD | |
| CLYBL | SNV | Missense_Mutation | novel | c.626N>T | p.Ala209Val | p.A209V | Q8N0X4 | protein_coding | deleterious(0.02) | probably_damaging(0.951) | TCGA-D5-6928-01 | Colorectum | colon adenocarcinoma | Male | >=65 | I/II | Unknown | Unknown | SD |
| CLYBL | SNV | Missense_Mutation | c.940N>A | p.Phe314Ile | p.F314I | Q8N0X4 | protein_coding | deleterious(0) | probably_damaging(0.986) | TCGA-DM-A285-01 | Colorectum | colon adenocarcinoma | Female | >=65 | III/IV | Unknown | Unknown | SD |
| Page: 1 2 3 |
Top |
Related drugs of malignant transformation related genes |
| Identification of chemicals and drugs interact with genes involved in malignant transfromation |
| (DGIdb 4.0) |
| Entrez ID | Symbol | Category | Interaction Types | Drug Claim Name | Drug Name | PMIDs |
| Page: 1 |

Copyright 2023-Present -The University of Texas Health Science Center at Houston |