
|
|||||
|
 | |
| |
| |
| |
| |
| |
|
Gene: CLUH |
Gene summary for CLUH |
| Gene information | Species | Human | Gene symbol | CLUH | Gene ID | 23277 |
| Gene name | clustered mitochondria homolog | |
| Gene Alias | CLU1 | |
| Cytomap | 17p13.3 | |
| Gene Type | protein-coding | GO ID | GO:0006996 | UniProtAcc | O75153 |
Top |
Malignant transformation analysis |
| Identification of the aberrant gene expression in precancerous and cancerous lesions by comparing the gene expression of stem-like cells in diseased tissues with normal stem cells |
| Entrez ID | Symbol | Replicates | Species | Organ | Tissue | Adj P-value | Log2FC | Malignancy |
| 23277 | CLUH | HTA11_347_2000001011 | Human | Colorectum | AD | 3.85e-02 | 2.37e-01 | -0.1954 |
| 23277 | CLUH | HTA11_1391_2000001011 | Human | Colorectum | AD | 6.26e-03 | 4.15e-01 | -0.059 |
| 23277 | CLUH | HTA11_866_3004761011 | Human | Colorectum | AD | 2.91e-06 | 3.68e-01 | 0.096 |
| 23277 | CLUH | HTA11_7663_2000001011 | Human | Colorectum | SER | 1.33e-02 | 3.73e-01 | 0.0131 |
| 23277 | CLUH | HTA11_6801_2000001011 | Human | Colorectum | SER | 2.51e-02 | 6.11e-01 | 0.0171 |
| 23277 | CLUH | HTA11_7696_3000711011 | Human | Colorectum | AD | 2.35e-04 | 2.99e-01 | 0.0674 |
| 23277 | CLUH | A015-C-203 | Human | Colorectum | FAP | 2.56e-14 | 4.28e-01 | -0.1294 |
| 23277 | CLUH | A015-C-204 | Human | Colorectum | FAP | 9.99e-05 | 4.86e-01 | -0.0228 |
| 23277 | CLUH | A014-C-040 | Human | Colorectum | FAP | 3.77e-02 | 5.21e-01 | -0.1184 |
| 23277 | CLUH | A002-C-205 | Human | Colorectum | FAP | 1.86e-04 | 7.49e-02 | -0.1236 |
| 23277 | CLUH | A015-C-006 | Human | Colorectum | FAP | 5.33e-07 | 4.03e-01 | -0.0994 |
| 23277 | CLUH | A015-C-106 | Human | Colorectum | FAP | 4.21e-04 | 2.05e-01 | -0.0511 |
| 23277 | CLUH | A002-C-114 | Human | Colorectum | FAP | 2.29e-04 | 1.99e-01 | -0.1561 |
| 23277 | CLUH | A015-C-104 | Human | Colorectum | FAP | 2.11e-11 | 3.00e-01 | -0.1899 |
| 23277 | CLUH | A015-C-202 | Human | Colorectum | FAP | 2.90e-03 | 3.45e-01 | -0.0849 |
| 23277 | CLUH | A002-C-016 | Human | Colorectum | FAP | 9.27e-04 | -1.94e-02 | 0.0521 |
| 23277 | CLUH | A015-C-002 | Human | Colorectum | FAP | 1.31e-03 | 3.17e-01 | -0.0763 |
| 23277 | CLUH | A002-C-116 | Human | Colorectum | FAP | 3.90e-07 | -5.53e-02 | -0.0452 |
| 23277 | CLUH | A014-C-008 | Human | Colorectum | FAP | 2.47e-03 | 2.57e-01 | -0.191 |
| 23277 | CLUH | A018-E-020 | Human | Colorectum | FAP | 9.69e-03 | 6.02e-02 | -0.2034 |
| Page: 1 2 3 4 5 6 |
| Tissue | Expression Dynamics | Abbreviation |
| Colorectum (GSE201348) |  | FAP: Familial adenomatous polyposis |
| CRC: Colorectal cancer | ||
| Colorectum (HTA11) |  | AD: Adenomas |
| SER: Sessile serrated lesions | ||
| MSI-H: Microsatellite-high colorectal cancer | ||
| MSS: Microsatellite stable colorectal cancer | ||
| Esophagus | 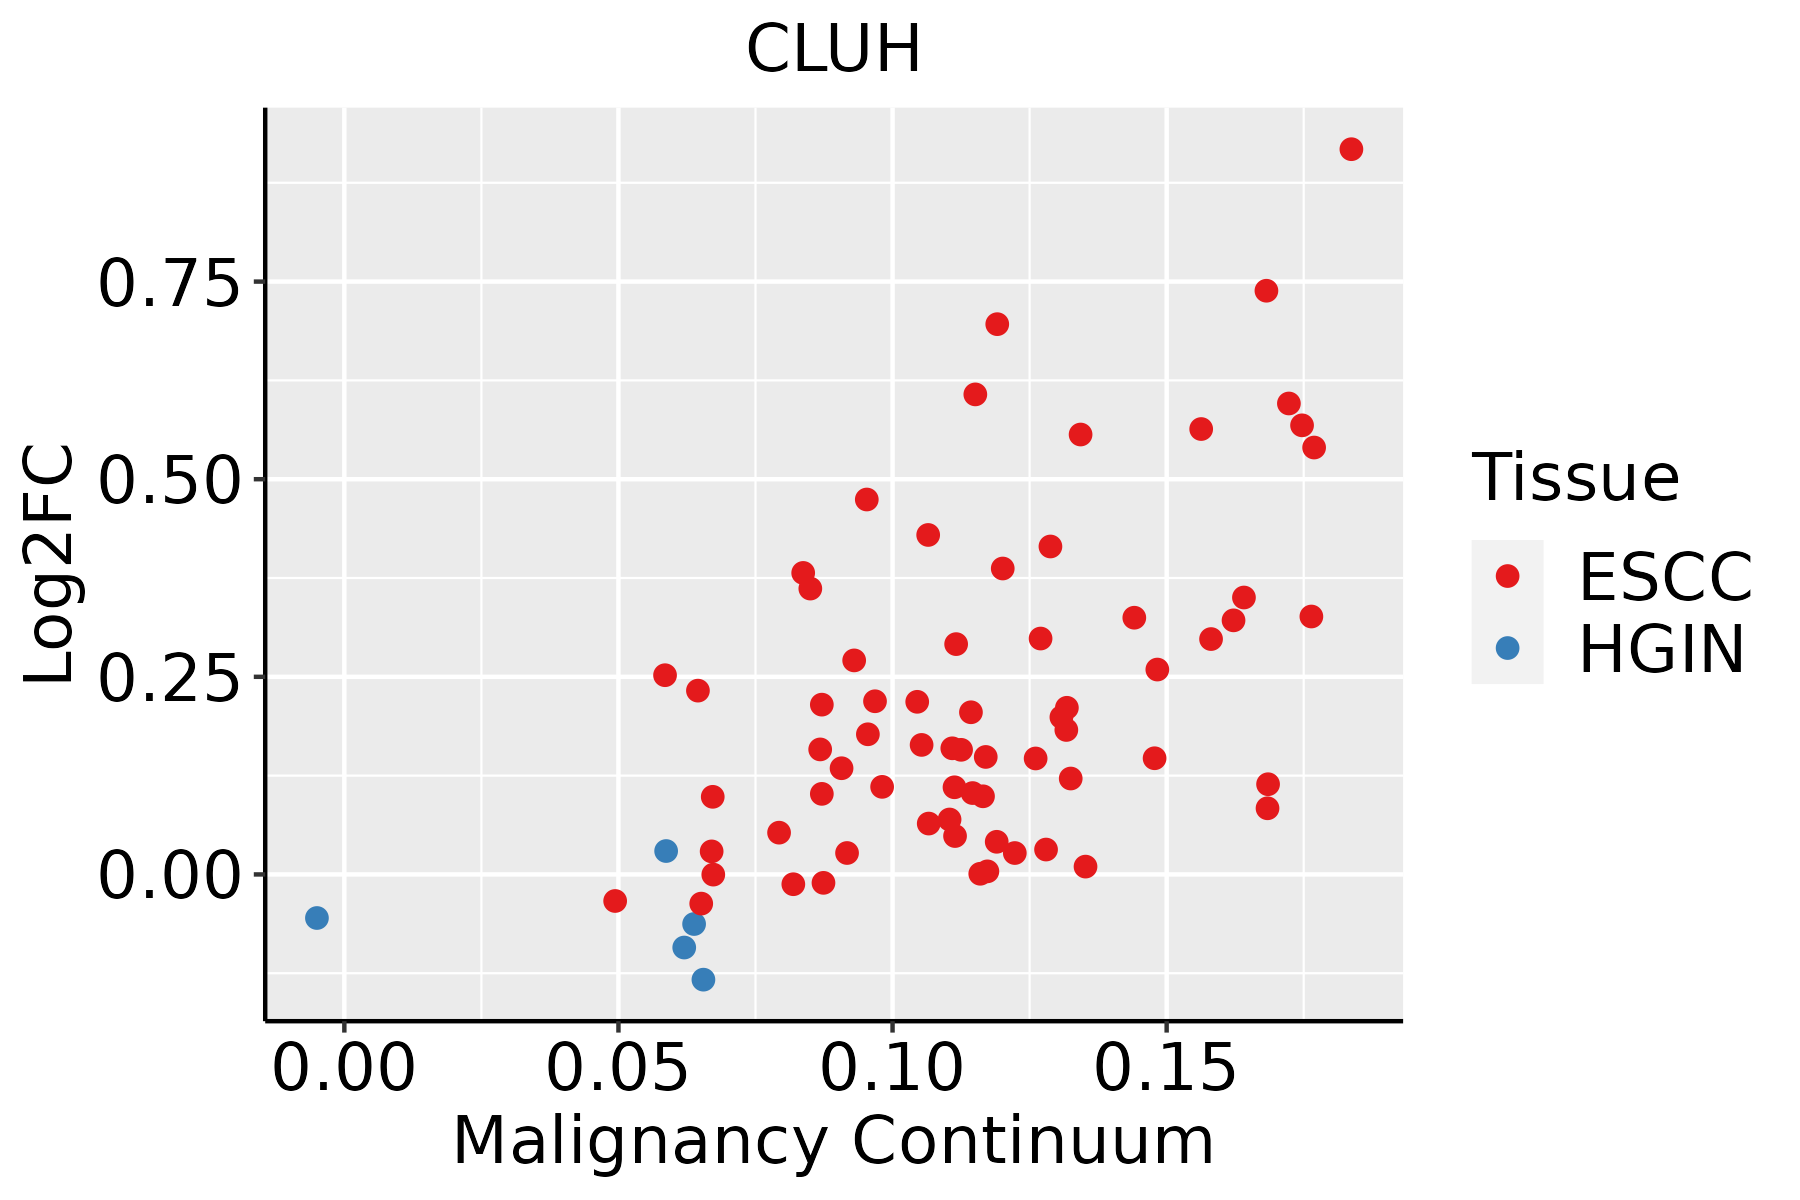 | ESCC: Esophageal squamous cell carcinoma |
| HGIN: High-grade intraepithelial neoplasias | ||
| LGIN: Low-grade intraepithelial neoplasias | ||
| Liver |  | HCC: Hepatocellular carcinoma |
| NAFLD: Non-alcoholic fatty liver disease | ||
| Oral Cavity | 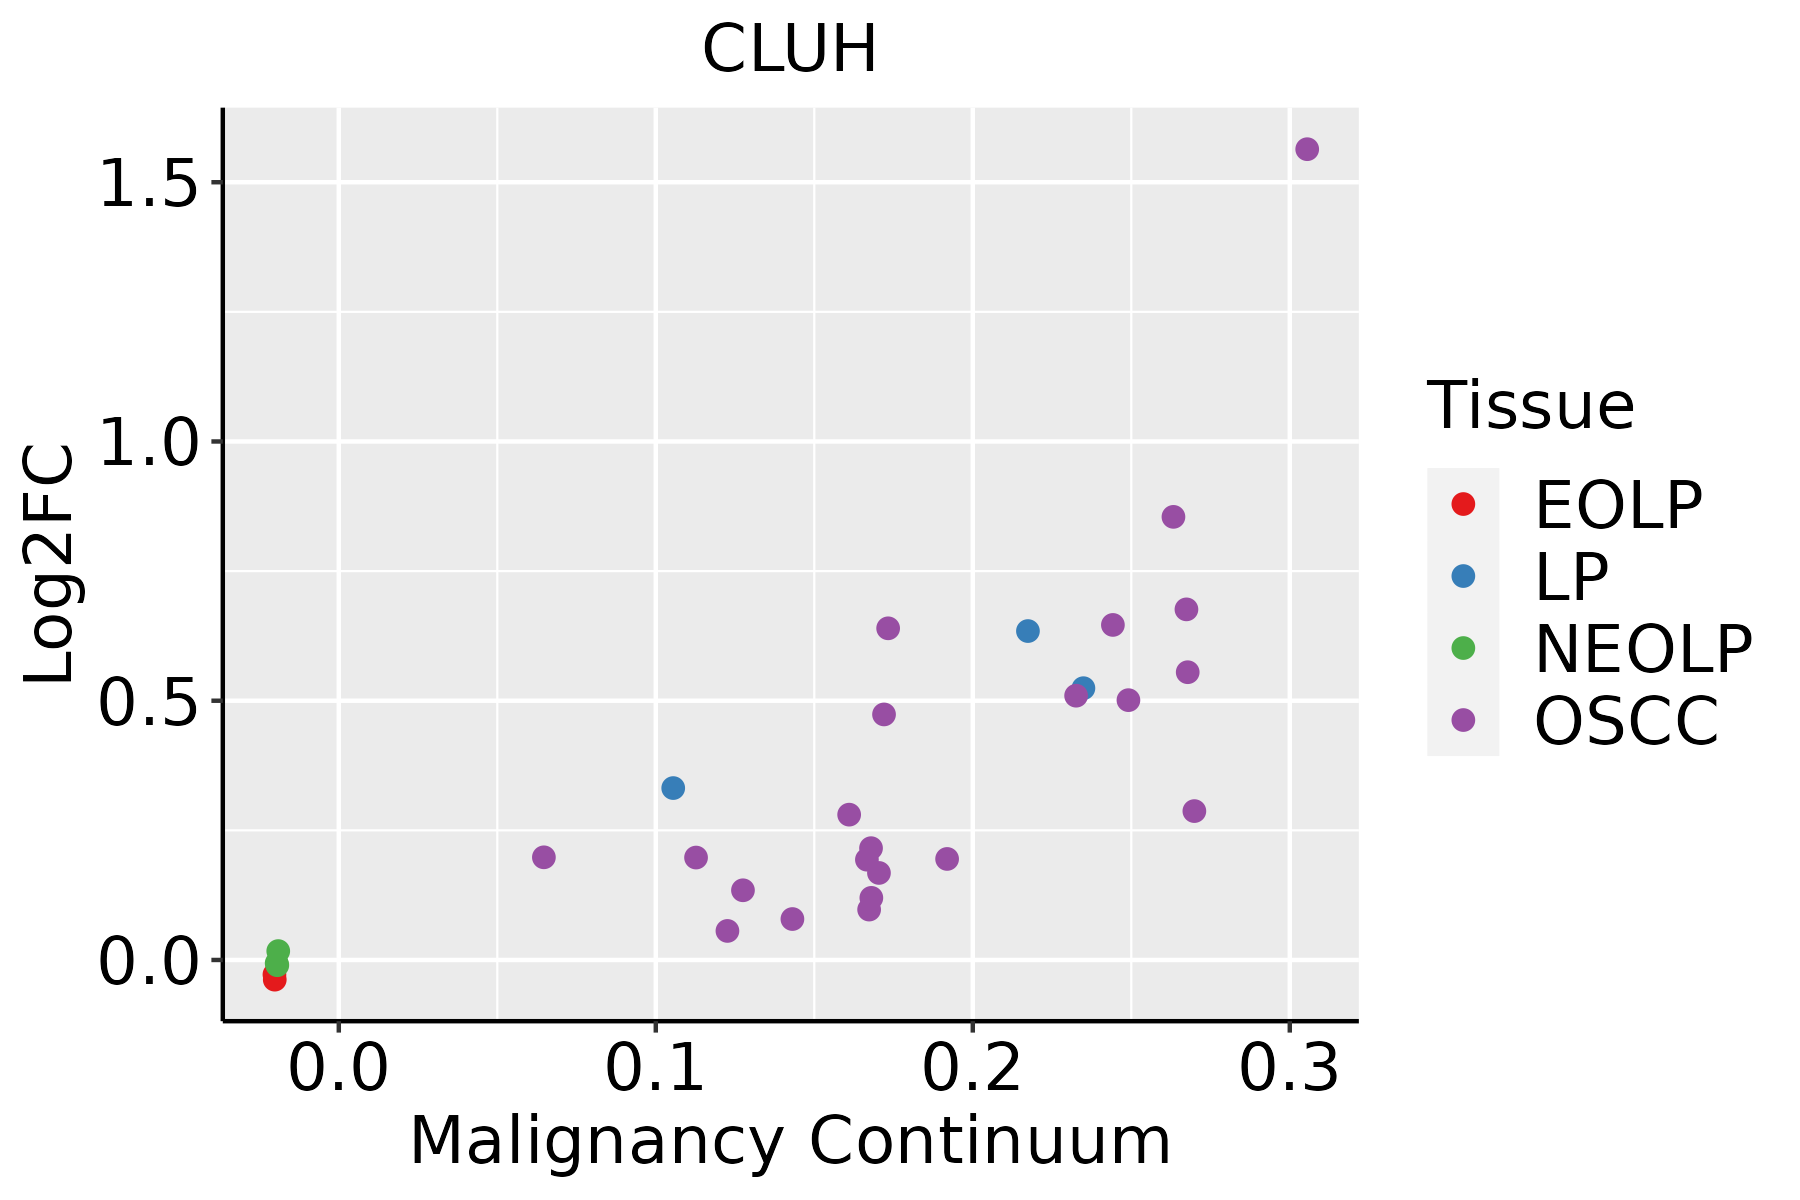 | EOLP: Erosive Oral lichen planus |
| LP: leukoplakia | ||
| NEOLP: Non-erosive oral lichen planus | ||
| OSCC: Oral squamous cell carcinoma | ||
| Skin | 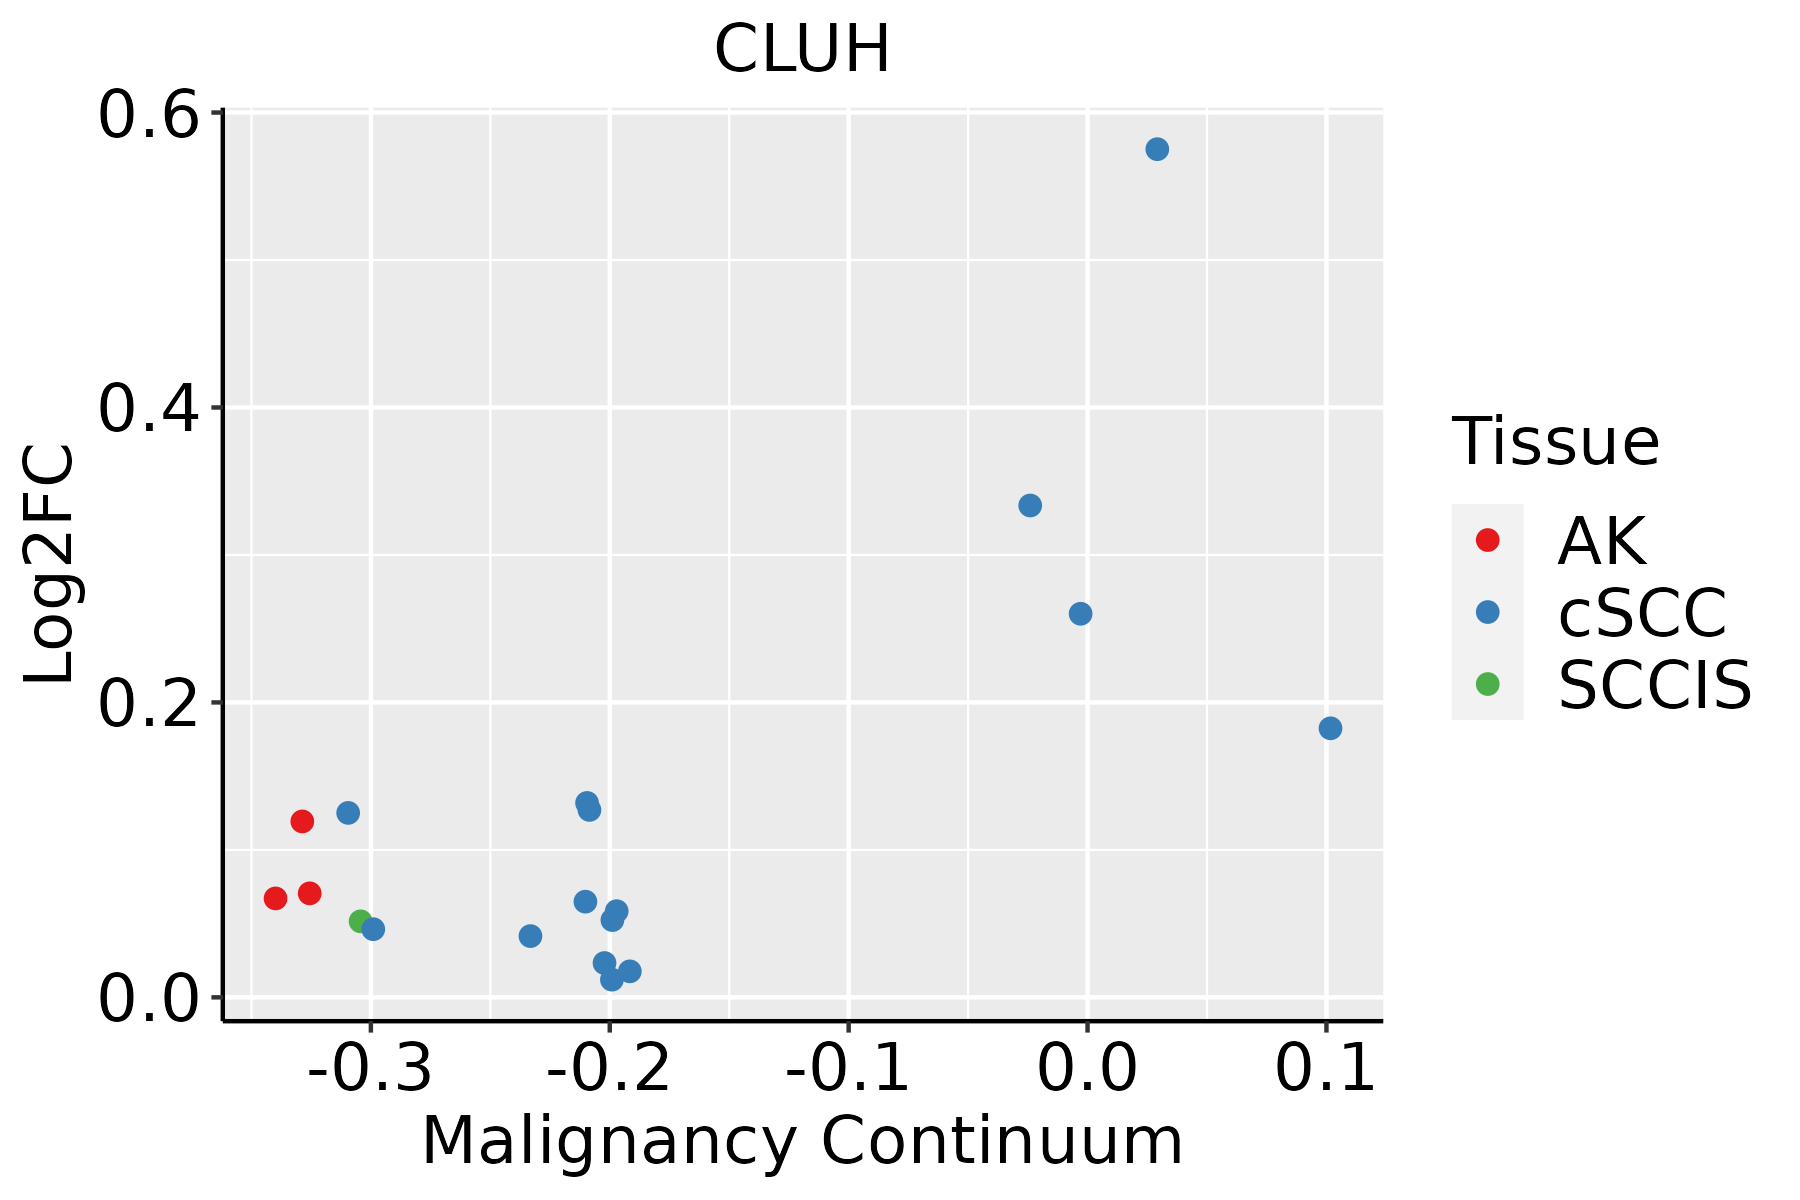 | AK: Actinic keratosis |
| cSCC: Cutaneous squamous cell carcinoma | ||
| SCCIS:squamous cell carcinoma in situ |
| ∗log2FC in expression of this searched gene in stem-like cells from each diseased tissue sample relative to stem-like cells in normal samples in each tissue plotted against the malignancy continuum. Samples are colored based on if they are from different disease stage. |
Top |
Malignant transformation related pathway analysis |
| Find out the enriched GO biological processes and KEGG pathways involved in transition from healthy to precancer to cancer |
| Tissue | Disease Stage | Enriched GO biological Processes |
| Colorectum | AD |  |
| Colorectum | SER |  |
| Colorectum | MSS |  |
| Colorectum | MSI-H |  |
| Colorectum | FAP |  |
| ∗Top 15 enriched GO BP terms are showed in the bar plot of each disease state in each tissue. Each row represents a significant GO biological process which is colored according to the -log10(p.adjust). |
| Page: 1 2 3 4 5 6 7 8 9 |
| GO ID | Tissue | Disease Stage | Description | Gene Ratio | Bg Ratio | pvalue | p.adjust | Count |
| GO:00516463 | Esophagus | ESCC | mitochondrion localization | 35/8552 | 50/18723 | 4.33e-04 | 2.44e-03 | 35 |
| GO:0051646 | Liver | HCC | mitochondrion localization | 34/7958 | 50/18723 | 2.38e-04 | 1.79e-03 | 34 |
| GO:0048311 | Liver | HCC | mitochondrion distribution | 12/7958 | 16/18723 | 8.74e-03 | 3.40e-02 | 12 |
| GO:00516462 | Oral cavity | OSCC | mitochondrion localization | 28/7305 | 50/18723 | 1.10e-02 | 3.72e-02 | 28 |
| GO:005164611 | Skin | cSCC | mitochondrion localization | 22/4864 | 50/18723 | 4.31e-03 | 2.27e-02 | 22 |
| Page: 1 |
| Pathway ID | Tissue | Disease Stage | Description | Gene Ratio | Bg Ratio | pvalue | p.adjust | qvalue | Count |
| Page: 1 |
Top |
Cell-cell communication analysis |
| Identification of potential cell-cell interactions between two cell types and their ligand-receptor pairs for different disease states |
| Ligand | Receptor | LRpair | Pathway | Tissue | Disease Stage |
| Page: 1 |
Top |
Single-cell gene regulatory network inference analysis |
| Find out the significant the regulons (TFs) and the target genes of each regulon across cell types for different disease states |
| TF | Cell Type | Tissue | Disease Stage | Target Gene | RSS | Regulon Activity |
| ∗The dot plots of a searched regulon are shown for all cell subpopulations in each disease state of each tissue based on the regulon specific score inferred using pySCENIC and by calculating the average expression. |
| Page: 1 |
Top |
Somatic mutation of malignant transformation related genes |
| Annotation of somatic variants for genes involved in malignant transformation |
| Hugo Symbol | Variant Class | Variant Classification | dbSNP RS | HGVSc | HGVSp | HGVSp Short | SWISSPROT | BIOTYPE | SIFT | PolyPhen | Tumor Sample Barcode | Tissue | Histology | Sex | Age | Stage | Therapy Types | Drugs | Outcome |
| CLUH | SNV | Missense_Mutation | c.1260N>G | p.Ile420Met | p.I420M | O75153 | protein_coding | deleterious(0.03) | probably_damaging(0.955) | TCGA-AC-A23H-01 | Breast | breast invasive carcinoma | Female | >=65 | I/II | Unknown | Unknown | PD | |
| CLUH | SNV | Missense_Mutation | novel | c.3835N>T | p.Pro1279Ser | p.P1279S | O75153 | protein_coding | tolerated_low_confidence(0.39) | benign(0) | TCGA-AC-A6IW-01 | Breast | breast invasive carcinoma | Female | >=65 | I/II | Unknown | Unknown | SD |
| CLUH | SNV | Missense_Mutation | c.3860N>T | p.Ala1287Val | p.A1287V | O75153 | protein_coding | tolerated_low_confidence(0.29) | benign(0.007) | TCGA-BH-A18G-01 | Breast | breast invasive carcinoma | Female | >=65 | I/II | Unknown | Unknown | SD | |
| CLUH | SNV | Missense_Mutation | c.160N>A | p.Ala54Thr | p.A54T | O75153 | protein_coding | tolerated(0.19) | benign(0.102) | TCGA-BH-A18G-01 | Breast | breast invasive carcinoma | Female | >=65 | I/II | Unknown | Unknown | SD | |
| CLUH | SNV | Missense_Mutation | c.2651N>T | p.Thr884Ile | p.T884I | O75153 | protein_coding | deleterious(0.01) | benign(0.304) | TCGA-E2-A14Q-01 | Breast | breast invasive carcinoma | Female | <65 | I/II | Hormone Therapy | tamoxiphen | SD | |
| CLUH | SNV | Missense_Mutation | novel | c.3016A>G | p.Asn1006Asp | p.N1006D | O75153 | protein_coding | deleterious(0.01) | possibly_damaging(0.722) | TCGA-EW-A1IZ-01 | Breast | breast invasive carcinoma | Female | <65 | III/IV | Chemotherapy | taxotere | SD |
| CLUH | SNV | Missense_Mutation | c.1810N>A | p.Leu604Met | p.L604M | O75153 | protein_coding | deleterious(0) | probably_damaging(0.947) | TCGA-GM-A2D9-01 | Breast | breast invasive carcinoma | Female | >=65 | I/II | Hormone Therapy | arimidex | SD | |
| CLUH | deletion | Frame_Shift_Del | novel | c.1768_1810delNNNNNNNNNNNNNNNNNNNNNNNNNNNNNNNNNNNNNNNNNNN | p.Arg590CysfsTer18 | p.R590Cfs*18 | O75153 | protein_coding | TCGA-A2-A04P-01 | Breast | breast invasive carcinoma | Female | <65 | III/IV | Chemotherapy | taxol | PD | ||
| CLUH | insertion | Frame_Shift_Ins | novel | c.1022_1023insTAAAA | p.Ser342LysfsTer66 | p.S342Kfs*66 | O75153 | protein_coding | TCGA-BH-A0HF-01 | Breast | breast invasive carcinoma | Female | >=65 | I/II | Hormone Therapy | arimidex | SD | ||
| CLUH | SNV | Missense_Mutation | novel | c.3147N>C | p.Met1049Ile | p.M1049I | O75153 | protein_coding | tolerated(0.24) | benign(0.147) | TCGA-MA-AA3W-01 | Cervix | cervical & endocervical cancer | Female | <65 | I/II | Chemotherapy | cisplatin | CR |
| Page: 1 2 3 4 5 6 7 8 9 10 11 12 13 |
Top |
Related drugs of malignant transformation related genes |
| Identification of chemicals and drugs interact with genes involved in malignant transfromation |
| (DGIdb 4.0) |
| Entrez ID | Symbol | Category | Interaction Types | Drug Claim Name | Drug Name | PMIDs |
| Page: 1 |

Copyright 2023-Present -The University of Texas Health Science Center at Houston |