| Tissue | Expression Dynamics | Abbreviation |
| Breast |  | IDC: Invasive ductal carcinoma |
| DCIS: Ductal carcinoma in situ |
| Precancer(BRCA1-mut): Precancerous lesion from BRCA1 mutation carriers |
| Colorectum (GSE201348) |  | FAP: Familial adenomatous polyposis |
| CRC: Colorectal cancer |
| Colorectum (HTA11) |  | AD: Adenomas |
| SER: Sessile serrated lesions |
| MSI-H: Microsatellite-high colorectal cancer |
| MSS: Microsatellite stable colorectal cancer |
| Esophagus | 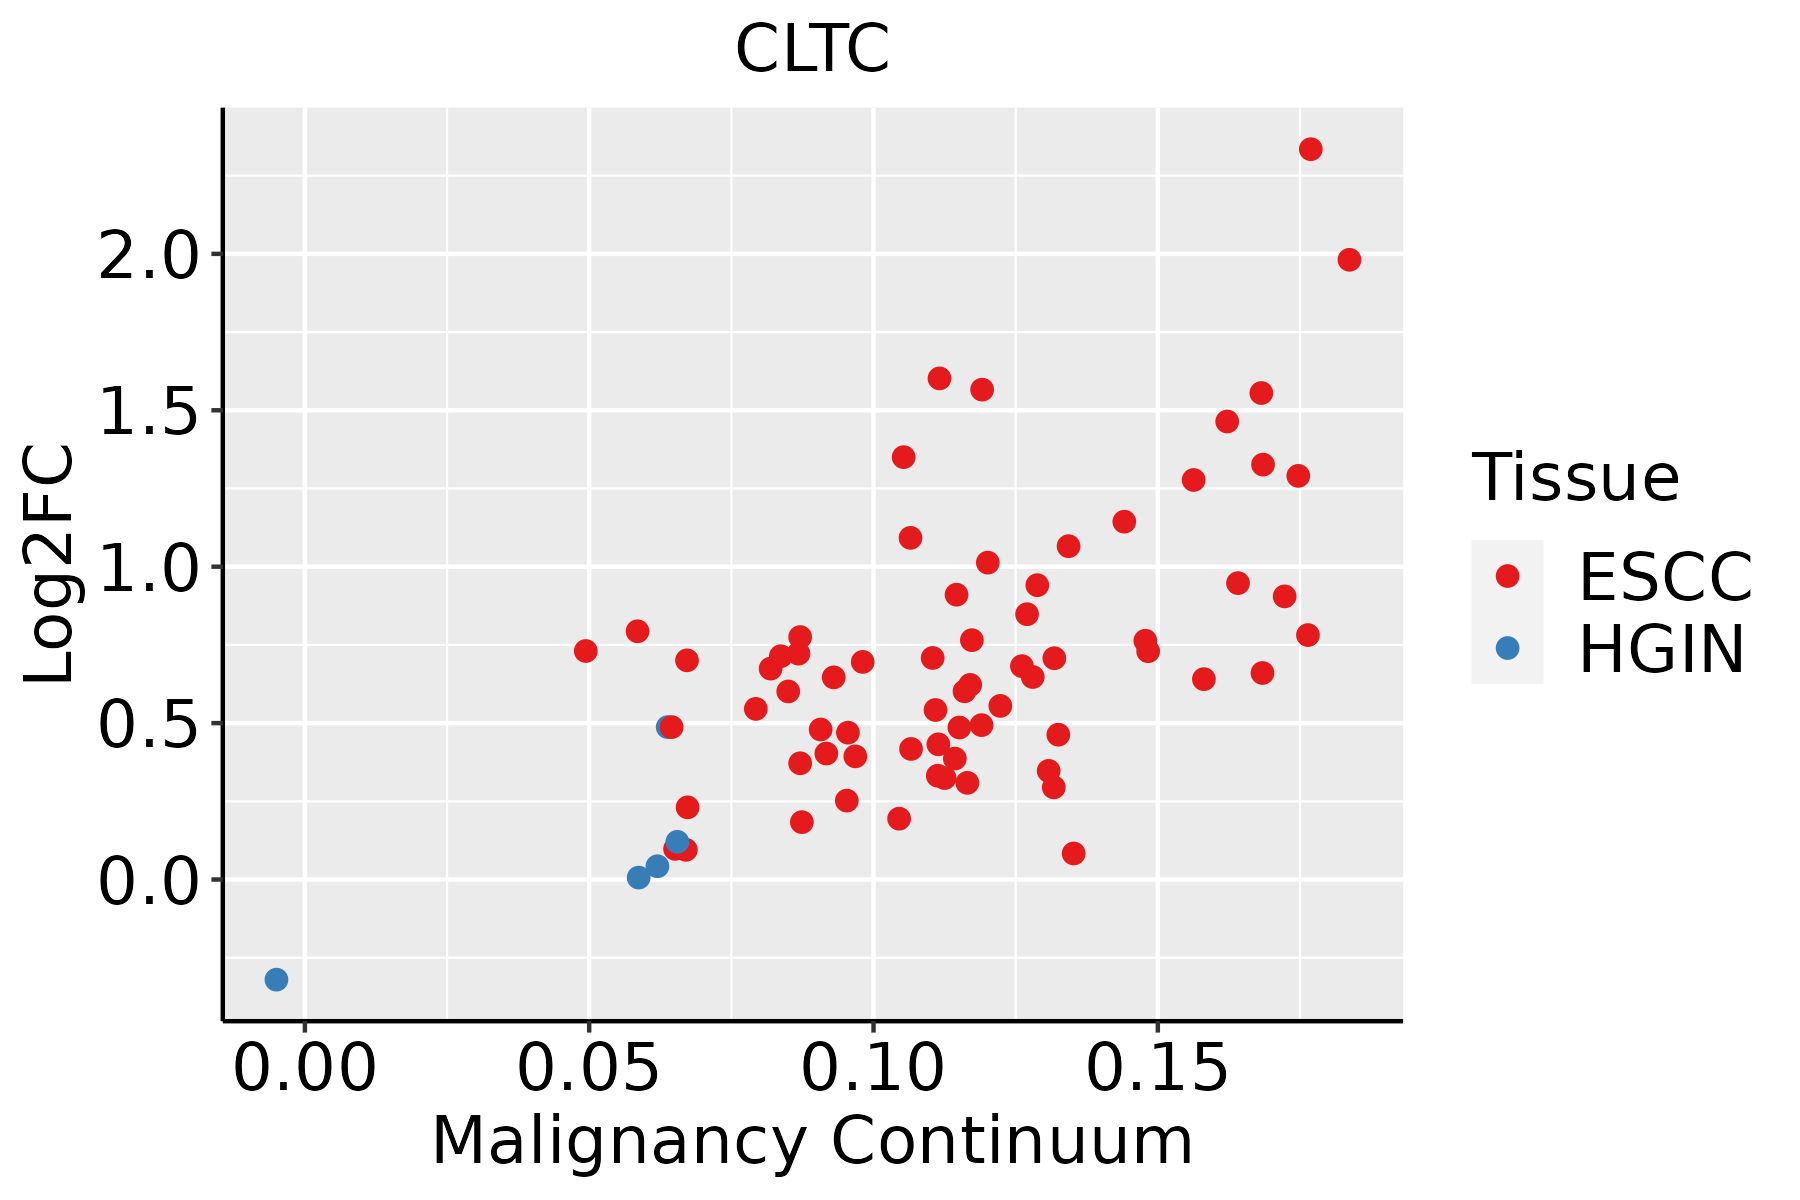 | ESCC: Esophageal squamous cell carcinoma |
| HGIN: High-grade intraepithelial neoplasias |
| LGIN: Low-grade intraepithelial neoplasias |
| Liver | 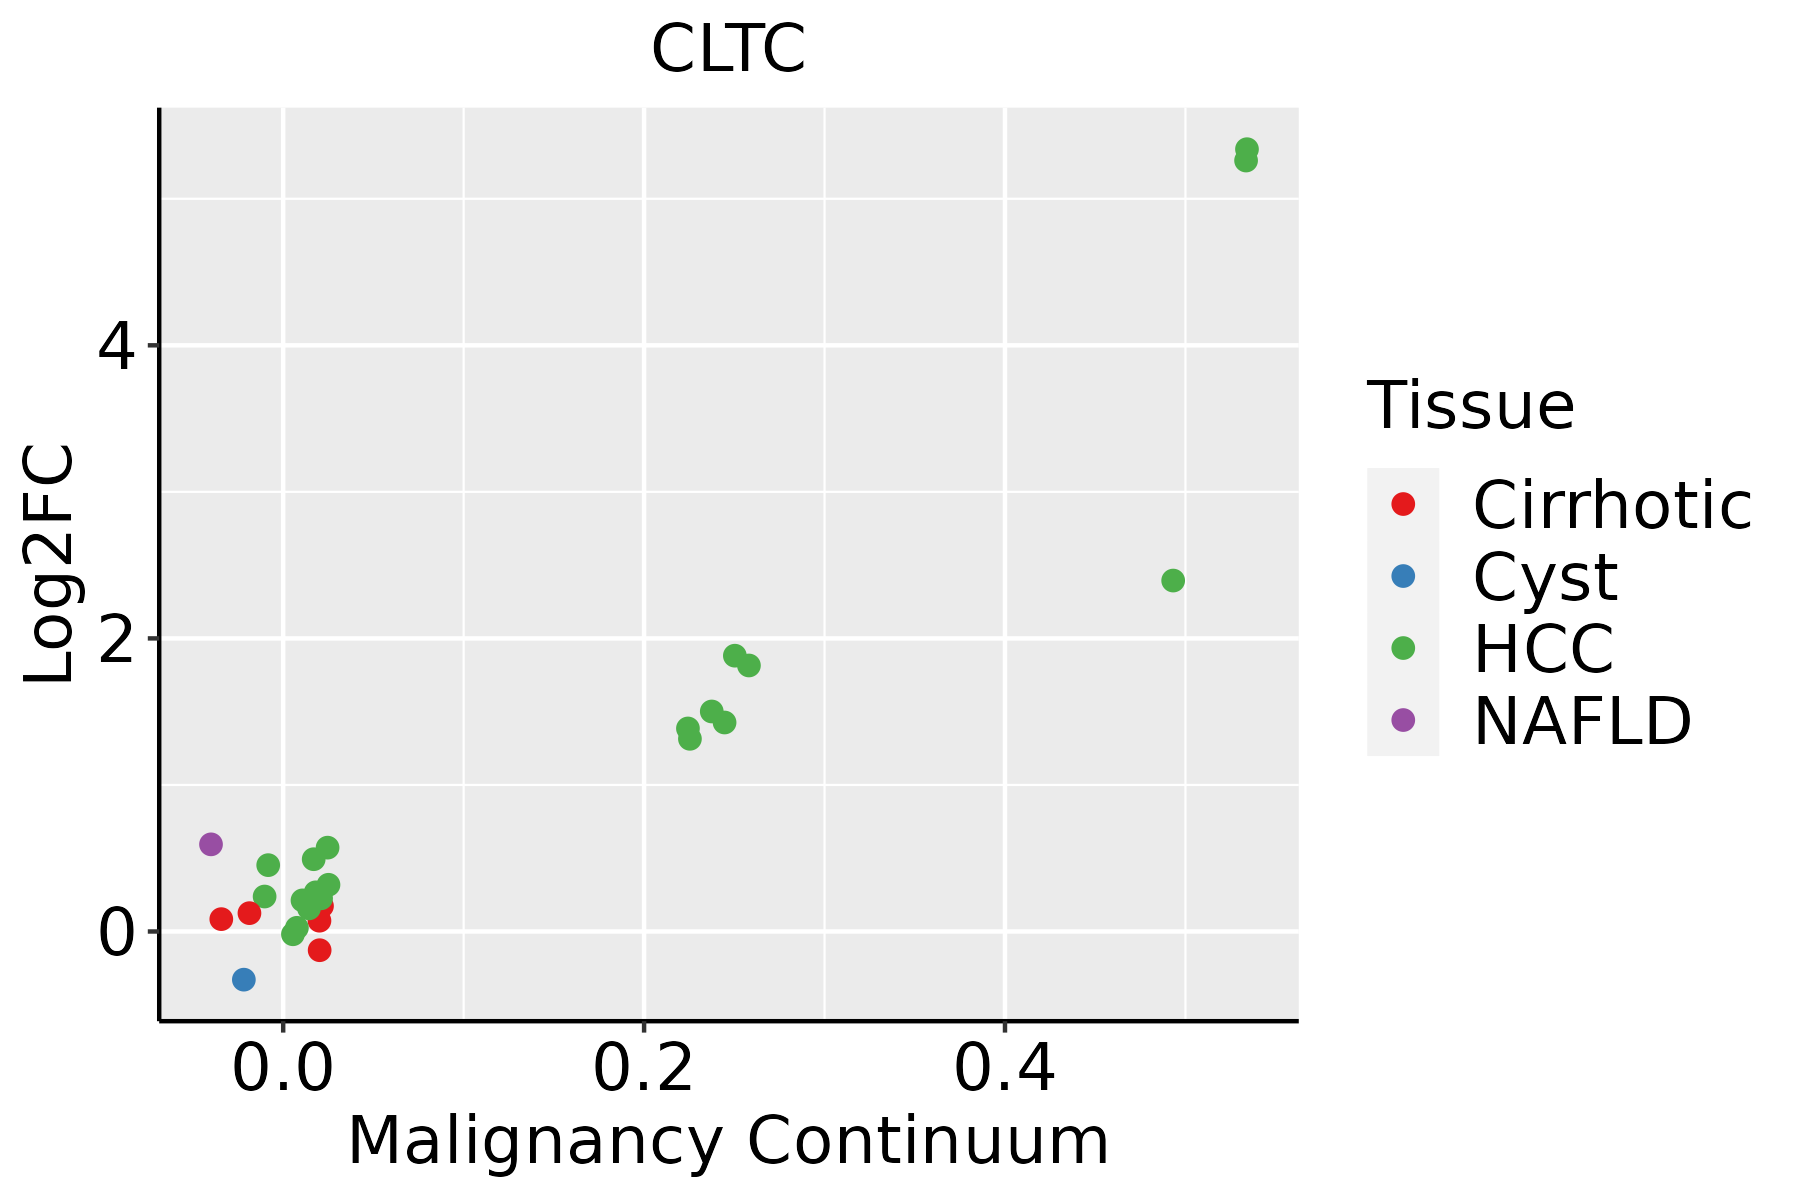 | HCC: Hepatocellular carcinoma |
| NAFLD: Non-alcoholic fatty liver disease |
| Oral Cavity |  | EOLP: Erosive Oral lichen planus |
| LP: leukoplakia |
| NEOLP: Non-erosive oral lichen planus |
| OSCC: Oral squamous cell carcinoma |
| Prostate |  | BPH: Benign Prostatic Hyperplasia |
| Skin | 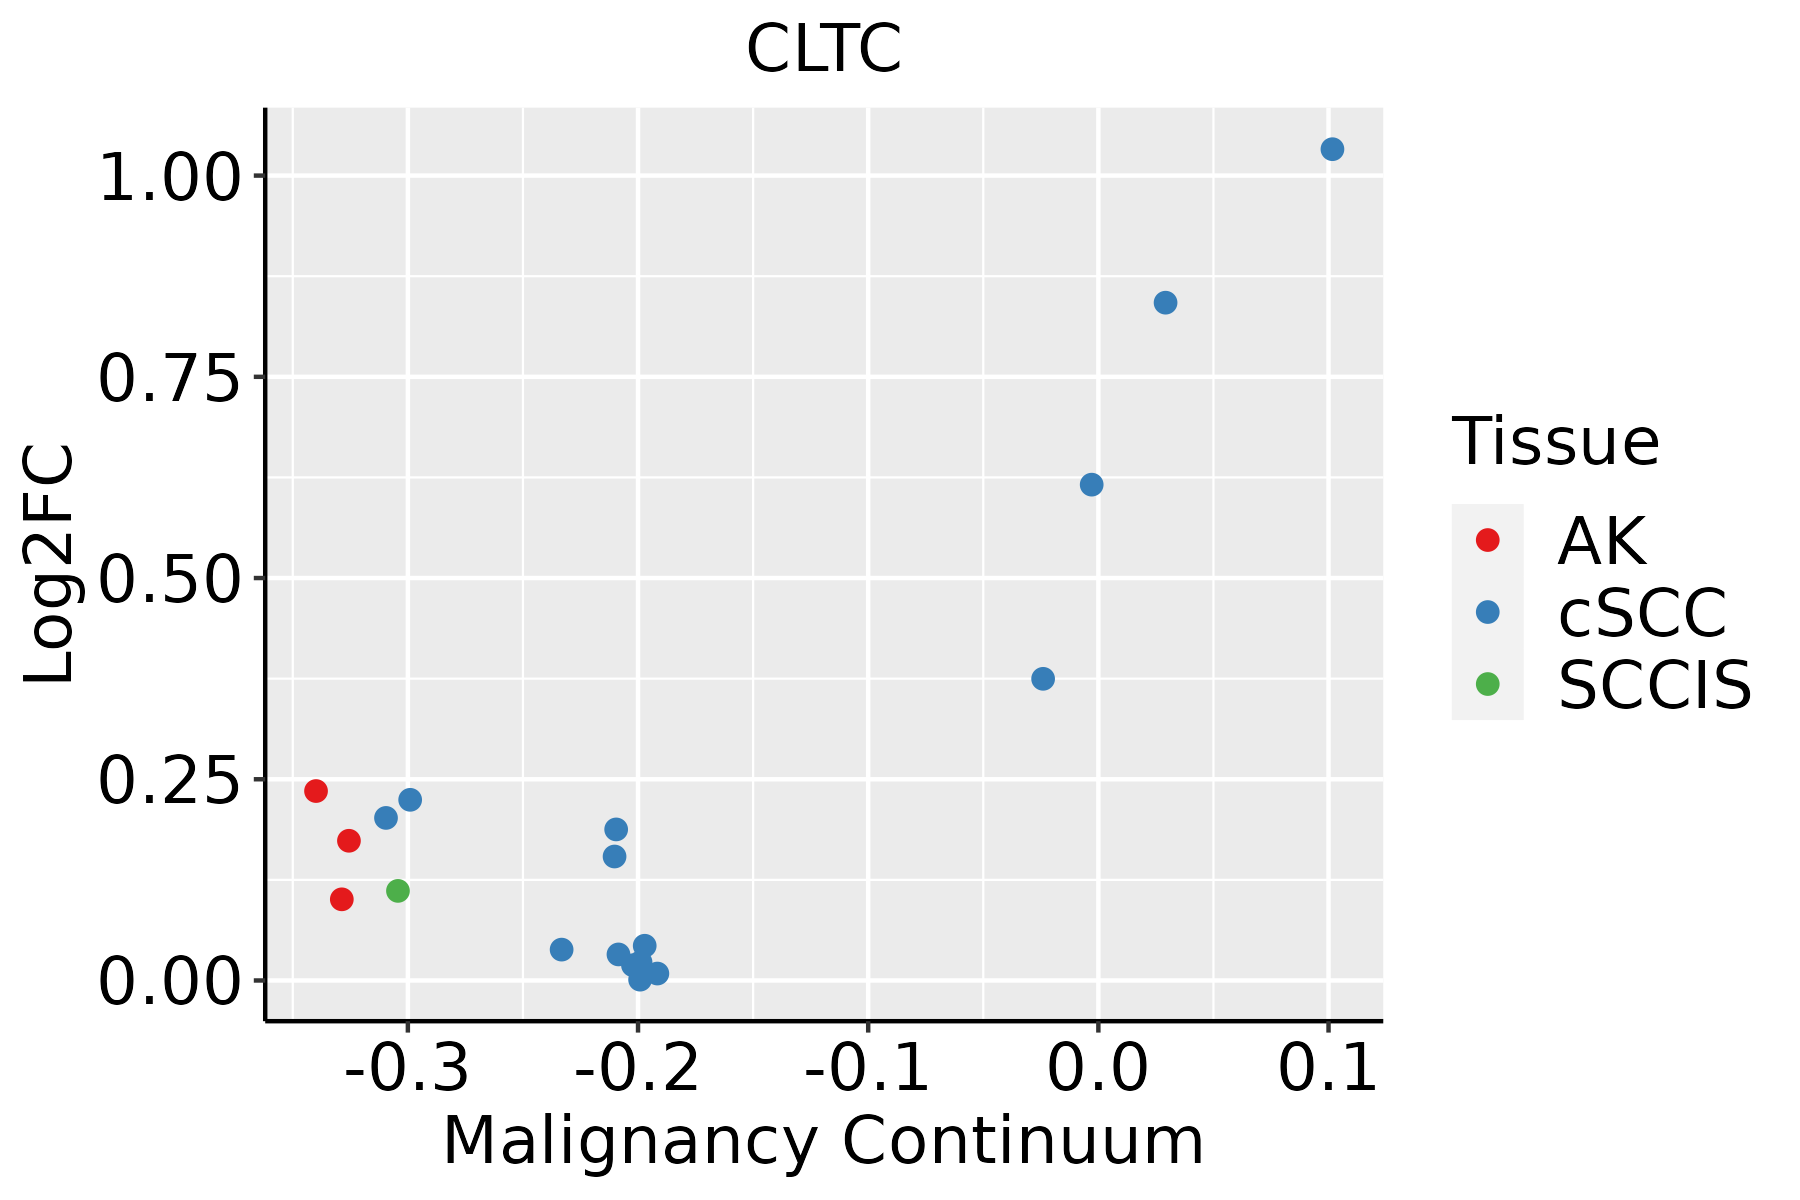 | AK: Actinic keratosis |
| cSCC: Cutaneous squamous cell carcinoma |
| SCCIS:squamous cell carcinoma in situ |
| Thyroid |  | ATC: Anaplastic thyroid cancer |
| HT: Hashimoto's thyroiditis |
| PTC: Papillary thyroid cancer |
| GO ID | Tissue | Disease Stage | Description | Gene Ratio | Bg Ratio | pvalue | p.adjust | Count |
| GO:00016496 | Breast | Precancer | osteoblast differentiation | 27/1080 | 229/18723 | 3.35e-04 | 4.73e-03 | 27 |
| GO:00068986 | Breast | Precancer | receptor-mediated endocytosis | 27/1080 | 244/18723 | 9.01e-04 | 1.03e-02 | 27 |
| GO:00316235 | Breast | Precancer | receptor internalization | 15/1080 | 113/18723 | 2.11e-03 | 2.00e-02 | 15 |
| GO:00482685 | Breast | Precancer | clathrin coat assembly | 5/1080 | 18/18723 | 2.88e-03 | 2.49e-02 | 5 |
| GO:19043757 | Breast | Precancer | regulation of protein localization to cell periphery | 15/1080 | 125/18723 | 5.58e-03 | 4.07e-02 | 15 |
| GO:00068263 | Breast | Precancer | iron ion transport | 9/1080 | 58/18723 | 5.67e-03 | 4.08e-02 | 9 |
| GO:19054757 | Breast | Precancer | regulation of protein localization to membrane | 19/1080 | 175/18723 | 5.98e-03 | 4.22e-02 | 19 |
| GO:19030767 | Breast | Precancer | regulation of protein localization to plasma membrane | 13/1080 | 104/18723 | 6.79e-03 | 4.65e-02 | 13 |
| GO:00000412 | Breast | Precancer | transition metal ion transport | 13/1080 | 105/18723 | 7.35e-03 | 4.89e-02 | 13 |
| GO:00015036 | Breast | Precancer | ossification | 36/1080 | 408/18723 | 7.53e-03 | 4.98e-02 | 36 |
| GO:000164912 | Breast | IDC | osteoblast differentiation | 35/1434 | 229/18723 | 6.64e-05 | 1.35e-03 | 35 |
| GO:190547513 | Breast | IDC | regulation of protein localization to membrane | 28/1434 | 175/18723 | 1.56e-04 | 2.71e-03 | 28 |
| GO:000689813 | Breast | IDC | receptor-mediated endocytosis | 35/1434 | 244/18723 | 2.38e-04 | 3.75e-03 | 35 |
| GO:000150311 | Breast | IDC | ossification | 50/1434 | 408/18723 | 6.51e-04 | 8.04e-03 | 50 |
| GO:003162311 | Breast | IDC | receptor internalization | 19/1434 | 113/18723 | 9.17e-04 | 1.05e-02 | 19 |
| GO:190307613 | Breast | IDC | regulation of protein localization to plasma membrane | 17/1434 | 104/18723 | 2.28e-03 | 2.09e-02 | 17 |
| GO:190437513 | Breast | IDC | regulation of protein localization to cell periphery | 19/1434 | 125/18723 | 3.06e-03 | 2.60e-02 | 19 |
| GO:00431126 | Breast | IDC | receptor metabolic process | 23/1434 | 166/18723 | 4.04e-03 | 3.25e-02 | 23 |
| GO:000682611 | Breast | IDC | iron ion transport | 11/1434 | 58/18723 | 4.10e-03 | 3.25e-02 | 11 |
| GO:00726599 | Breast | IDC | protein localization to plasma membrane | 34/1434 | 284/18723 | 6.33e-03 | 4.47e-02 | 34 |
| Pathway ID | Tissue | Disease Stage | Description | Gene Ratio | Bg Ratio | pvalue | p.adjust | qvalue | Count |
| hsa0501616 | Breast | Precancer | Huntington disease | 98/684 | 306/8465 | 2.85e-35 | 2.25e-33 | 1.72e-33 | 98 |
| hsa0510018 | Breast | Precancer | Bacterial invasion of epithelial cells | 16/684 | 77/8465 | 3.55e-04 | 2.80e-03 | 2.15e-03 | 16 |
| hsa0496110 | Breast | Precancer | Endocrine and other factor-regulated calcium reabsorption | 11/684 | 53/8465 | 2.92e-03 | 1.81e-02 | 1.39e-02 | 11 |
| hsa0501617 | Breast | Precancer | Huntington disease | 98/684 | 306/8465 | 2.85e-35 | 2.25e-33 | 1.72e-33 | 98 |
| hsa0510019 | Breast | Precancer | Bacterial invasion of epithelial cells | 16/684 | 77/8465 | 3.55e-04 | 2.80e-03 | 2.15e-03 | 16 |
| hsa0496111 | Breast | Precancer | Endocrine and other factor-regulated calcium reabsorption | 11/684 | 53/8465 | 2.92e-03 | 1.81e-02 | 1.39e-02 | 11 |
| hsa0501623 | Breast | IDC | Huntington disease | 103/867 | 306/8465 | 5.14e-30 | 4.17e-28 | 3.12e-28 | 103 |
| hsa0510024 | Breast | IDC | Bacterial invasion of epithelial cells | 17/867 | 77/8465 | 1.69e-03 | 1.19e-02 | 8.93e-03 | 17 |
| hsa0496121 | Breast | IDC | Endocrine and other factor-regulated calcium reabsorption | 12/867 | 53/8465 | 6.29e-03 | 3.30e-02 | 2.47e-02 | 12 |
| hsa0501633 | Breast | IDC | Huntington disease | 103/867 | 306/8465 | 5.14e-30 | 4.17e-28 | 3.12e-28 | 103 |
| hsa0510034 | Breast | IDC | Bacterial invasion of epithelial cells | 17/867 | 77/8465 | 1.69e-03 | 1.19e-02 | 8.93e-03 | 17 |
| hsa0496131 | Breast | IDC | Endocrine and other factor-regulated calcium reabsorption | 12/867 | 53/8465 | 6.29e-03 | 3.30e-02 | 2.47e-02 | 12 |
| hsa0501643 | Breast | DCIS | Huntington disease | 101/846 | 306/8465 | 1.54e-29 | 1.24e-27 | 9.13e-28 | 101 |
| hsa0510042 | Breast | DCIS | Bacterial invasion of epithelial cells | 16/846 | 77/8465 | 3.41e-03 | 1.98e-02 | 1.46e-02 | 16 |
| hsa0496141 | Breast | DCIS | Endocrine and other factor-regulated calcium reabsorption | 12/846 | 53/8465 | 5.17e-03 | 2.69e-02 | 1.98e-02 | 12 |
| hsa0414416 | Breast | DCIS | Endocytosis | 37/846 | 251/8465 | 9.92e-03 | 4.40e-02 | 3.24e-02 | 37 |
| hsa0501653 | Breast | DCIS | Huntington disease | 101/846 | 306/8465 | 1.54e-29 | 1.24e-27 | 9.13e-28 | 101 |
| hsa0510052 | Breast | DCIS | Bacterial invasion of epithelial cells | 16/846 | 77/8465 | 3.41e-03 | 1.98e-02 | 1.46e-02 | 16 |
| hsa0496151 | Breast | DCIS | Endocrine and other factor-regulated calcium reabsorption | 12/846 | 53/8465 | 5.17e-03 | 2.69e-02 | 1.98e-02 | 12 |
| hsa0414417 | Breast | DCIS | Endocytosis | 37/846 | 251/8465 | 9.92e-03 | 4.40e-02 | 3.24e-02 | 37 |
| Hugo Symbol | Variant Class | Variant Classification | dbSNP RS | HGVSc | HGVSp | HGVSp Short | SWISSPROT | BIOTYPE | SIFT | PolyPhen | Tumor Sample Barcode | Tissue | Histology | Sex | Age | Stage | Therapy Types | Drugs | Outcome |
| CLTC | SNV | Missense_Mutation | novel | c.4405N>A | p.Glu1469Lys | p.E1469K | | protein_coding | deleterious(0.02) | possibly_damaging(0.72) | TCGA-3C-AALI-01 | Breast | breast invasive carcinoma | Female | <65 | I/II | Unspecific | Poly E | Complete Response |
| CLTC | SNV | Missense_Mutation | novel | c.1978N>T | p.Gly660Cys | p.G660C | | protein_coding | deleterious(0) | benign(0.307) | TCGA-A2-A25A-01 | Breast | breast invasive carcinoma | Female | <65 | I/II | Unspecific | Cytoxan | SD |
| CLTC | SNV | Missense_Mutation | | c.4126N>C | p.Asp1376His | p.D1376H | | protein_coding | deleterious(0) | probably_damaging(1) | TCGA-AC-A23H-01 | Breast | breast invasive carcinoma | Female | >=65 | I/II | Unknown | Unknown | PD |
| CLTC | SNV | Missense_Mutation | | c.3052N>C | p.Asp1018His | p.D1018H | | protein_coding | tolerated(0.3) | possibly_damaging(0.771) | TCGA-AN-A0XW-01 | Breast | breast invasive carcinoma | Female | <65 | III/IV | Unknown | Unknown | SD |
| CLTC | SNV | Missense_Mutation | | c.3622N>A | p.Arg1208Ser | p.R1208S | | protein_coding | deleterious(0) | probably_damaging(0.999) | TCGA-AR-A1AO-01 | Breast | breast invasive carcinoma | Female | <65 | I/II | Chemotherapy | doxorubicin | SD |
| CLTC | SNV | Missense_Mutation | novel | c.1195N>A | p.Pro399Thr | p.P399T | | protein_coding | tolerated(0.06) | benign(0.023) | TCGA-BH-A0BZ-01 | Breast | breast invasive carcinoma | Female | <65 | III/IV | Chemotherapy | doxorubicin | CR |
| CLTC | SNV | Missense_Mutation | | c.22C>T | p.Arg8Cys | p.R8C | | protein_coding | deleterious(0.01) | probably_damaging(0.944) | TCGA-C8-A274-01 | Breast | breast invasive carcinoma | Female | <65 | I/II | Hormone Therapy | tamoxiphen | SD |
| CLTC | SNV | Missense_Mutation | novel | c.4462N>G | p.Ile1488Val | p.I1488V | | protein_coding | tolerated(0.49) | benign(0.045) | TCGA-E9-A5UP-01 | Breast | breast invasive carcinoma | Female | <65 | I/II | Hormone Therapy | tamoxiphen | SD |
| CLTC | SNV | Missense_Mutation | | c.658N>C | p.Phe220Leu | p.F220L | | protein_coding | tolerated(0.13) | probably_damaging(0.995) | TCGA-GM-A2DN-01 | Breast | breast invasive carcinoma | Female | <65 | I/II | Chemotherapy | taxol | CR |
| CLTC | insertion | In_Frame_Ins | novel | c.2282_2283insTGCTCAACTGTGTGAAAAGGCTGGCCTACT | p.Glu761delinsAspAlaGlnLeuCysGluLysAlaGlyLeuLeu | p.E761delinsDAQLCEKAGLL | | protein_coding | | | TCGA-AO-A0J9-01 | Breast | breast invasive carcinoma | Female | <65 | III/IV | Chemotherapy | cyclophosphamide | PD |


