
|
|||||
|
 | |
| |
| |
| |
| |
| |
|
Gene: CLTA |
Gene summary for CLTA |
| Gene information | Species | Human | Gene symbol | CLTA | Gene ID | 1211 |
| Gene name | clathrin light chain A | |
| Gene Alias | LCA | |
| Cytomap | 9p13.3 | |
| Gene Type | protein-coding | GO ID | GO:0006810 | UniProtAcc | P09496 |
Top |
Malignant transformation analysis |
| Identification of the aberrant gene expression in precancerous and cancerous lesions by comparing the gene expression of stem-like cells in diseased tissues with normal stem cells |
| Entrez ID | Symbol | Replicates | Species | Organ | Tissue | Adj P-value | Log2FC | Malignancy |
| 1211 | CLTA | GSM4909282 | Human | Breast | IDC | 2.49e-16 | 5.46e-01 | -0.0288 |
| 1211 | CLTA | GSM4909285 | Human | Breast | IDC | 1.87e-22 | 5.88e-01 | 0.21 |
| 1211 | CLTA | GSM4909286 | Human | Breast | IDC | 4.17e-06 | -2.47e-02 | 0.1081 |
| 1211 | CLTA | GSM4909288 | Human | Breast | IDC | 1.57e-04 | 1.89e-01 | 0.0988 |
| 1211 | CLTA | GSM4909290 | Human | Breast | IDC | 4.45e-16 | 4.73e-01 | 0.2096 |
| 1211 | CLTA | GSM4909294 | Human | Breast | IDC | 3.46e-06 | 9.97e-02 | 0.2022 |
| 1211 | CLTA | GSM4909296 | Human | Breast | IDC | 1.91e-07 | 3.38e-02 | 0.1524 |
| 1211 | CLTA | GSM4909297 | Human | Breast | IDC | 1.37e-22 | -2.32e-01 | 0.1517 |
| 1211 | CLTA | GSM4909298 | Human | Breast | IDC | 8.29e-03 | -8.87e-02 | 0.1551 |
| 1211 | CLTA | GSM4909308 | Human | Breast | IDC | 1.99e-02 | 2.26e-01 | 0.158 |
| 1211 | CLTA | GSM4909309 | Human | Breast | IDC | 1.47e-04 | 1.46e-01 | 0.0483 |
| 1211 | CLTA | GSM4909311 | Human | Breast | IDC | 2.22e-51 | -3.06e-01 | 0.1534 |
| 1211 | CLTA | GSM4909312 | Human | Breast | IDC | 5.18e-13 | -1.48e-01 | 0.1552 |
| 1211 | CLTA | GSM4909313 | Human | Breast | IDC | 7.68e-04 | 1.65e-02 | 0.0391 |
| 1211 | CLTA | GSM4909318 | Human | Breast | IDC | 8.99e-05 | 2.93e-01 | 0.2031 |
| 1211 | CLTA | GSM4909319 | Human | Breast | IDC | 4.94e-58 | -3.55e-01 | 0.1563 |
| 1211 | CLTA | GSM4909320 | Human | Breast | IDC | 3.40e-06 | -3.80e-01 | 0.1575 |
| 1211 | CLTA | GSM4909321 | Human | Breast | IDC | 7.65e-16 | -1.91e-01 | 0.1559 |
| 1211 | CLTA | brca1 | Human | Breast | Precancer | 5.13e-09 | 4.16e-01 | -0.0338 |
| 1211 | CLTA | brca2 | Human | Breast | Precancer | 3.77e-03 | 2.51e-01 | -0.024 |
| Page: 1 2 3 4 5 6 7 8 9 10 11 12 13 |
| Tissue | Expression Dynamics | Abbreviation |
| Breast | 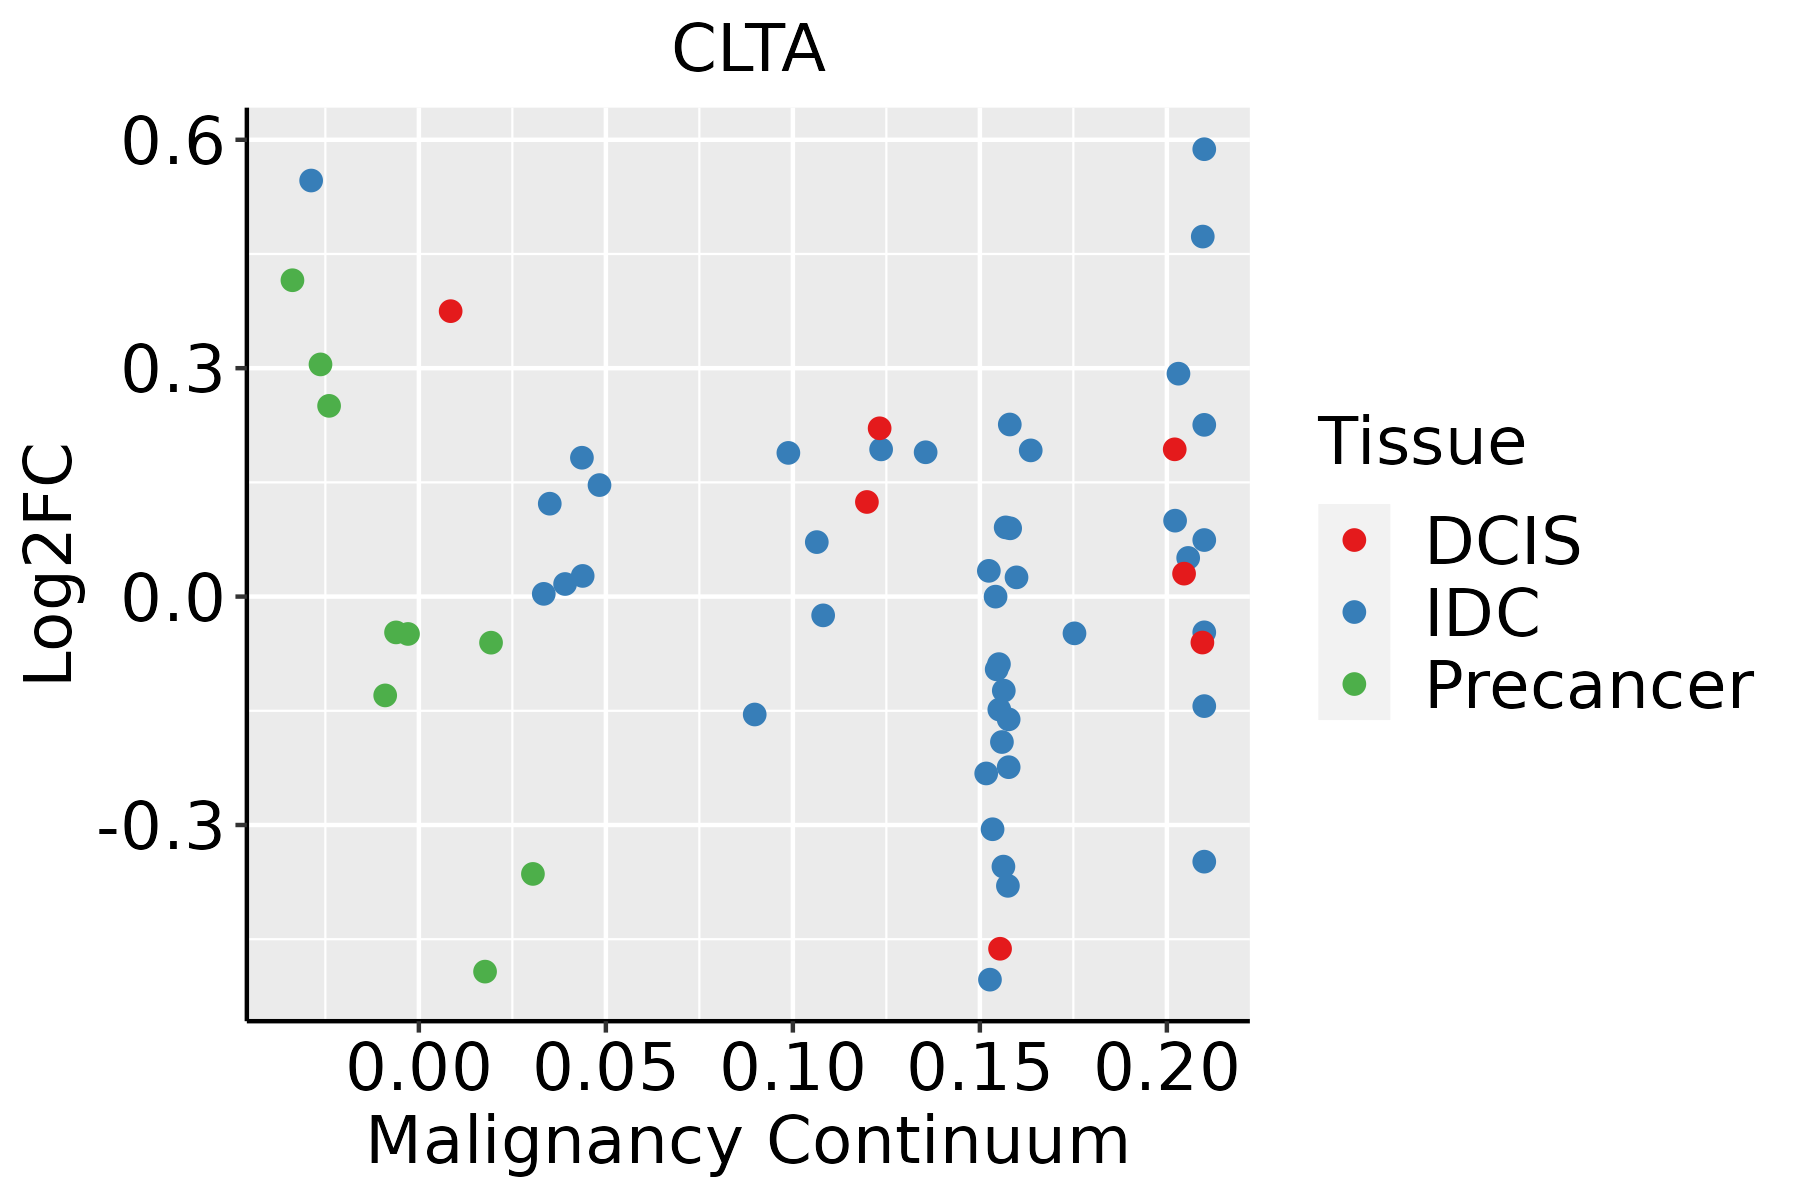 | IDC: Invasive ductal carcinoma |
| DCIS: Ductal carcinoma in situ | ||
| Precancer(BRCA1-mut): Precancerous lesion from BRCA1 mutation carriers | ||
| Cervix | 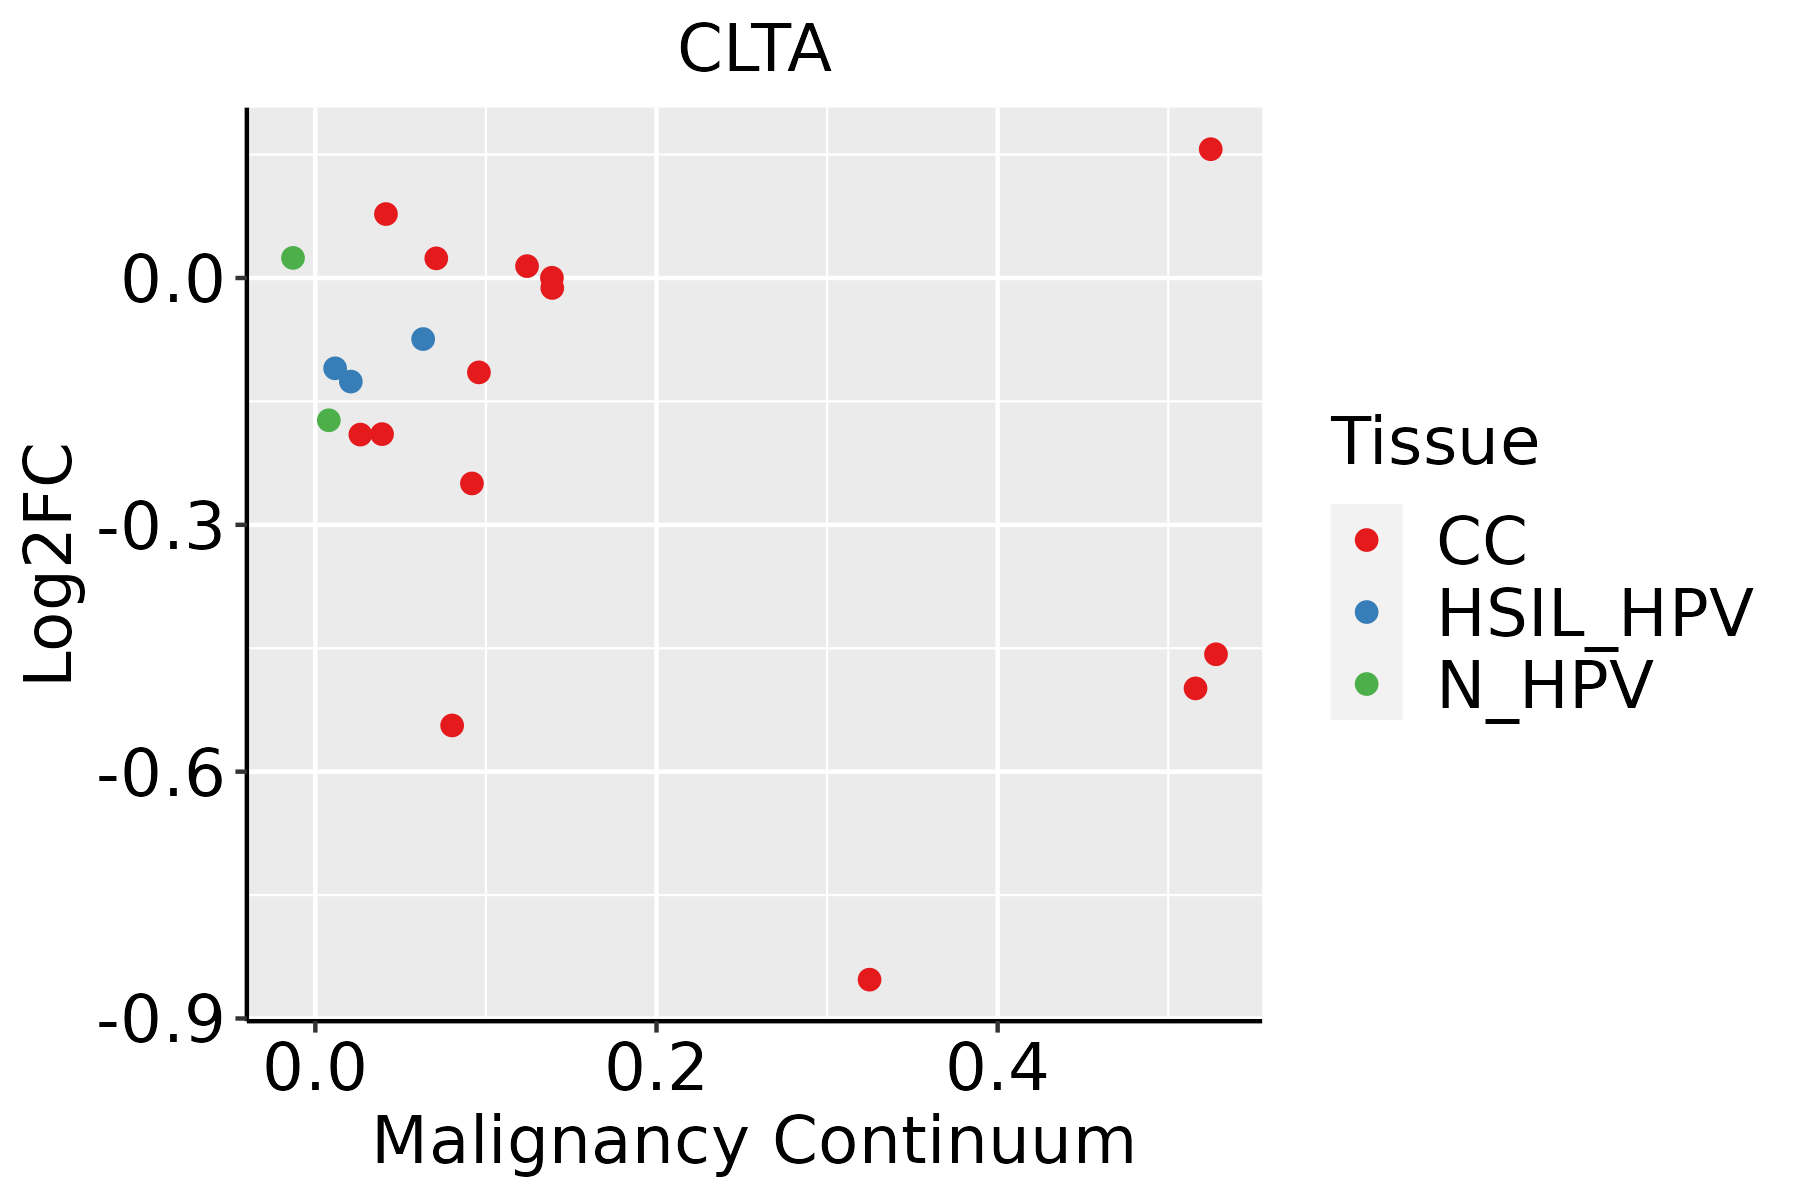 | CC: Cervix cancer |
| HSIL_HPV: HPV-infected high-grade squamous intraepithelial lesions | ||
| N_HPV: HPV-infected normal cervix | ||
| Colorectum (GSE201348) |  | FAP: Familial adenomatous polyposis |
| CRC: Colorectal cancer | ||
| Colorectum (HTA11) |  | AD: Adenomas |
| SER: Sessile serrated lesions | ||
| MSI-H: Microsatellite-high colorectal cancer | ||
| MSS: Microsatellite stable colorectal cancer | ||
| Endometrium | 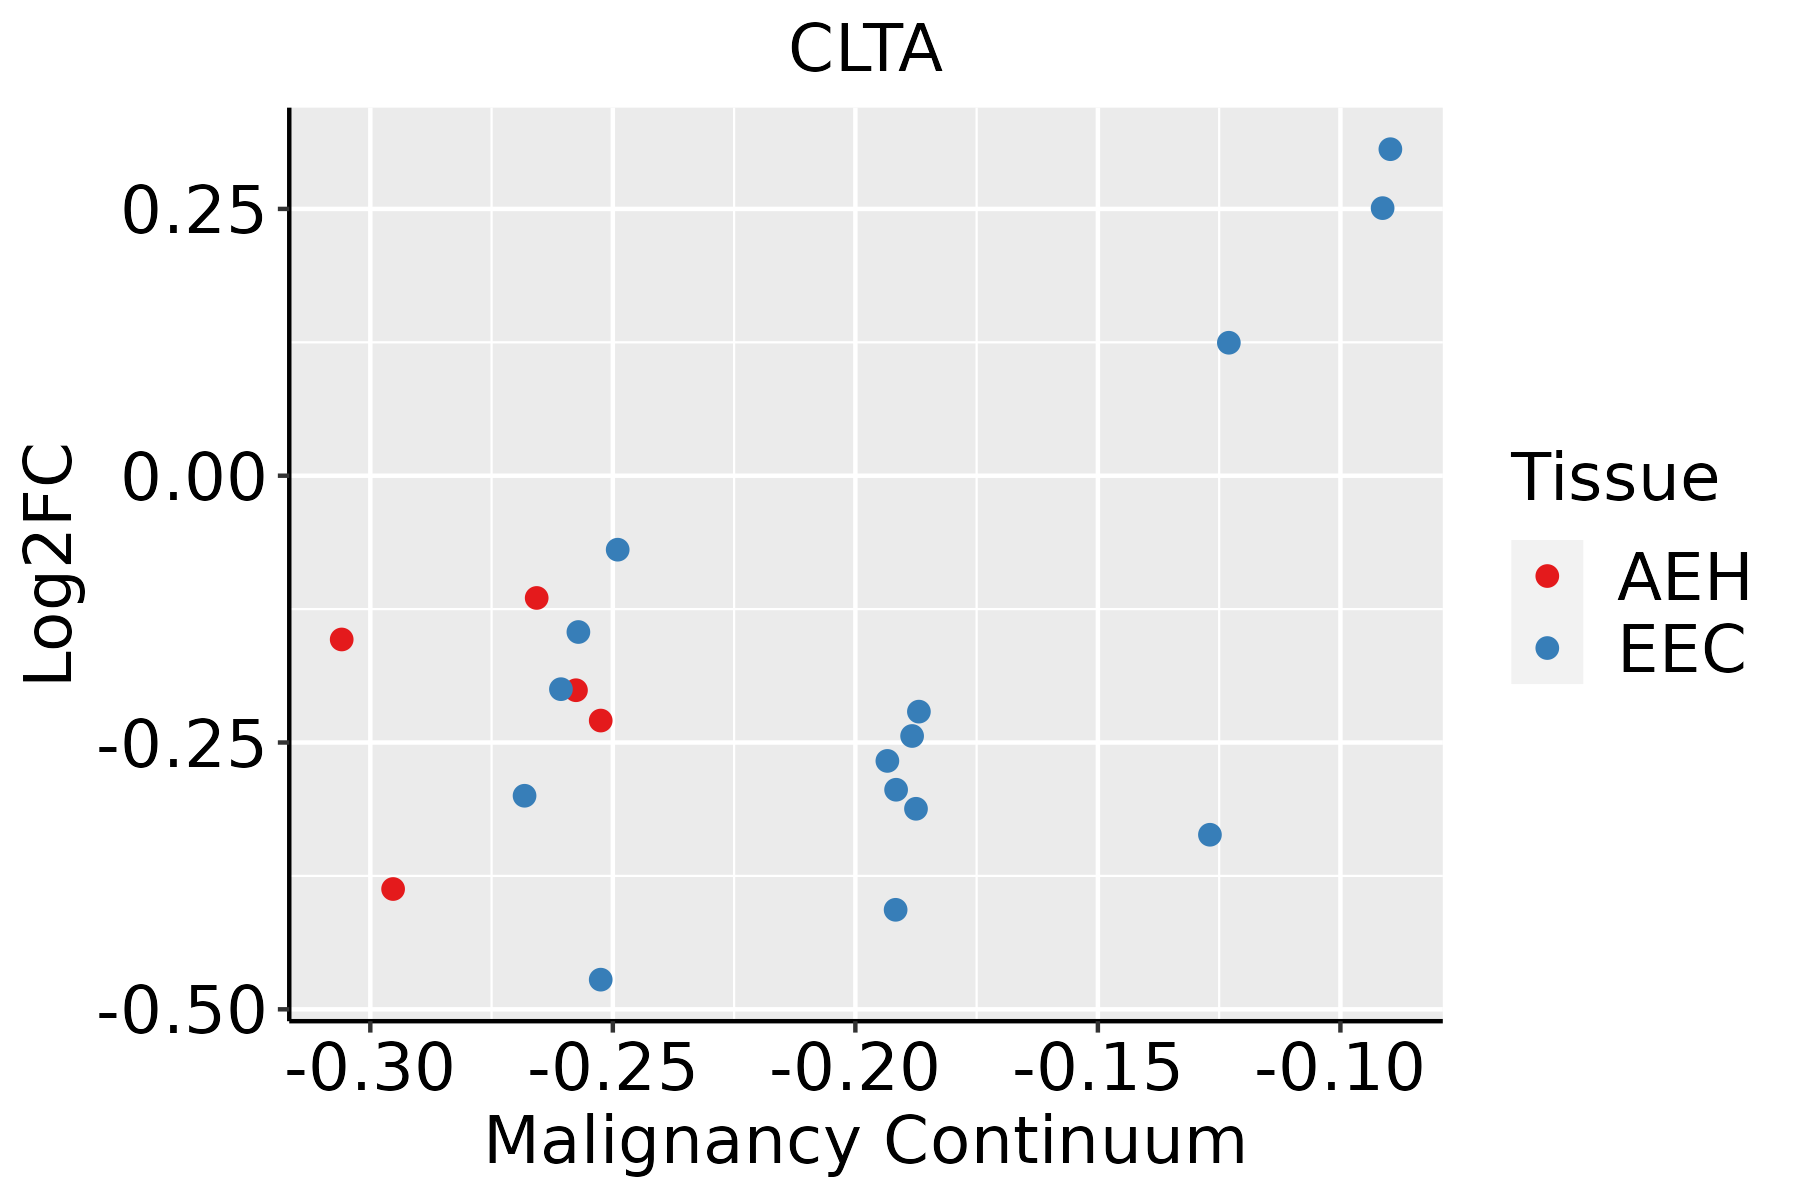 | AEH: Atypical endometrial hyperplasia |
| EEC: Endometrioid Cancer | ||
| Esophagus | 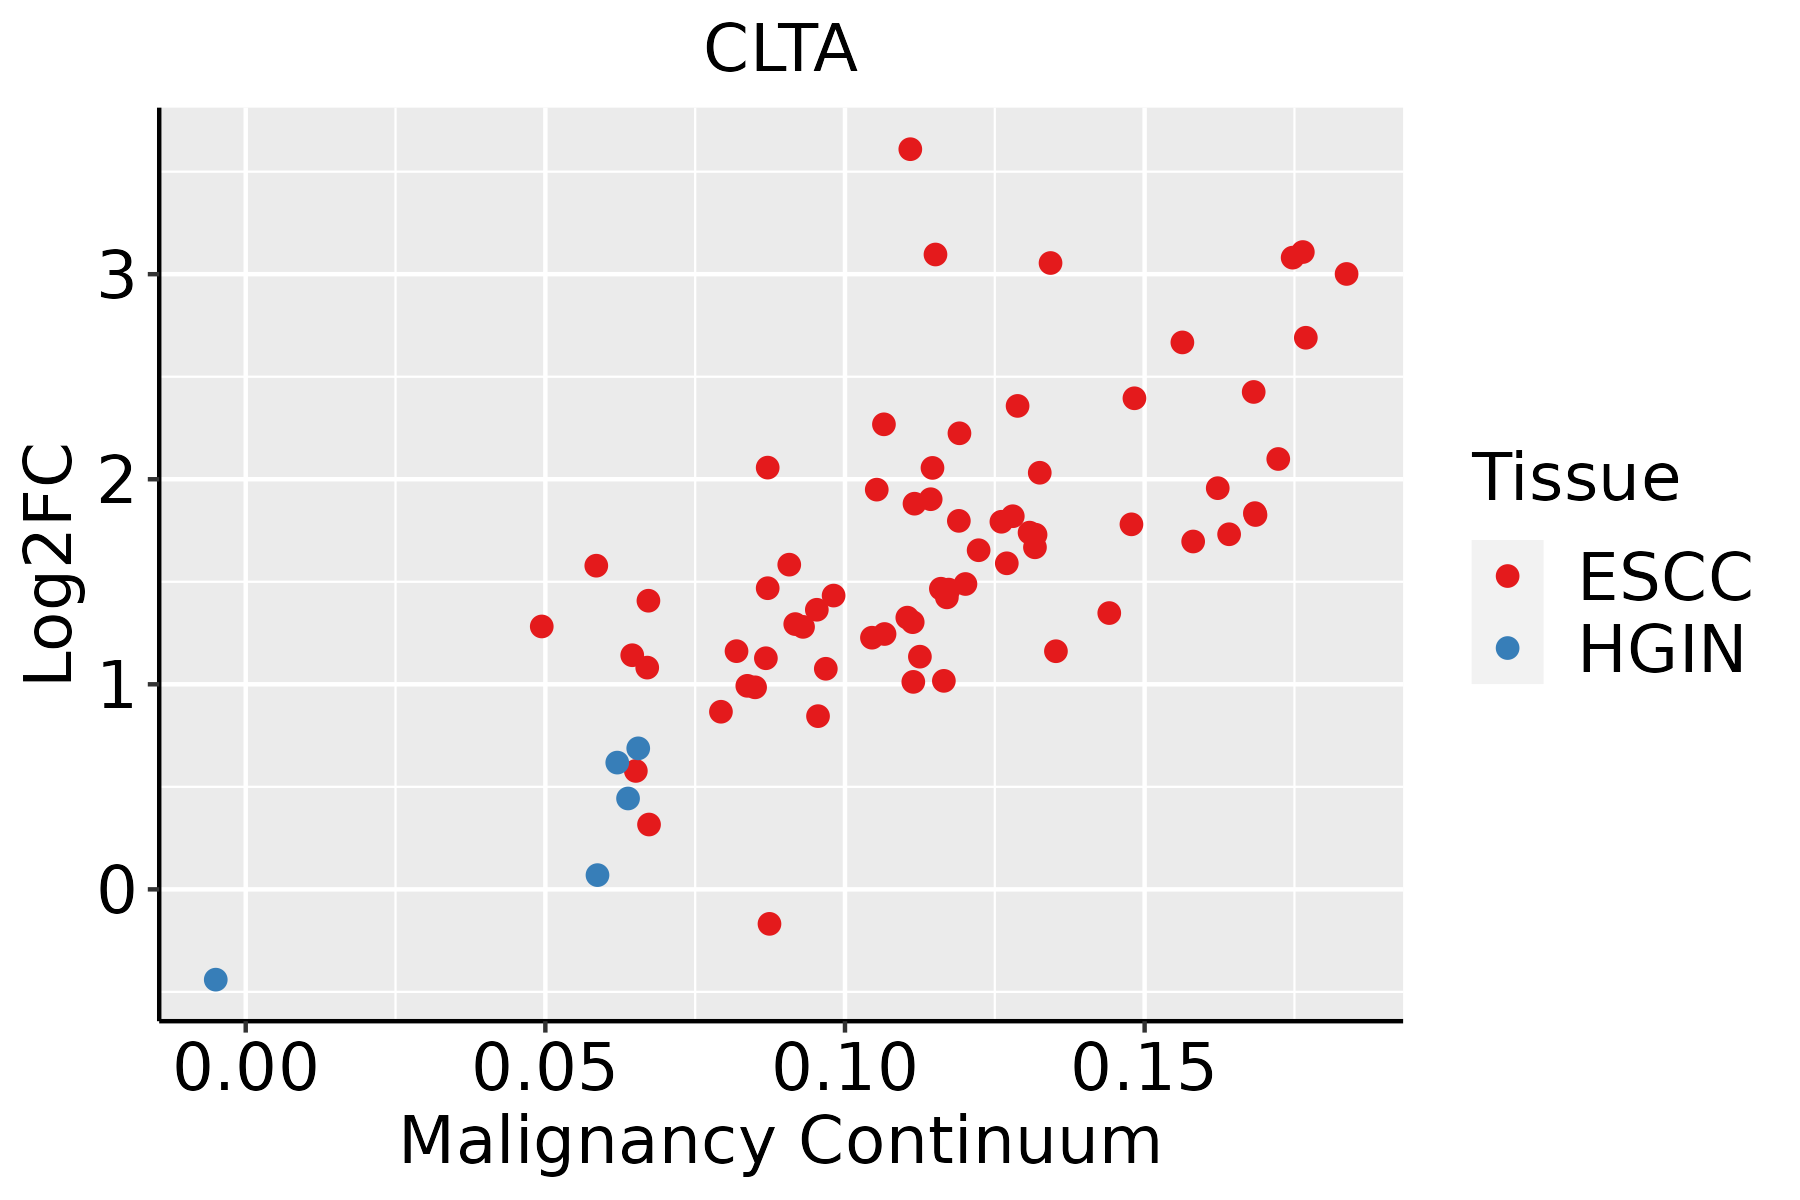 | ESCC: Esophageal squamous cell carcinoma |
| HGIN: High-grade intraepithelial neoplasias | ||
| LGIN: Low-grade intraepithelial neoplasias | ||
| Liver | 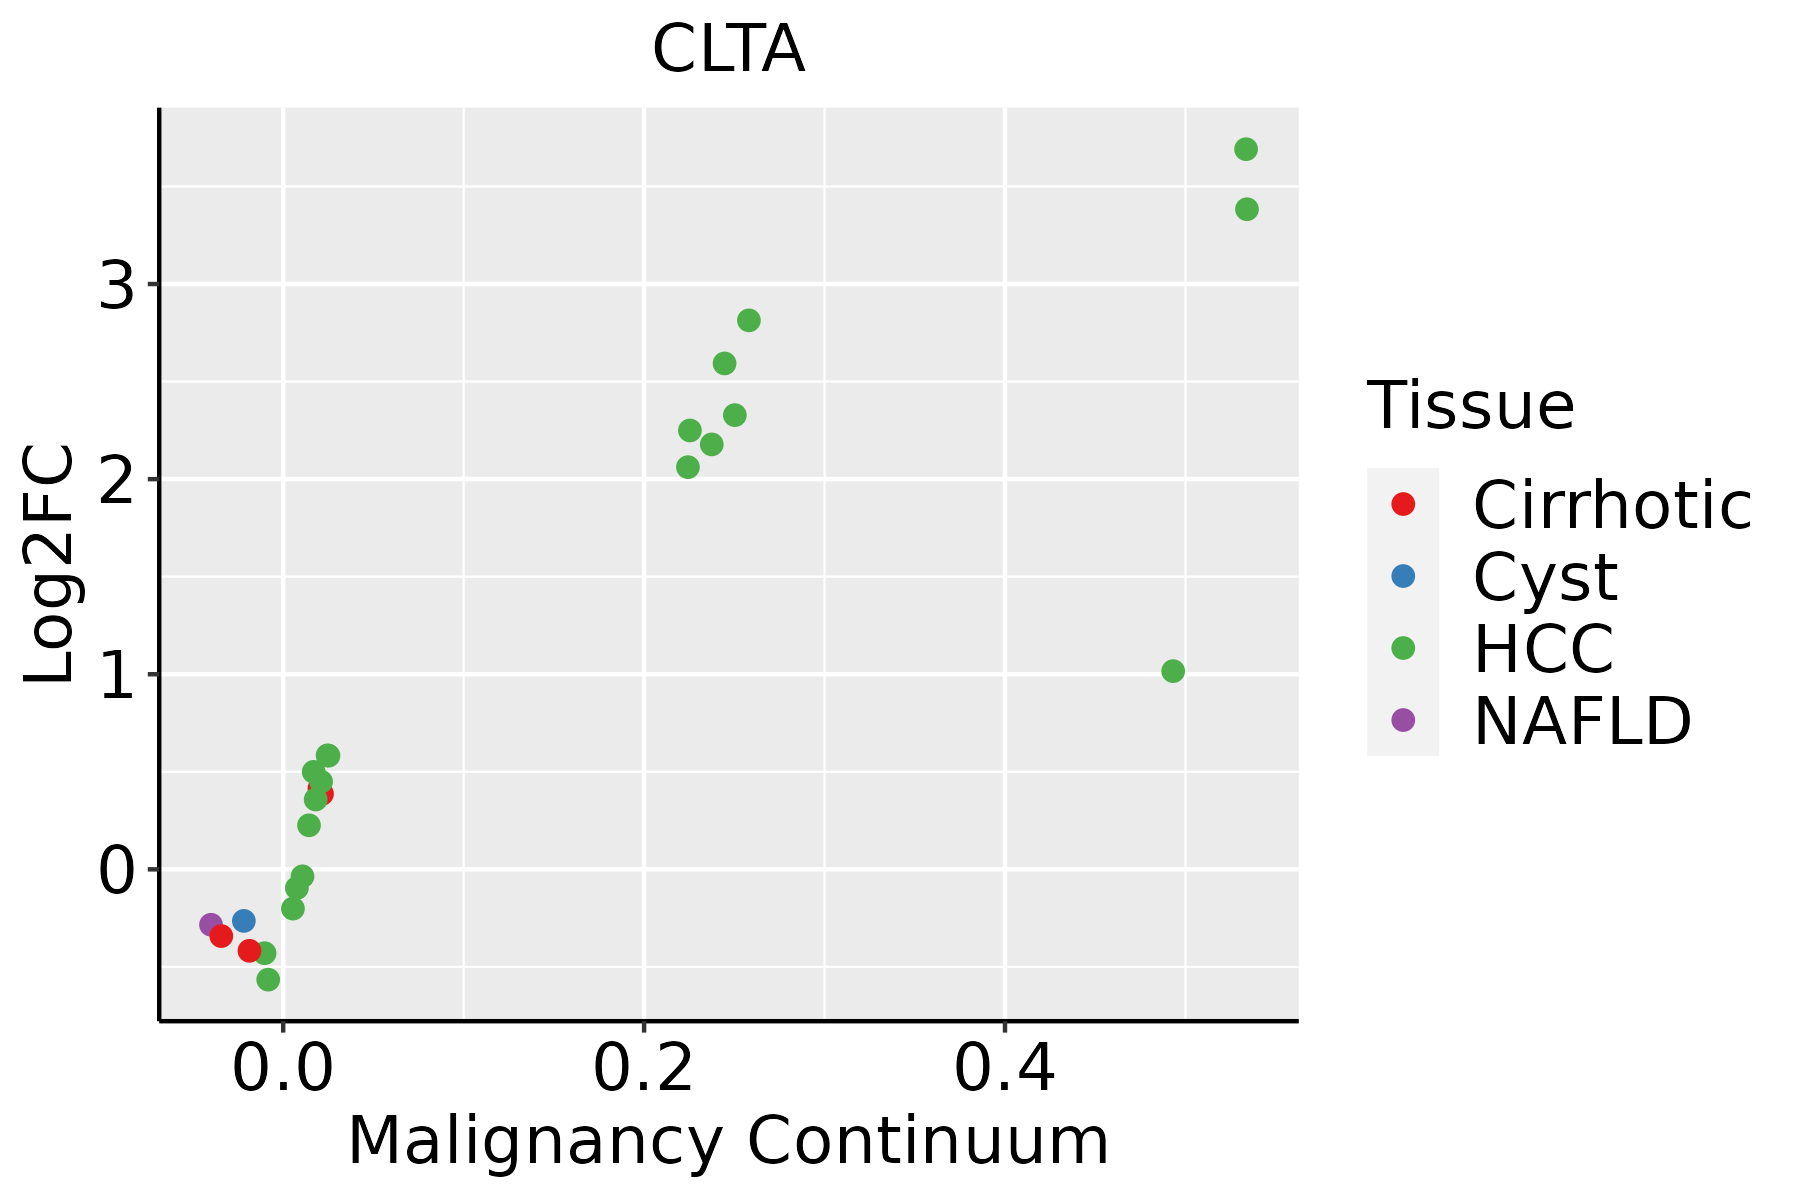 | HCC: Hepatocellular carcinoma |
| NAFLD: Non-alcoholic fatty liver disease | ||
| Oral Cavity | 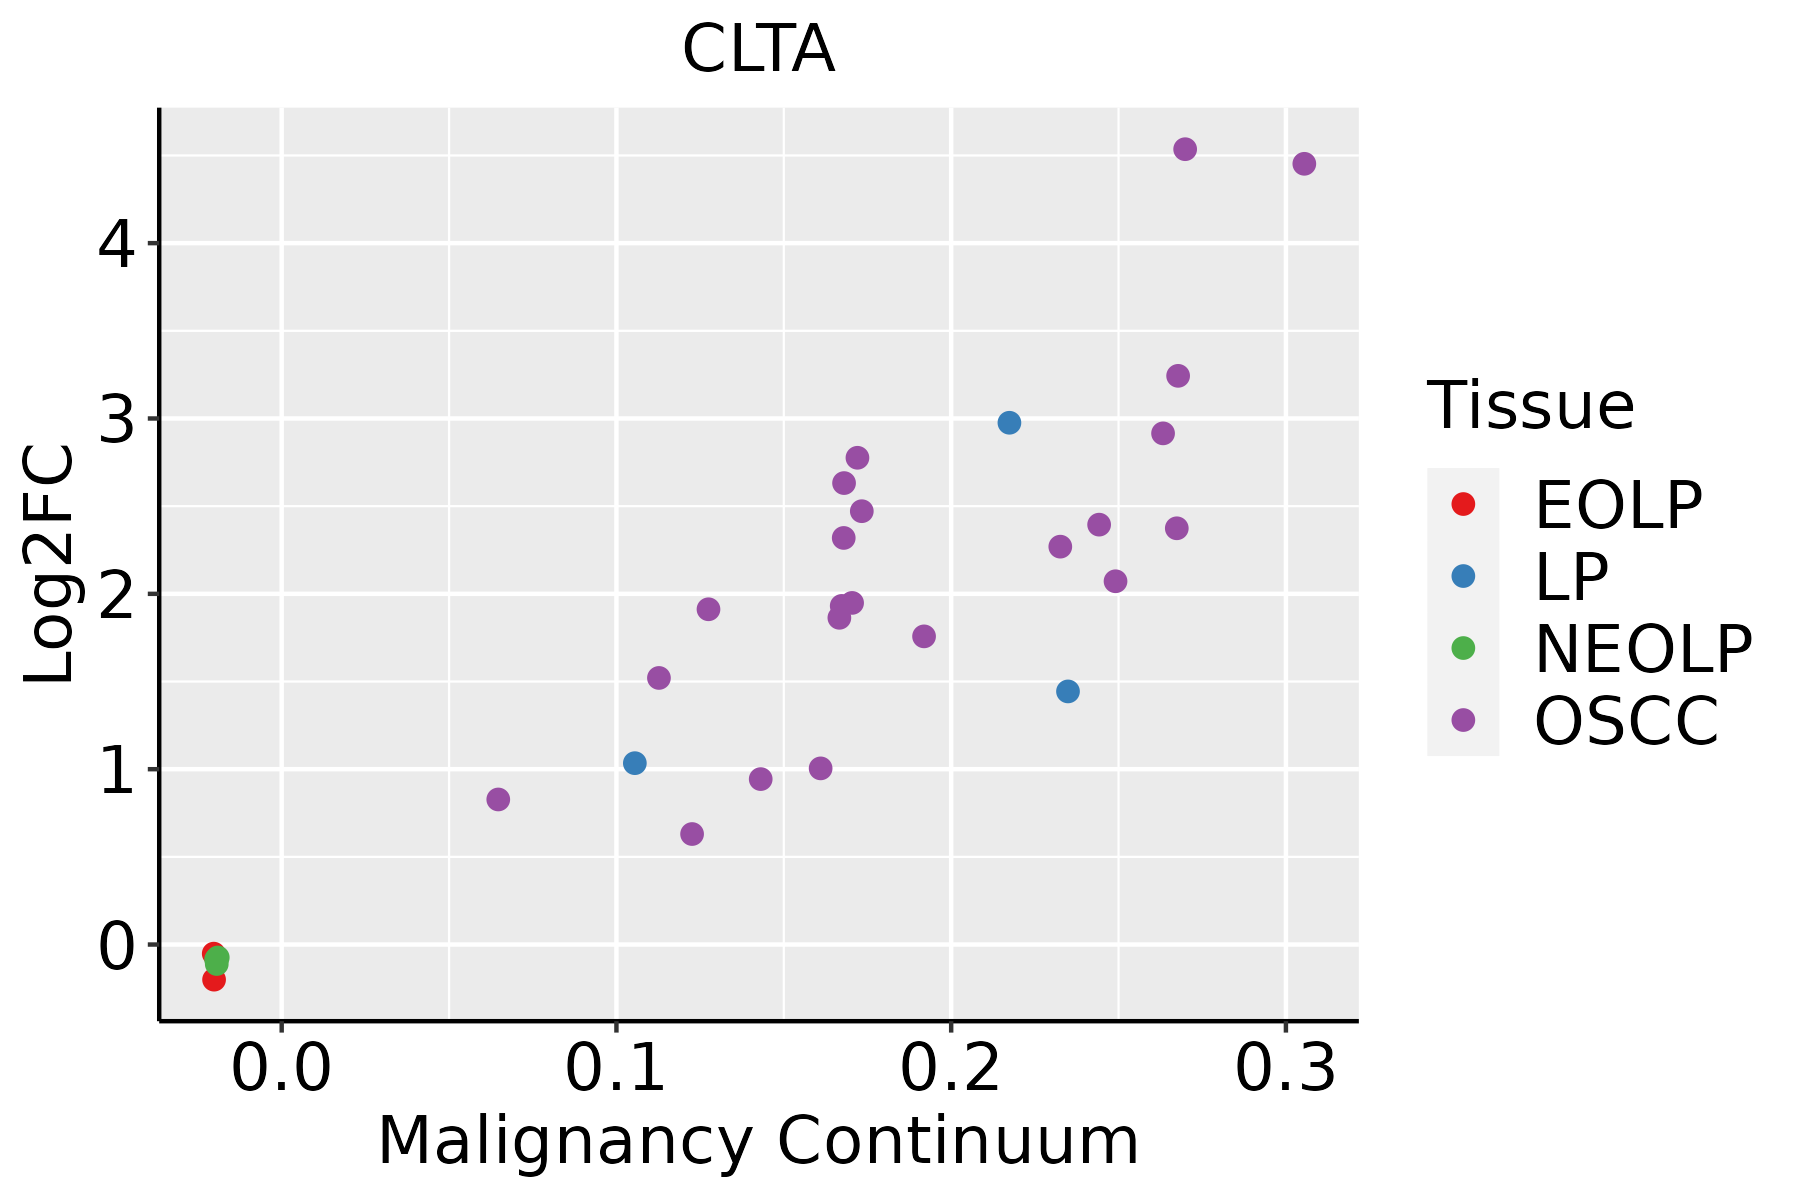 | EOLP: Erosive Oral lichen planus |
| LP: leukoplakia | ||
| NEOLP: Non-erosive oral lichen planus | ||
| OSCC: Oral squamous cell carcinoma | ||
| Prostate | 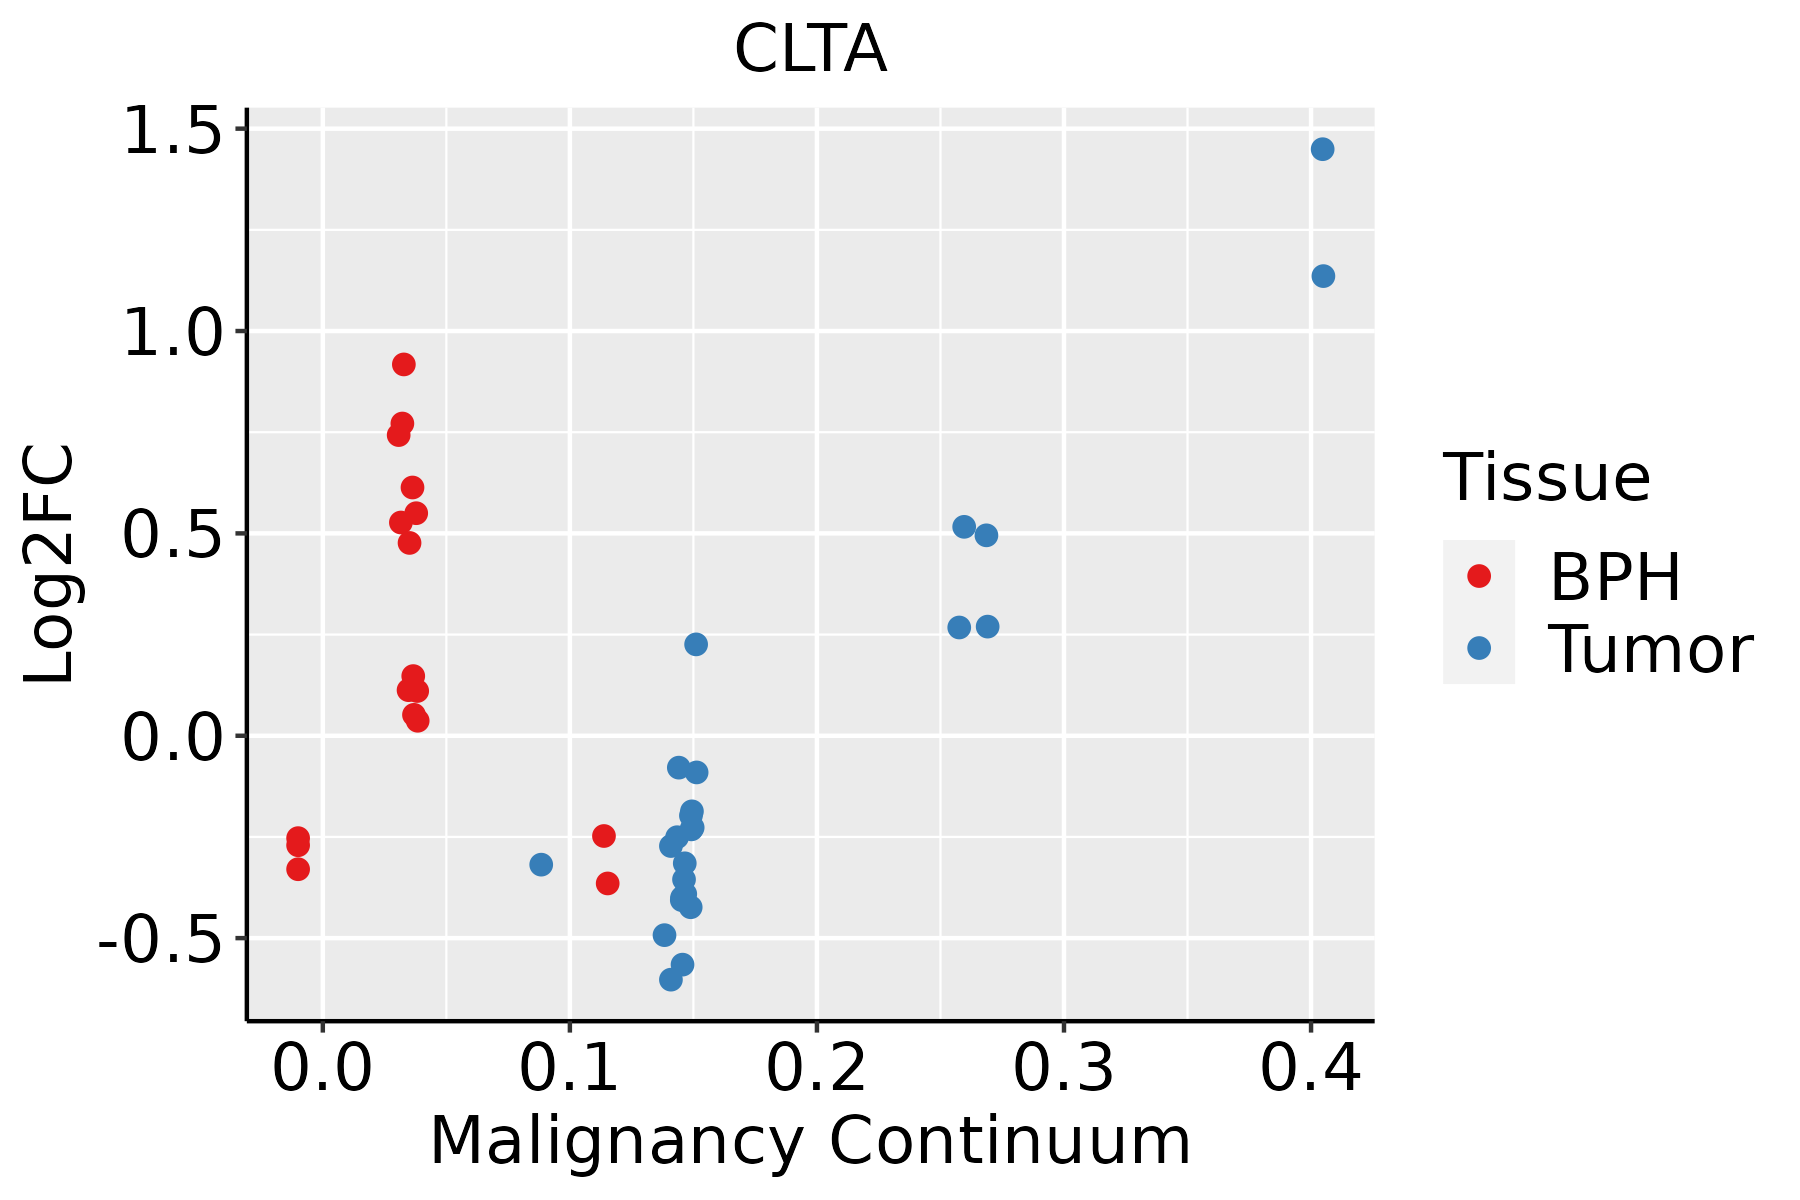 | BPH: Benign Prostatic Hyperplasia |
| Skin | 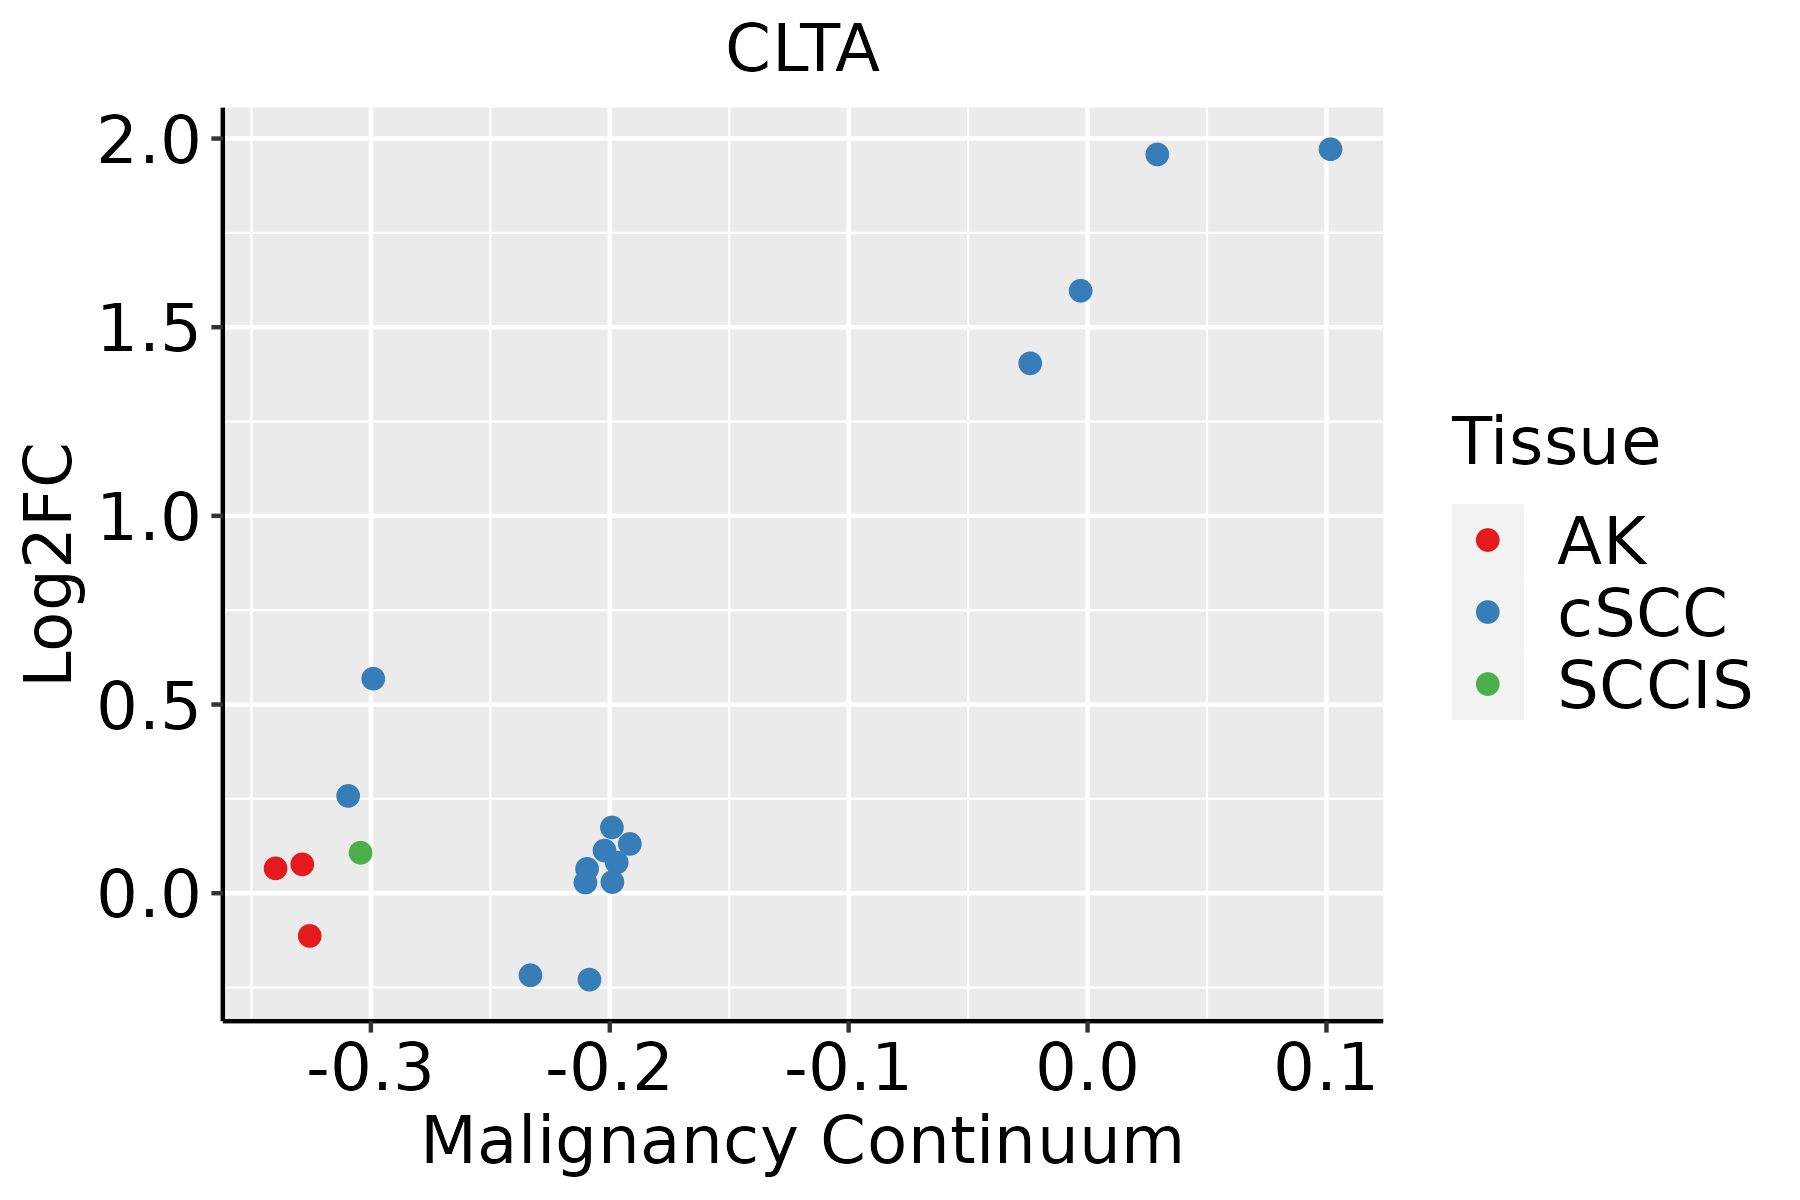 | AK: Actinic keratosis |
| cSCC: Cutaneous squamous cell carcinoma | ||
| SCCIS:squamous cell carcinoma in situ | ||
| Thyroid | 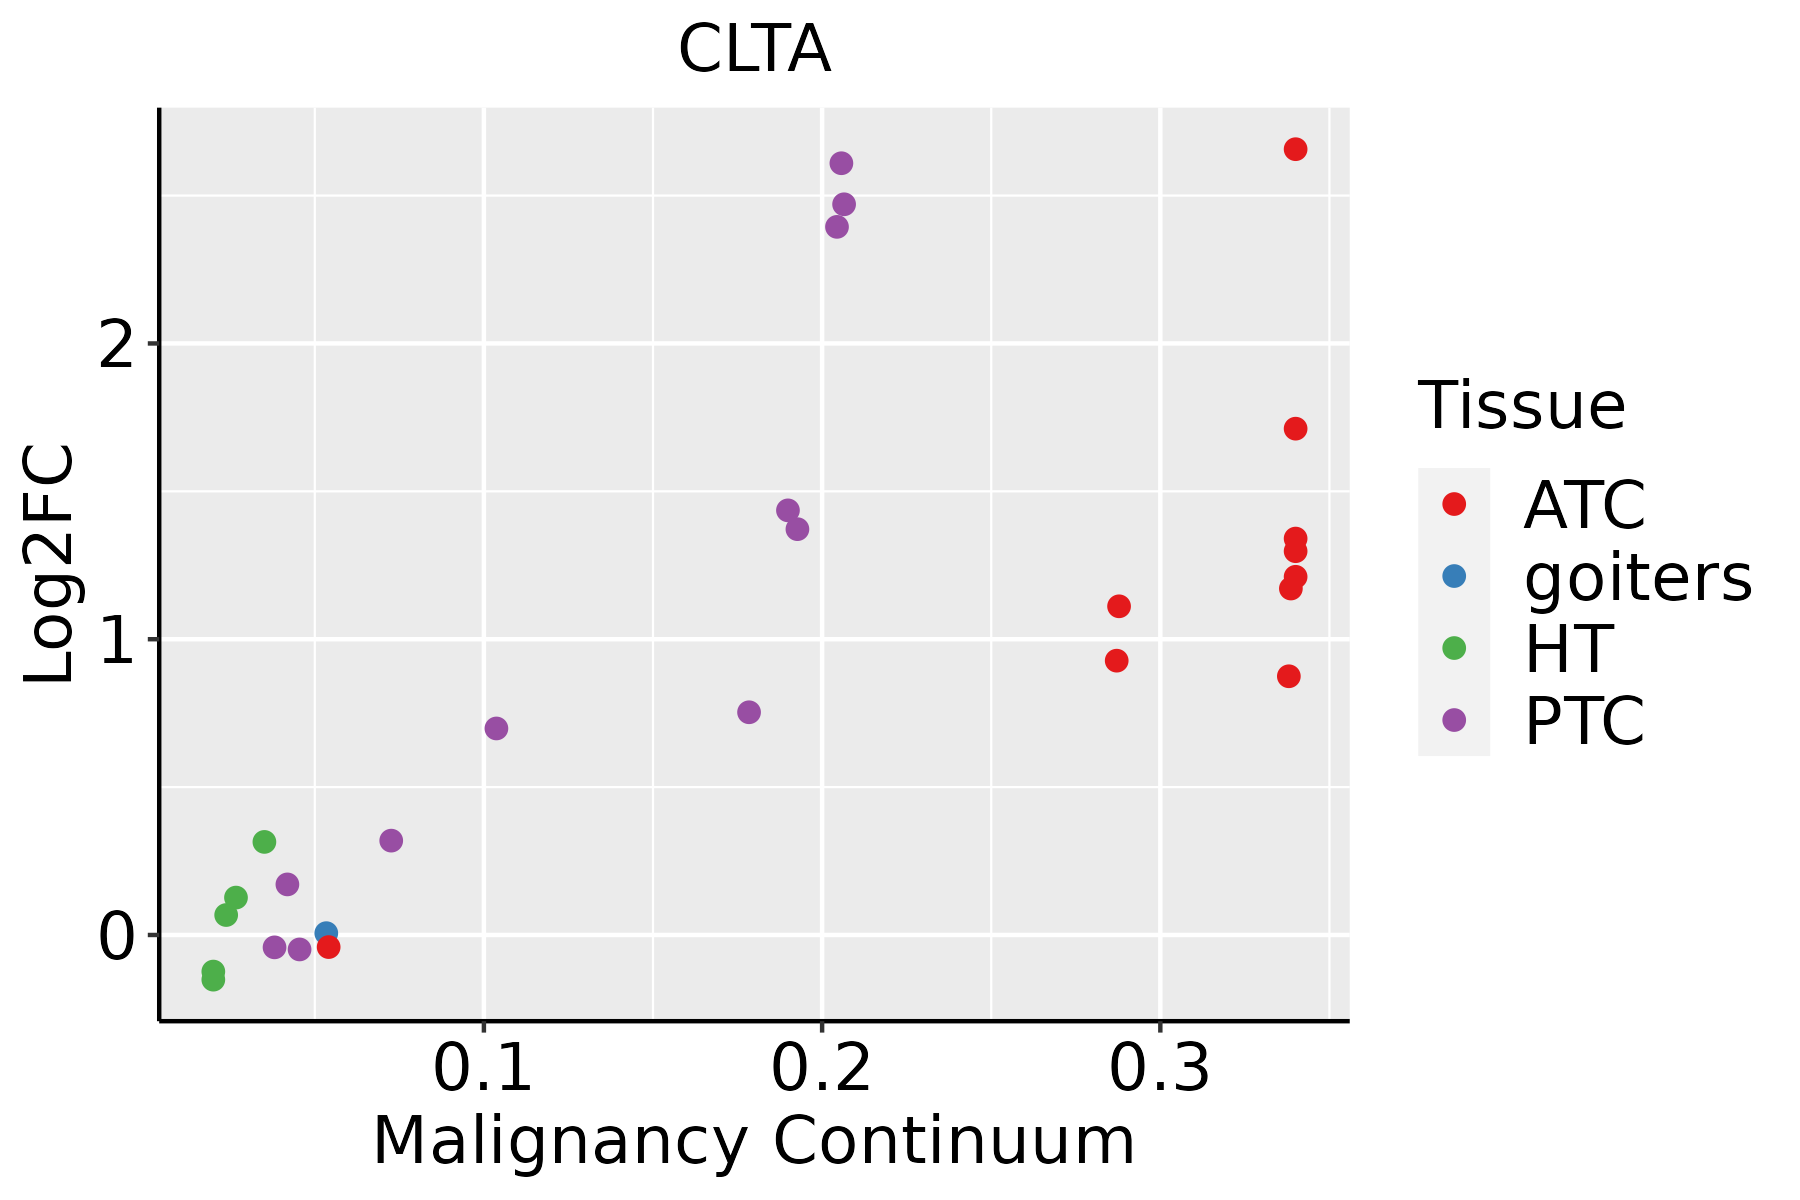 | ATC: Anaplastic thyroid cancer |
| HT: Hashimoto's thyroiditis | ||
| PTC: Papillary thyroid cancer |
| ∗log2FC in expression of this searched gene in stem-like cells from each diseased tissue sample relative to stem-like cells in normal samples in each tissue plotted against the malignancy continuum. Samples are colored based on if they are from different disease stage. |
Top |
Malignant transformation related pathway analysis |
| Find out the enriched GO biological processes and KEGG pathways involved in transition from healthy to precancer to cancer |
| Tissue | Disease Stage | Enriched GO biological Processes |
| Colorectum | AD |  |
| Colorectum | SER |  |
| Colorectum | MSS |  |
| Colorectum | MSI-H |  |
| Colorectum | FAP |  |
| ∗Top 15 enriched GO BP terms are showed in the bar plot of each disease state in each tissue. Each row represents a significant GO biological process which is colored according to the -log10(p.adjust). |
| Page: 1 2 3 4 5 6 7 8 9 |
| GO ID | Tissue | Disease Stage | Description | Gene Ratio | Bg Ratio | pvalue | p.adjust | Count |
| GO:00068986 | Breast | Precancer | receptor-mediated endocytosis | 27/1080 | 244/18723 | 9.01e-04 | 1.03e-02 | 27 |
| GO:00482685 | Breast | Precancer | clathrin coat assembly | 5/1080 | 18/18723 | 2.88e-03 | 2.49e-02 | 5 |
| GO:000689813 | Breast | IDC | receptor-mediated endocytosis | 35/1434 | 244/18723 | 2.38e-04 | 3.75e-03 | 35 |
| GO:000689823 | Breast | DCIS | receptor-mediated endocytosis | 35/1390 | 244/18723 | 1.31e-04 | 2.25e-03 | 35 |
| GO:00068987 | Cervix | CC | receptor-mediated endocytosis | 53/2311 | 244/18723 | 2.52e-05 | 4.29e-04 | 53 |
| GO:00725836 | Cervix | CC | clathrin-dependent endocytosis | 16/2311 | 47/18723 | 9.56e-05 | 1.25e-03 | 16 |
| GO:00482686 | Cervix | CC | clathrin coat assembly | 7/2311 | 18/18723 | 3.99e-03 | 2.48e-02 | 7 |
| GO:000689824 | Cervix | N_HPV | receptor-mediated endocytosis | 17/534 | 244/18723 | 6.68e-04 | 8.57e-03 | 17 |
| GO:0072583 | Colorectum | AD | clathrin-dependent endocytosis | 24/3918 | 47/18723 | 4.60e-06 | 1.22e-04 | 24 |
| GO:0006898 | Colorectum | AD | receptor-mediated endocytosis | 76/3918 | 244/18723 | 1.07e-04 | 1.59e-03 | 76 |
| GO:0048268 | Colorectum | AD | clathrin coat assembly | 10/3918 | 18/18723 | 1.31e-03 | 1.15e-02 | 10 |
| GO:00725831 | Colorectum | MSS | clathrin-dependent endocytosis | 22/3467 | 47/18723 | 8.74e-06 | 2.16e-04 | 22 |
| GO:00068981 | Colorectum | MSS | receptor-mediated endocytosis | 69/3467 | 244/18723 | 1.18e-04 | 1.82e-03 | 69 |
| GO:00482681 | Colorectum | MSS | clathrin coat assembly | 10/3467 | 18/18723 | 4.76e-04 | 5.58e-03 | 10 |
| GO:00725832 | Colorectum | FAP | clathrin-dependent endocytosis | 21/2622 | 47/18723 | 3.45e-07 | 1.87e-05 | 21 |
| GO:00068982 | Colorectum | FAP | receptor-mediated endocytosis | 62/2622 | 244/18723 | 1.47e-06 | 6.39e-05 | 62 |
| GO:00482682 | Colorectum | FAP | clathrin coat assembly | 8/2622 | 18/18723 | 1.72e-03 | 1.51e-02 | 8 |
| GO:00725833 | Colorectum | CRC | clathrin-dependent endocytosis | 18/2078 | 47/18723 | 1.16e-06 | 6.75e-05 | 18 |
| GO:00068983 | Colorectum | CRC | receptor-mediated endocytosis | 50/2078 | 244/18723 | 1.27e-05 | 4.08e-04 | 50 |
| GO:00482683 | Colorectum | CRC | clathrin coat assembly | 7/2078 | 18/18723 | 2.16e-03 | 2.11e-02 | 7 |
| Page: 1 2 3 |
| Pathway ID | Tissue | Disease Stage | Description | Gene Ratio | Bg Ratio | pvalue | p.adjust | qvalue | Count |
| hsa0501616 | Breast | Precancer | Huntington disease | 98/684 | 306/8465 | 2.85e-35 | 2.25e-33 | 1.72e-33 | 98 |
| hsa0510018 | Breast | Precancer | Bacterial invasion of epithelial cells | 16/684 | 77/8465 | 3.55e-04 | 2.80e-03 | 2.15e-03 | 16 |
| hsa0496110 | Breast | Precancer | Endocrine and other factor-regulated calcium reabsorption | 11/684 | 53/8465 | 2.92e-03 | 1.81e-02 | 1.39e-02 | 11 |
| hsa0501617 | Breast | Precancer | Huntington disease | 98/684 | 306/8465 | 2.85e-35 | 2.25e-33 | 1.72e-33 | 98 |
| hsa0510019 | Breast | Precancer | Bacterial invasion of epithelial cells | 16/684 | 77/8465 | 3.55e-04 | 2.80e-03 | 2.15e-03 | 16 |
| hsa0496111 | Breast | Precancer | Endocrine and other factor-regulated calcium reabsorption | 11/684 | 53/8465 | 2.92e-03 | 1.81e-02 | 1.39e-02 | 11 |
| hsa0501623 | Breast | IDC | Huntington disease | 103/867 | 306/8465 | 5.14e-30 | 4.17e-28 | 3.12e-28 | 103 |
| hsa0510024 | Breast | IDC | Bacterial invasion of epithelial cells | 17/867 | 77/8465 | 1.69e-03 | 1.19e-02 | 8.93e-03 | 17 |
| hsa0496121 | Breast | IDC | Endocrine and other factor-regulated calcium reabsorption | 12/867 | 53/8465 | 6.29e-03 | 3.30e-02 | 2.47e-02 | 12 |
| hsa0501633 | Breast | IDC | Huntington disease | 103/867 | 306/8465 | 5.14e-30 | 4.17e-28 | 3.12e-28 | 103 |
| hsa0510034 | Breast | IDC | Bacterial invasion of epithelial cells | 17/867 | 77/8465 | 1.69e-03 | 1.19e-02 | 8.93e-03 | 17 |
| hsa0496131 | Breast | IDC | Endocrine and other factor-regulated calcium reabsorption | 12/867 | 53/8465 | 6.29e-03 | 3.30e-02 | 2.47e-02 | 12 |
| hsa0501643 | Breast | DCIS | Huntington disease | 101/846 | 306/8465 | 1.54e-29 | 1.24e-27 | 9.13e-28 | 101 |
| hsa0510042 | Breast | DCIS | Bacterial invasion of epithelial cells | 16/846 | 77/8465 | 3.41e-03 | 1.98e-02 | 1.46e-02 | 16 |
| hsa0496141 | Breast | DCIS | Endocrine and other factor-regulated calcium reabsorption | 12/846 | 53/8465 | 5.17e-03 | 2.69e-02 | 1.98e-02 | 12 |
| hsa0414416 | Breast | DCIS | Endocytosis | 37/846 | 251/8465 | 9.92e-03 | 4.40e-02 | 3.24e-02 | 37 |
| hsa0501653 | Breast | DCIS | Huntington disease | 101/846 | 306/8465 | 1.54e-29 | 1.24e-27 | 9.13e-28 | 101 |
| hsa0510052 | Breast | DCIS | Bacterial invasion of epithelial cells | 16/846 | 77/8465 | 3.41e-03 | 1.98e-02 | 1.46e-02 | 16 |
| hsa0496151 | Breast | DCIS | Endocrine and other factor-regulated calcium reabsorption | 12/846 | 53/8465 | 5.17e-03 | 2.69e-02 | 1.98e-02 | 12 |
| hsa0414417 | Breast | DCIS | Endocytosis | 37/846 | 251/8465 | 9.92e-03 | 4.40e-02 | 3.24e-02 | 37 |
| Page: 1 2 3 4 5 6 7 8 |
Top |
Cell-cell communication analysis |
| Identification of potential cell-cell interactions between two cell types and their ligand-receptor pairs for different disease states |
| Ligand | Receptor | LRpair | Pathway | Tissue | Disease Stage |
| Page: 1 |
Top |
Single-cell gene regulatory network inference analysis |
| Find out the significant the regulons (TFs) and the target genes of each regulon across cell types for different disease states |
| TF | Cell Type | Tissue | Disease Stage | Target Gene | RSS | Regulon Activity |
| ∗The dot plots of a searched regulon are shown for all cell subpopulations in each disease state of each tissue based on the regulon specific score inferred using pySCENIC and by calculating the average expression. |
| Page: 1 |
Top |
Somatic mutation of malignant transformation related genes |
| Annotation of somatic variants for genes involved in malignant transformation |
| Hugo Symbol | Variant Class | Variant Classification | dbSNP RS | HGVSc | HGVSp | HGVSp Short | SWISSPROT | BIOTYPE | SIFT | PolyPhen | Tumor Sample Barcode | Tissue | Histology | Sex | Age | Stage | Therapy Types | Drugs | Outcome |
| CLTA | SNV | Missense_Mutation | novel | c.271N>C | p.Thr91Pro | p.T91P | P09496 | protein_coding | tolerated(0.06) | benign(0.044) | TCGA-2W-A8YY-01 | Cervix | cervical & endocervical cancer | Female | <65 | I/II | Chemotherapy | cisplatin | CR |
| CLTA | SNV | Missense_Mutation | c.400G>C | p.Glu134Gln | p.E134Q | P09496 | protein_coding | deleterious(0.01) | probably_damaging(0.997) | TCGA-IR-A3LK-01 | Cervix | cervical & endocervical cancer | Female | >=65 | I/II | Chemotherapy | cisplatin | PD | |
| CLTA | SNV | Missense_Mutation | c.241N>T | p.Gly81Cys | p.G81C | P09496 | protein_coding | deleterious(0.01) | probably_damaging(0.999) | TCGA-AA-3975-01 | Colorectum | colon adenocarcinoma | Male | >=65 | I/II | Unknown | Unknown | SD | |
| CLTA | SNV | Missense_Mutation | novel | c.258A>C | p.Glu86Asp | p.E86D | P09496 | protein_coding | tolerated(0.06) | benign(0.015) | TCGA-AA-3984-01 | Colorectum | colon adenocarcinoma | Female | <65 | I/II | Unknown | Unknown | SD |
| CLTA | SNV | Missense_Mutation | rs10972787 | c.305N>A | p.Arg102Gln | p.R102Q | P09496 | protein_coding | tolerated(0.21) | benign(0.035) | TCGA-CK-5913-01 | Colorectum | colon adenocarcinoma | Female | <65 | I/II | Unknown | Unknown | SD |
| CLTA | SNV | Missense_Mutation | novel | c.383N>A | p.Ser128Tyr | p.S128Y | P09496 | protein_coding | deleterious(0) | probably_damaging(0.986) | TCGA-AG-A002-01 | Colorectum | rectum adenocarcinoma | Male | <65 | I/II | Unknown | Unknown | SD |
| CLTA | SNV | Missense_Mutation | rs376238055 | c.698N>A | p.Arg233His | p.R233H | P09496 | protein_coding | deleterious(0) | probably_damaging(1) | TCGA-AJ-A3EL-01 | Endometrium | uterine corpus endometrioid carcinoma | Female | <65 | I/II | Unknown | Unknown | SD |
| CLTA | SNV | Missense_Mutation | novel | c.383N>A | p.Ser128Tyr | p.S128Y | P09496 | protein_coding | deleterious(0) | probably_damaging(0.986) | TCGA-B5-A1MR-01 | Endometrium | uterine corpus endometrioid carcinoma | Female | >=65 | III/IV | Unknown | Unknown | SD |
| CLTA | SNV | Missense_Mutation | novel | c.233N>C | p.Val78Ala | p.V78A | P09496 | protein_coding | tolerated(0.5) | benign(0.174) | TCGA-FI-A2D5-01 | Endometrium | uterine corpus endometrioid carcinoma | Female | <65 | III/IV | Chemotherapy | carboplatinum | PD |
| CLTA | insertion | Frame_Shift_Ins | novel | c.469dupA | p.Thr157AsnfsTer10 | p.T157Nfs*10 | P09496 | protein_coding | TCGA-D1-A1NY-01 | Endometrium | uterine corpus endometrioid carcinoma | Female | >=65 | I/II | Chemotherapy | carboplatin | SD |
| Page: 1 2 |
Top |
Related drugs of malignant transformation related genes |
| Identification of chemicals and drugs interact with genes involved in malignant transfromation |
| (DGIdb 4.0) |
| Entrez ID | Symbol | Category | Interaction Types | Drug Claim Name | Drug Name | PMIDs |
| Page: 1 |

Copyright 2023-Present -The University of Texas Health Science Center at Houston |