
|
|||||
|
 | |
| |
| |
| |
| |
| |
|
Gene: CLSTN3 |
Gene summary for CLSTN3 |
| Gene information | Species | Human | Gene symbol | CLSTN3 | Gene ID | 9746 |
| Gene name | calsyntenin 3 | |
| Gene Alias | CDHR14 | |
| Cytomap | 12p13.31 | |
| Gene Type | protein-coding | GO ID | GO:0001558 | UniProtAcc | Q9BQT9 |
Top |
Malignant transformation analysis |
| Identification of the aberrant gene expression in precancerous and cancerous lesions by comparing the gene expression of stem-like cells in diseased tissues with normal stem cells |
| Entrez ID | Symbol | Replicates | Species | Organ | Tissue | Adj P-value | Log2FC | Malignancy |
| 9746 | CLSTN3 | LZE7T | Human | Esophagus | ESCC | 6.99e-07 | 2.79e-01 | 0.0667 |
| 9746 | CLSTN3 | LZE8T | Human | Esophagus | ESCC | 1.22e-06 | 1.83e-01 | 0.067 |
| 9746 | CLSTN3 | LZE24T | Human | Esophagus | ESCC | 4.42e-04 | 9.64e-02 | 0.0596 |
| 9746 | CLSTN3 | LZE6T | Human | Esophagus | ESCC | 1.82e-02 | 1.49e-01 | 0.0845 |
| 9746 | CLSTN3 | P1T-E | Human | Esophagus | ESCC | 1.11e-05 | 2.02e-01 | 0.0875 |
| 9746 | CLSTN3 | P2T-E | Human | Esophagus | ESCC | 5.05e-22 | 3.43e-01 | 0.1177 |
| 9746 | CLSTN3 | P4T-E | Human | Esophagus | ESCC | 5.15e-12 | 2.03e-01 | 0.1323 |
| 9746 | CLSTN3 | P8T-E | Human | Esophagus | ESCC | 8.47e-09 | 2.06e-01 | 0.0889 |
| 9746 | CLSTN3 | P10T-E | Human | Esophagus | ESCC | 2.29e-10 | 1.74e-01 | 0.116 |
| 9746 | CLSTN3 | P11T-E | Human | Esophagus | ESCC | 9.17e-12 | 2.69e-01 | 0.1426 |
| 9746 | CLSTN3 | P12T-E | Human | Esophagus | ESCC | 9.82e-20 | 4.25e-01 | 0.1122 |
| 9746 | CLSTN3 | P15T-E | Human | Esophagus | ESCC | 6.39e-07 | 2.35e-01 | 0.1149 |
| 9746 | CLSTN3 | P16T-E | Human | Esophagus | ESCC | 1.17e-48 | 8.96e-01 | 0.1153 |
| 9746 | CLSTN3 | P17T-E | Human | Esophagus | ESCC | 1.94e-03 | 1.67e-01 | 0.1278 |
| 9746 | CLSTN3 | P21T-E | Human | Esophagus | ESCC | 4.41e-03 | 2.82e-02 | 0.1617 |
| 9746 | CLSTN3 | P22T-E | Human | Esophagus | ESCC | 8.12e-10 | 1.47e-01 | 0.1236 |
| 9746 | CLSTN3 | P24T-E | Human | Esophagus | ESCC | 5.67e-04 | 1.07e-01 | 0.1287 |
| 9746 | CLSTN3 | P26T-E | Human | Esophagus | ESCC | 5.40e-12 | 2.57e-01 | 0.1276 |
| 9746 | CLSTN3 | P27T-E | Human | Esophagus | ESCC | 1.90e-15 | 3.25e-01 | 0.1055 |
| 9746 | CLSTN3 | P28T-E | Human | Esophagus | ESCC | 3.80e-04 | 1.16e-01 | 0.1149 |
| Page: 1 2 3 4 |
| Tissue | Expression Dynamics | Abbreviation |
| Esophagus | 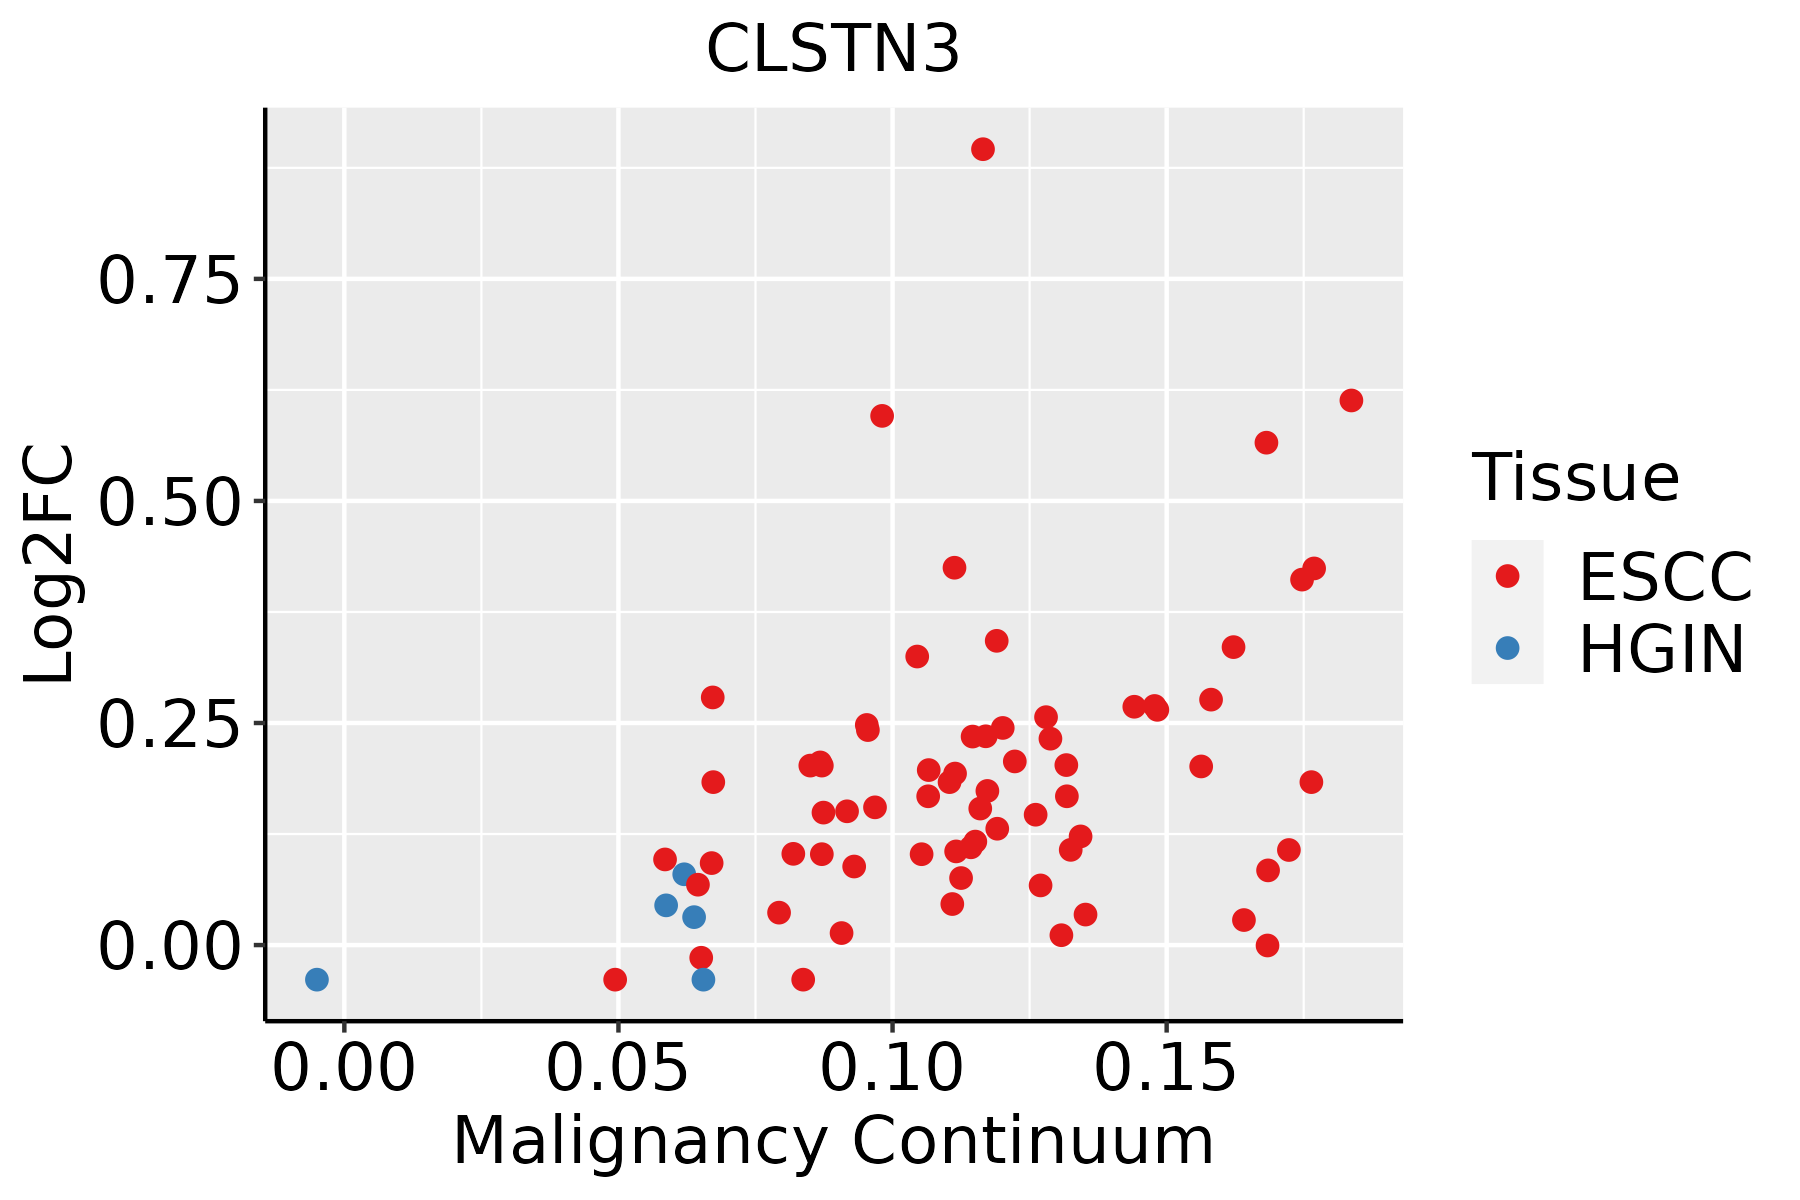 | ESCC: Esophageal squamous cell carcinoma |
| HGIN: High-grade intraepithelial neoplasias | ||
| LGIN: Low-grade intraepithelial neoplasias | ||
| Liver |  | HCC: Hepatocellular carcinoma |
| NAFLD: Non-alcoholic fatty liver disease | ||
| Thyroid | 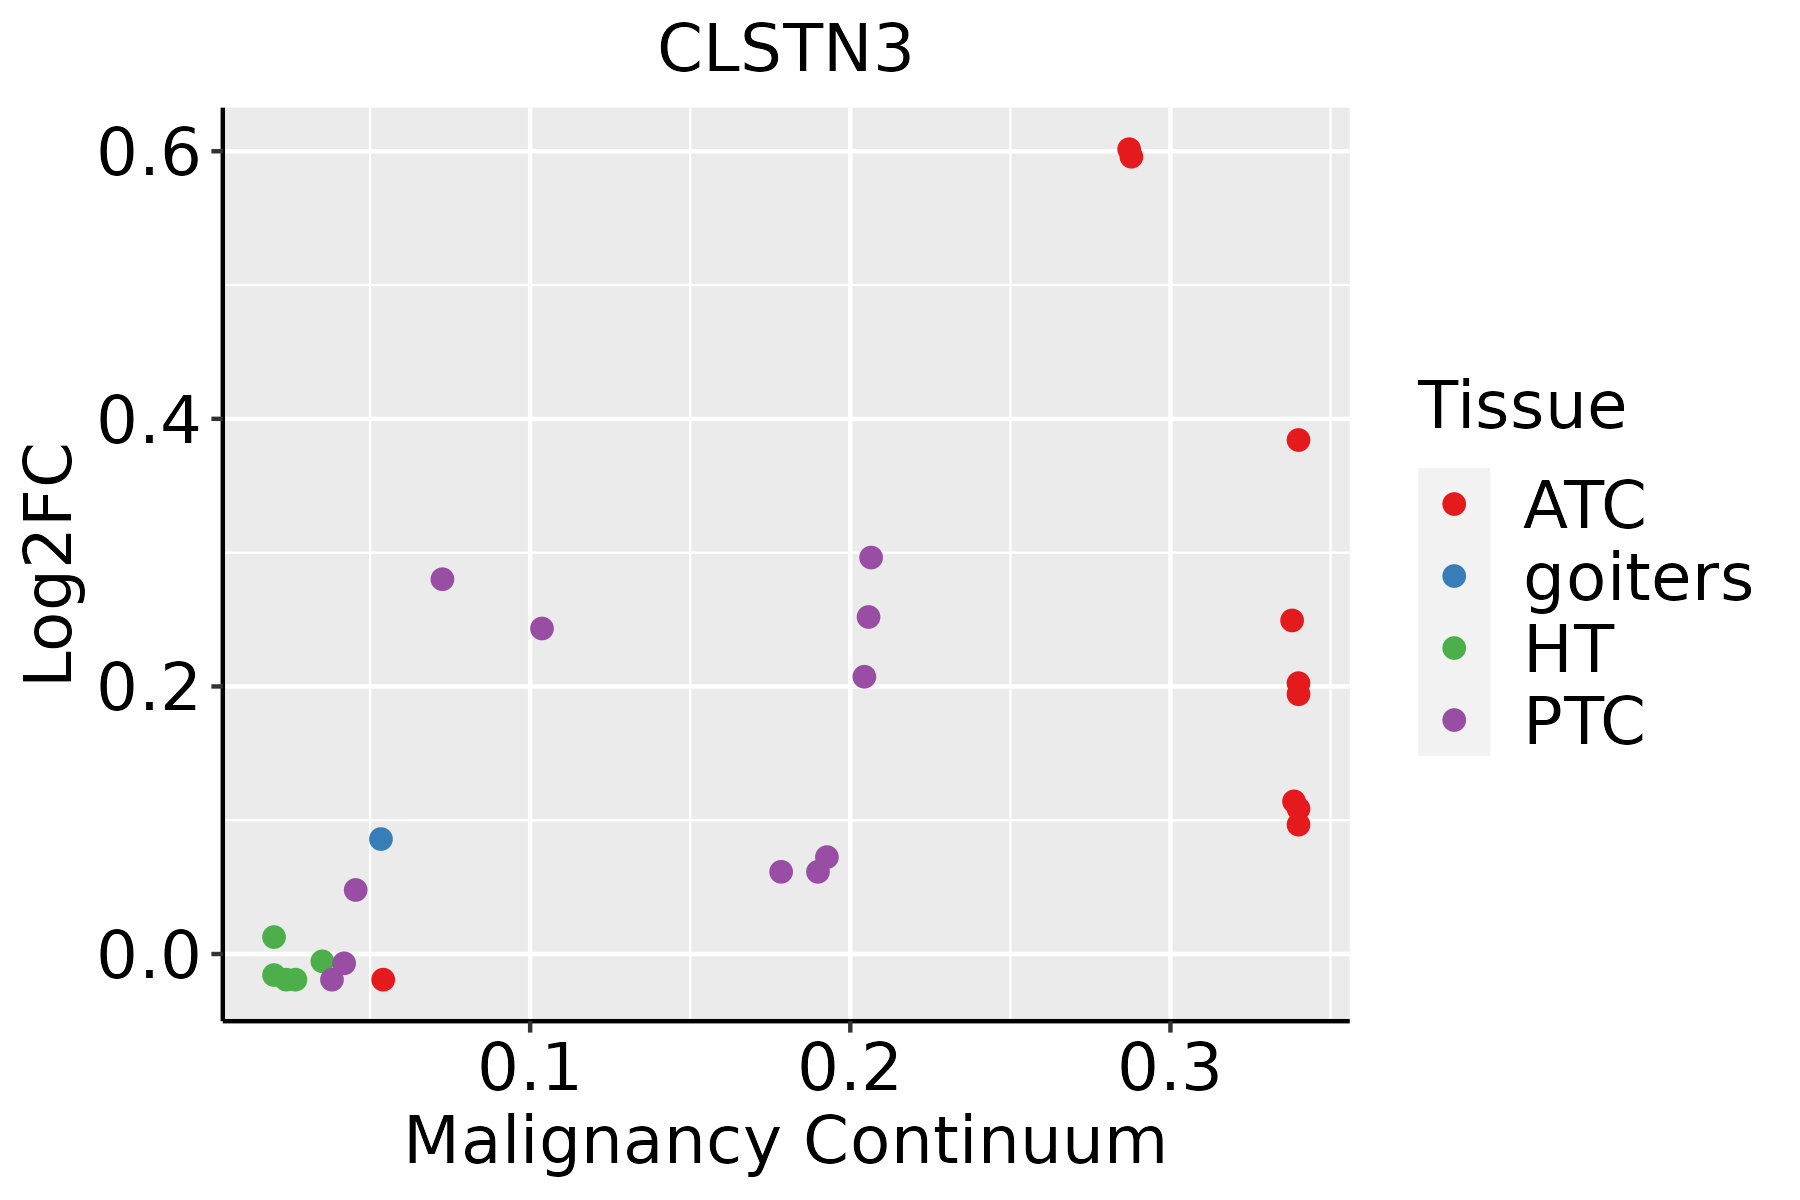 | ATC: Anaplastic thyroid cancer |
| HT: Hashimoto's thyroiditis | ||
| PTC: Papillary thyroid cancer |
| ∗log2FC in expression of this searched gene in stem-like cells from each diseased tissue sample relative to stem-like cells in normal samples in each tissue plotted against the malignancy continuum. Samples are colored based on if they are from different disease stage. |
Top |
Malignant transformation related pathway analysis |
| Find out the enriched GO biological processes and KEGG pathways involved in transition from healthy to precancer to cancer |
| Tissue | Disease Stage | Enriched GO biological Processes |
| Colorectum | AD |  |
| Colorectum | SER |  |
| Colorectum | MSS |  |
| Colorectum | MSI-H |  |
| Colorectum | FAP |  |
| ∗Top 15 enriched GO BP terms are showed in the bar plot of each disease state in each tissue. Each row represents a significant GO biological process which is colored according to the -log10(p.adjust). |
| Page: 1 2 3 4 5 6 7 8 9 |
| GO ID | Tissue | Disease Stage | Description | Gene Ratio | Bg Ratio | pvalue | p.adjust | Count |
| GO:0016049110 | Esophagus | ESCC | cell growth | 289/8552 | 482/18723 | 1.29e-10 | 3.77e-09 | 289 |
| GO:000155819 | Esophagus | ESCC | regulation of cell growth | 248/8552 | 414/18723 | 2.97e-09 | 6.45e-08 | 248 |
| GO:003432918 | Esophagus | ESCC | cell junction assembly | 227/8552 | 420/18723 | 3.06e-04 | 1.83e-03 | 227 |
| GO:00519606 | Esophagus | ESCC | regulation of nervous system development | 237/8552 | 443/18723 | 5.02e-04 | 2.78e-03 | 237 |
| GO:00519625 | Esophagus | ESCC | positive regulation of nervous system development | 149/8552 | 272/18723 | 1.50e-03 | 7.06e-03 | 149 |
| GO:190188810 | Esophagus | ESCC | regulation of cell junction assembly | 109/8552 | 204/18723 | 1.53e-02 | 4.96e-02 | 109 |
| GO:001604921 | Liver | HCC | cell growth | 269/7958 | 482/18723 | 1.84e-09 | 5.35e-08 | 269 |
| GO:000155821 | Liver | HCC | regulation of cell growth | 228/7958 | 414/18723 | 1.34e-07 | 2.55e-06 | 228 |
| GO:0016049112 | Thyroid | PTC | cell growth | 225/5968 | 482/18723 | 4.75e-12 | 2.07e-10 | 225 |
| GO:0001558111 | Thyroid | PTC | regulation of cell growth | 188/5968 | 414/18723 | 4.13e-09 | 1.09e-07 | 188 |
| GO:0034329111 | Thyroid | PTC | cell junction assembly | 180/5968 | 420/18723 | 1.17e-06 | 1.69e-05 | 180 |
| GO:005196214 | Thyroid | PTC | positive regulation of nervous system development | 117/5968 | 272/18723 | 6.72e-05 | 5.89e-04 | 117 |
| GO:00519608 | Thyroid | PTC | regulation of nervous system development | 177/5968 | 443/18723 | 1.72e-04 | 1.32e-03 | 177 |
| GO:190188817 | Thyroid | PTC | regulation of cell junction assembly | 88/5968 | 204/18723 | 4.50e-04 | 2.97e-03 | 88 |
| GO:19024145 | Thyroid | PTC | protein localization to cell junction | 43/5968 | 94/18723 | 3.32e-03 | 1.62e-02 | 43 |
| GO:00508089 | Thyroid | PTC | synapse organization | 161/5968 | 426/18723 | 5.11e-03 | 2.36e-02 | 161 |
| GO:00508074 | Thyroid | PTC | regulation of synapse organization | 84/5968 | 211/18723 | 8.72e-03 | 3.64e-02 | 84 |
| GO:00508032 | Thyroid | PTC | regulation of synapse structure or activity | 86/5968 | 218/18723 | 1.05e-02 | 4.23e-02 | 86 |
| GO:001604927 | Thyroid | ATC | cell growth | 241/6293 | 482/18723 | 4.27e-14 | 2.35e-12 | 241 |
| GO:000155826 | Thyroid | ATC | regulation of cell growth | 201/6293 | 414/18723 | 1.57e-10 | 4.76e-09 | 201 |
| Page: 1 2 |
| Pathway ID | Tissue | Disease Stage | Description | Gene Ratio | Bg Ratio | pvalue | p.adjust | qvalue | Count |
| Page: 1 |
Top |
Cell-cell communication analysis |
| Identification of potential cell-cell interactions between two cell types and their ligand-receptor pairs for different disease states |
| Ligand | Receptor | LRpair | Pathway | Tissue | Disease Stage |
| Page: 1 |
Top |
Single-cell gene regulatory network inference analysis |
| Find out the significant the regulons (TFs) and the target genes of each regulon across cell types for different disease states |
| TF | Cell Type | Tissue | Disease Stage | Target Gene | RSS | Regulon Activity |
| ∗The dot plots of a searched regulon are shown for all cell subpopulations in each disease state of each tissue based on the regulon specific score inferred using pySCENIC and by calculating the average expression. |
| Page: 1 |
Top |
Somatic mutation of malignant transformation related genes |
| Annotation of somatic variants for genes involved in malignant transformation |
| Hugo Symbol | Variant Class | Variant Classification | dbSNP RS | HGVSc | HGVSp | HGVSp Short | SWISSPROT | BIOTYPE | SIFT | PolyPhen | Tumor Sample Barcode | Tissue | Histology | Sex | Age | Stage | Therapy Types | Drugs | Outcome |
| CLSTN3 | SNV | Missense_Mutation | novel | c.2375N>G | p.Asn792Ser | p.N792S | Q9BQT9 | protein_coding | deleterious(0) | probably_damaging(0.971) | TCGA-A7-A3RF-01 | Breast | breast invasive carcinoma | Female | >=65 | I/II | Hormone Therapy | anastrozole | PD |
| CLSTN3 | SNV | Missense_Mutation | rs749951518 | c.346G>A | p.Glu116Lys | p.E116K | Q9BQT9 | protein_coding | tolerated(0.51) | benign(0.053) | TCGA-AO-A128-01 | Breast | breast invasive carcinoma | Female | <65 | I/II | Chemotherapy | doxorubicin | SD |
| CLSTN3 | SNV | Missense_Mutation | novel | c.1503G>C | p.Glu501Asp | p.E501D | Q9BQT9 | protein_coding | tolerated(0.11) | benign(0.05) | TCGA-BH-A0DZ-01 | Breast | breast invasive carcinoma | Female | <65 | I/II | Chemotherapy | docetaxel | SD |
| CLSTN3 | SNV | Missense_Mutation | rs755463631 | c.1897N>A | p.Val633Met | p.V633M | Q9BQT9 | protein_coding | deleterious(0) | possibly_damaging(0.803) | TCGA-D8-A1Y1-01 | Breast | breast invasive carcinoma | Female | >=65 | III/IV | Hormone Therapy | tamoxiphen | PD |
| CLSTN3 | SNV | Missense_Mutation | novel | c.1813N>A | p.Gly605Ser | p.G605S | Q9BQT9 | protein_coding | deleterious(0) | probably_damaging(1) | TCGA-2W-A8YY-01 | Cervix | cervical & endocervical cancer | Female | <65 | I/II | Chemotherapy | cisplatin | CR |
| CLSTN3 | SNV | Missense_Mutation | novel | c.2464N>G | p.Arg822Gly | p.R822G | Q9BQT9 | protein_coding | tolerated(0.14) | benign(0.021) | TCGA-BI-A20A-01 | Cervix | cervical & endocervical cancer | Female | <65 | I/II | Unknown | Unknown | SD |
| CLSTN3 | SNV | Missense_Mutation | novel | c.2465N>C | p.Arg822Pro | p.R822P | Q9BQT9 | protein_coding | tolerated(1) | benign(0) | TCGA-BI-A20A-01 | Cervix | cervical & endocervical cancer | Female | <65 | I/II | Unknown | Unknown | SD |
| CLSTN3 | SNV | Missense_Mutation | rs759437086 | c.1858N>A | p.Glu620Lys | p.E620K | Q9BQT9 | protein_coding | deleterious(0.01) | benign(0.251) | TCGA-C5-A1BJ-01 | Cervix | cervical & endocervical cancer | Female | <65 | I/II | Unknown | Unknown | SD |
| CLSTN3 | SNV | Missense_Mutation | c.2053G>T | p.Asp685Tyr | p.D685Y | Q9BQT9 | protein_coding | deleterious(0) | possibly_damaging(0.805) | TCGA-C5-A1MK-01 | Cervix | cervical & endocervical cancer | Female | >=65 | III/IV | Chemotherapy | carboplatin | PD | |
| CLSTN3 | SNV | Missense_Mutation | rs182094956 | c.1150N>A | p.Val384Ile | p.V384I | Q9BQT9 | protein_coding | tolerated(0.09) | benign(0.367) | TCGA-EK-A2PG-01 | Cervix | cervical & endocervical cancer | Female | >=65 | I/II | Unknown | Unknown | SD |
| Page: 1 2 3 4 5 6 7 8 9 10 11 |
Top |
Related drugs of malignant transformation related genes |
| Identification of chemicals and drugs interact with genes involved in malignant transfromation |
| (DGIdb 4.0) |
| Entrez ID | Symbol | Category | Interaction Types | Drug Claim Name | Drug Name | PMIDs |
| Page: 1 |

Copyright 2023-Present -The University of Texas Health Science Center at Houston |