Schematic overview of the cellular and molecular mechanisms involved in the cancer progression, including the proposed cellular and molecular mechanisms in cancer cells trajectory. AT1: alveolar type 1 cells; AT2: alveolar type 2 cells; AAH: atypical adenomatous hyperplasia; AIS: adenocarcinoma in situ; MIA: minimally invasive adenocarcinoma; IA: invasive adenocarcinoma; EMT: epithelial-mesenchymal transition

Home

Download

Statistics

Help

Contact

Center for Computational Systems Medicine
leaf

Gene summary

leaf

Malignant transformation analysis

leaf

Malignant transformation related pathway analysis

leaf

Cell-cell communication analysis

leaf

Single-cell gene regulatory network inference analysis

leaf

Somatic mutation of malignant transformation related genes

leaf

Related drugs of malignant transformation related genes

Gene: CLSPN

Gene summary for CLSPN

check button Gene summary.

Gene informationSpeciesHuman
Gene symbol

CLSPN

Gene ID

63967

Gene nameclaspin
Gene AliasCLSPN
Cytomap1p34.3
Gene Typeprotein-coding
GO ID

GO:0000075

UniProtAcc

Q9HAW4


Top

Malignant transformation analysis

check button Identification of the aberrant gene expression in precancerous and cancerous lesions by comparing the gene expression of stem-like cells in diseased tissues with normal stem cells
check button Malignant transformation involving gene list.
Entrez IDSymbolReplicatesSpeciesOrganTissueAdj P-valueLog2FCMalignancy
63967CLSPNLZE7THumanEsophagusESCC6.13e-074.59e-010.0667
63967CLSPNLZE6THumanEsophagusESCC5.35e-042.02e-010.0845
63967CLSPNP1T-EHumanEsophagusESCC4.62e-033.11e-010.0875
63967CLSPNP2T-EHumanEsophagusESCC2.68e-084.30e-010.1177
63967CLSPNP4T-EHumanEsophagusESCC6.14e-112.89e-010.1323
63967CLSPNP5T-EHumanEsophagusESCC1.29e-113.60e-010.1327
63967CLSPNP10T-EHumanEsophagusESCC1.29e-062.62e-010.116
63967CLSPNP12T-EHumanEsophagusESCC1.31e-031.52e-010.1122
63967CLSPNP15T-EHumanEsophagusESCC3.34e-062.01e-010.1149
63967CLSPNP17T-EHumanEsophagusESCC2.14e-093.71e-010.1278
63967CLSPNP21T-EHumanEsophagusESCC1.16e-053.67e-010.1617
63967CLSPNP22T-EHumanEsophagusESCC9.54e-051.47e-010.1236
63967CLSPNP23T-EHumanEsophagusESCC3.36e-031.47e-010.108
63967CLSPNP24T-EHumanEsophagusESCC2.89e-041.57e-010.1287
63967CLSPNP26T-EHumanEsophagusESCC1.48e-031.21e-010.1276
63967CLSPNP27T-EHumanEsophagusESCC2.04e-062.46e-010.1055
63967CLSPNP28T-EHumanEsophagusESCC1.29e-123.49e-010.1149
63967CLSPNP30T-EHumanEsophagusESCC2.13e-033.78e-010.137
63967CLSPNP31T-EHumanEsophagusESCC1.92e-175.34e-010.1251
63967CLSPNP32T-EHumanEsophagusESCC7.37e-195.02e-010.1666
Page: 1 2 3 4 

check button Transcriptomic changes along malignancy continuum.
TissueExpression DynamicsAbbreviation
EsophagusThe image shows the transcriptomic changes along malignancy continuum.log2FC in expression of this searched gene in stem-like cells from each diseased tissue sample relative to stem-like cells in normal samples in each tissue plotted against the malignancy continuum. Samples are colored based on if they are from different disease stage.
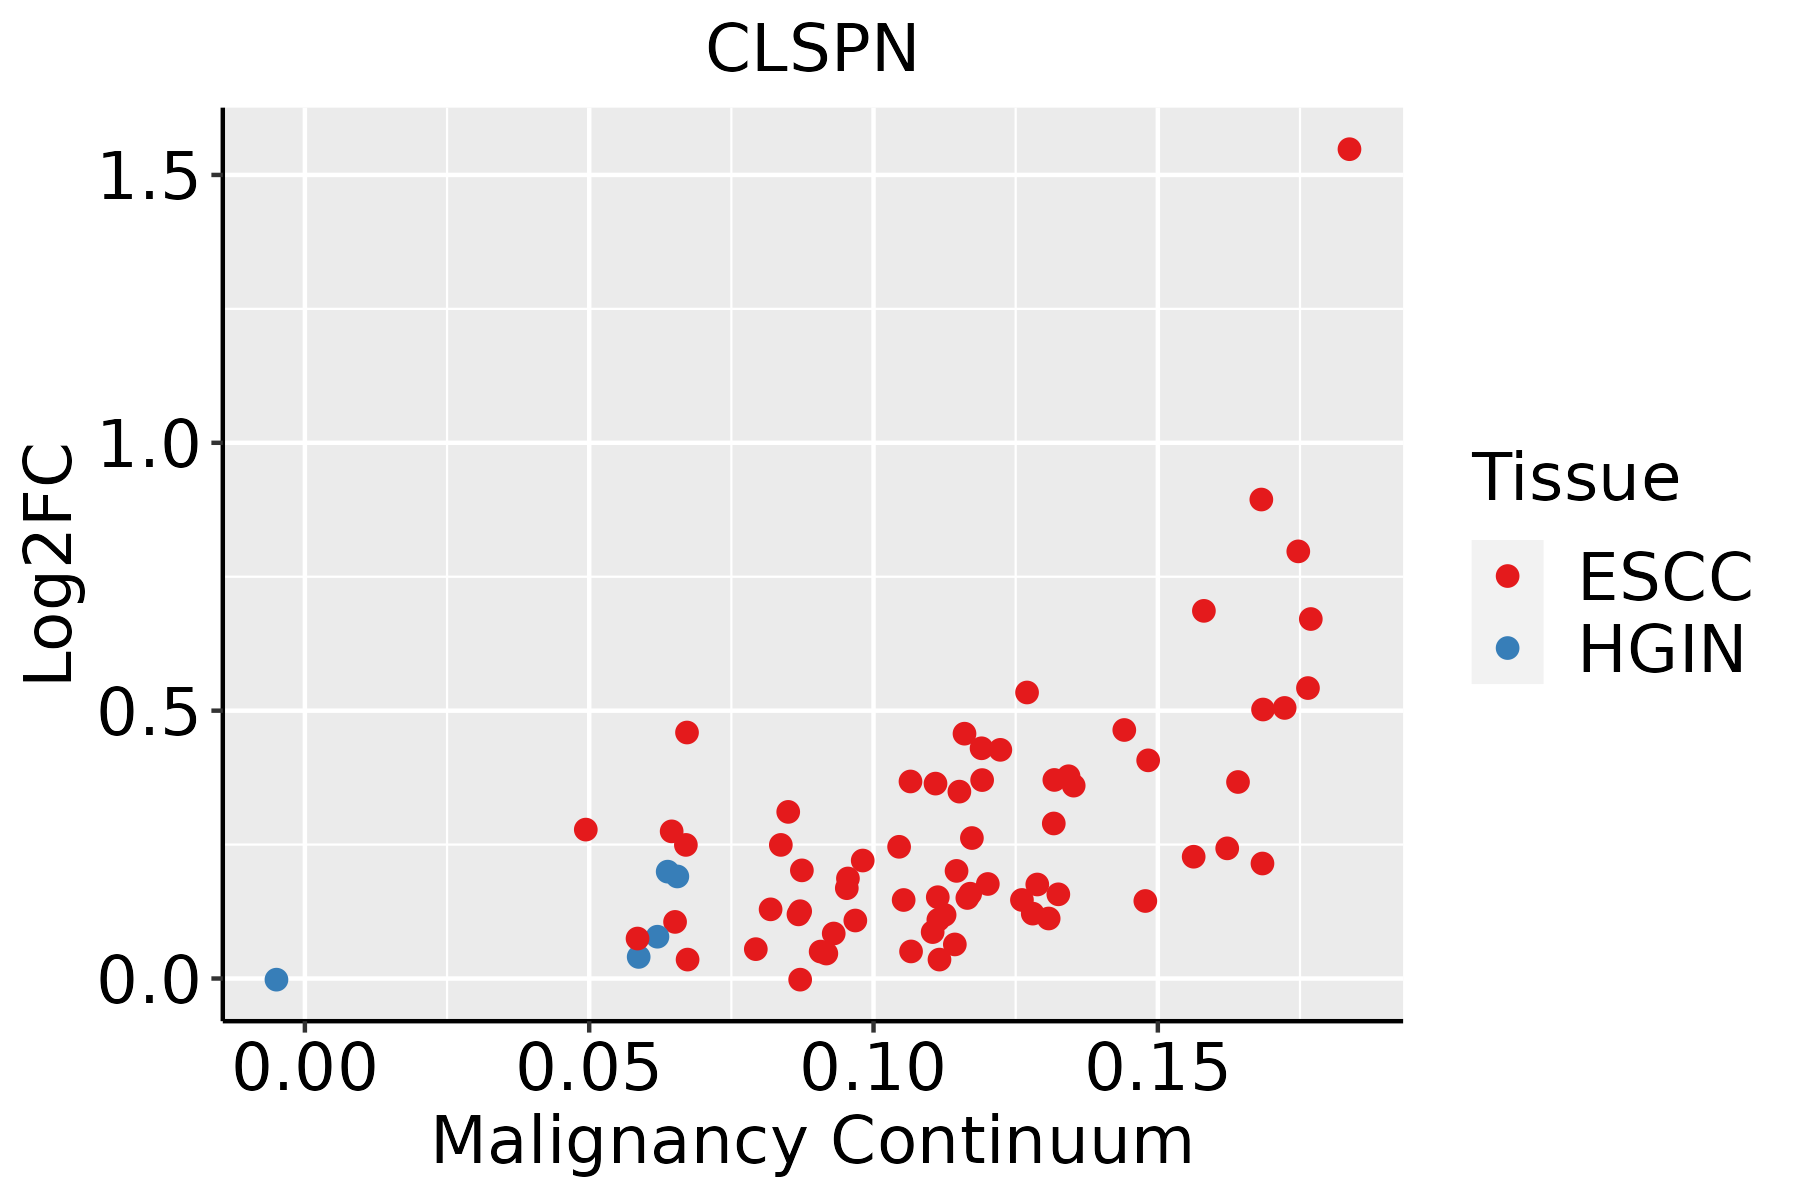
ESCC: Esophageal squamous cell carcinoma
HGIN: High-grade intraepithelial neoplasias
LGIN: Low-grade intraepithelial neoplasias
LiverThe image shows the transcriptomic changes along malignancy continuum.log2FC in expression of this searched gene in stem-like cells from each diseased tissue sample relative to stem-like cells in normal samples in each tissue plotted against the malignancy continuum. Samples are colored based on if they are from different disease stage.HCC: Hepatocellular carcinoma
NAFLD: Non-alcoholic fatty liver disease
Oral CavityThe image shows the transcriptomic changes along malignancy continuum.log2FC in expression of this searched gene in stem-like cells from each diseased tissue sample relative to stem-like cells in normal samples in each tissue plotted against the malignancy continuum. Samples are colored based on if they are from different disease stage.EOLP: Erosive Oral lichen planus
LP: leukoplakia
NEOLP: Non-erosive oral lichen planus
OSCC: Oral squamous cell carcinoma
ThyroidThe image shows the transcriptomic changes along malignancy continuum.log2FC in expression of this searched gene in stem-like cells from each diseased tissue sample relative to stem-like cells in normal samples in each tissue plotted against the malignancy continuum. Samples are colored based on if they are from different disease stage.
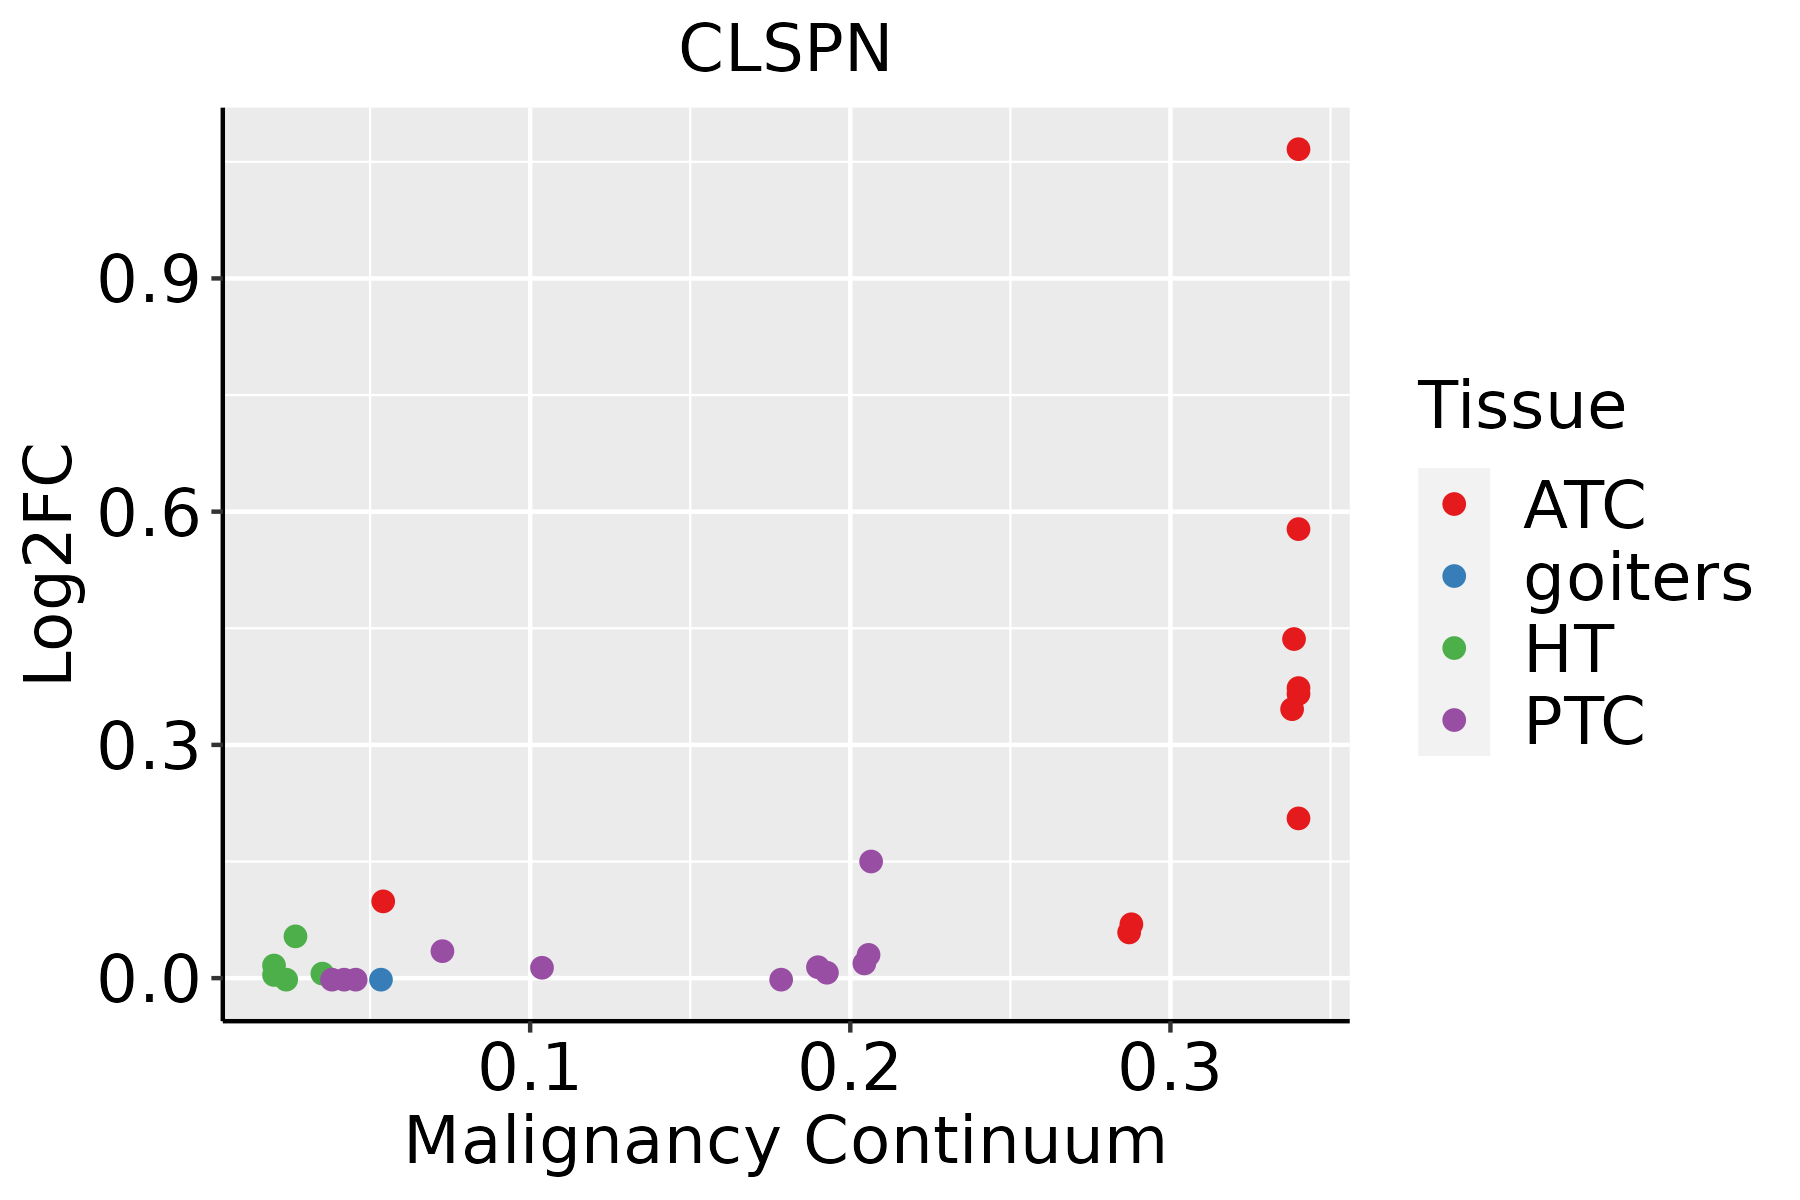
ATC: Anaplastic thyroid cancer
HT: Hashimoto's thyroiditis
PTC: Papillary thyroid cancer
∗log2FC in expression of this searched gene in stem-like cells from each diseased tissue sample relative to stem-like cells in normal samples in each tissue plotted against the malignancy continuum. Samples are colored based on if they are from different disease stage.

Top

Malignant transformation related pathway analysis

check buttonFind out the enriched GO biological processes and KEGG pathways involved in transition from healthy to precancer to cancer
check button Figure of enriched GO biological processes.
TissueDisease StageEnriched GO biological Processes
ColorectumADGO analysis - Figure of enriched GO biological processes: Top 15 enriched GO BP terms are showed in the bar plot of each disease state in each tissue. Each row represents a significant GO biological process which is colored according to the -log10(p.adjust).
ColorectumSERGO analysis - Figure of enriched GO biological processes: Top 15 enriched GO BP terms are showed in the bar plot of each disease state in each tissue. Each row represents a significant GO biological process which is colored according to the -log10(p.adjust).
ColorectumMSSGO analysis - Figure of enriched GO biological processes: Top 15 enriched GO BP terms are showed in the bar plot of each disease state in each tissue. Each row represents a significant GO biological process which is colored according to the -log10(p.adjust).
ColorectumMSI-HGO analysis - Figure of enriched GO biological processes: Top 15 enriched GO BP terms are showed in the bar plot of each disease state in each tissue. Each row represents a significant GO biological process which is colored according to the -log10(p.adjust).
ColorectumFAPGO analysis - Figure of enriched GO biological processes: Top 15 enriched GO BP terms are showed in the bar plot of each disease state in each tissue. Each row represents a significant GO biological process which is colored according to the -log10(p.adjust).
∗Top 15 enriched GO BP terms are showed in the bar plot of each disease state in each tissue. Each row represents a significant GO biological process which is colored according to the -log10(p.adjust).
Page: 1 2 3 4 5 6 7 8 9 

check button Enriched GO biological processes.
GO IDTissueDisease StageDescriptionGene RatioBg Ratiopvaluep.adjustCount
GO:004477216EsophagusESCCmitotic cell cycle phase transition281/8552424/187234.63e-184.45e-16281
GO:000734615EsophagusESCCregulation of mitotic cell cycle293/8552457/187238.00e-165.64e-14293
GO:190198713EsophagusESCCregulation of cell cycle phase transition242/8552390/187233.86e-111.26e-09242
GO:190199013EsophagusESCCregulation of mitotic cell cycle phase transition191/8552299/187231.35e-103.94e-09191
GO:00457865EsophagusESCCnegative regulation of cell cycle236/8552385/187233.62e-109.93e-09236
GO:00000754EsophagusESCCcell cycle checkpoint117/8552169/187234.47e-101.17e-08117
GO:004277014EsophagusESCCsignal transduction in response to DNA damage117/8552172/187232.38e-095.32e-08117
GO:00448394EsophagusESCCcell cycle G2/M phase transition103/8552148/187233.09e-096.67e-08103
GO:00000864EsophagusESCCG2/M transition of mitotic cell cycle96/8552137/187236.00e-091.23e-0796
GO:00070934EsophagusESCCmitotic cell cycle checkpoint90/8552129/187232.49e-084.69e-0790
GO:00109484EsophagusESCCnegative regulation of cell cycle process177/8552294/187233.26e-074.59e-06177
GO:00315705EsophagusESCCDNA integrity checkpoint83/8552123/187238.17e-071.06e-0583
GO:00000775EsophagusESCCDNA damage checkpoint78/8552115/187231.27e-061.56e-0578
GO:19019883EsophagusESCCnegative regulation of cell cycle phase transition151/8552249/187231.28e-061.57e-05151
GO:004593013EsophagusESCCnegative regulation of mitotic cell cycle143/8552235/187231.84e-062.15e-05143
GO:00182099EsophagusESCCpeptidyl-serine modification196/8552338/187233.07e-063.47e-05196
GO:001810515EsophagusESCCpeptidyl-serine phosphorylation184/8552315/187233.22e-063.61e-05184
GO:190199113EsophagusESCCnegative regulation of mitotic cell cycle phase transition112/8552179/187233.69e-064.03e-05112
GO:004586018EsophagusESCCpositive regulation of protein kinase activity219/8552386/187236.91e-066.97e-05219
GO:003367420EsophagusESCCpositive regulation of kinase activity260/8552467/187237.26e-067.22e-05260
Page: 1 2 3 4 5 6 

check button Enriched KEGG pathways.
Pathway IDTissueDisease StageDescriptionGene RatioBg Ratiopvaluep.adjustqvalueCount
Page: 1 

Top

Cell-cell communication analysis

check buttonIdentification of potential cell-cell interactions between two cell types and their ligand-receptor pairs for different disease states
LigandReceptorLRpairPathwayTissueDisease Stage
Page: 1 

Top

Single-cell gene regulatory network inference analysis

check buttonFind out the significant the regulons (TFs) and the target genes of each regulon across cell types for different disease states
TFCell TypeTissueDisease StageTarget GeneRSSRegulon Activity
∗The dot plots of a searched regulon are shown for all cell subpopulations in each disease state of each tissue based on the regulon specific score inferred using pySCENIC and by calculating the average expression.
Page: 1 

Top

Somatic mutation of malignant transformation related genes

check buttonAnnotation of somatic variants for genes involved in malignant transformation
Hugo SymbolVariant ClassVariant ClassificationdbSNP RSHGVScHGVSpHGVSp ShortSWISSPROTBIOTYPESIFTPolyPhenTumor Sample BarcodeTissueHistologySexAgeStageTherapy TypesDrugsOutcome
CLSPNSNVMissense_Mutationc.3097G>Ap.Asp1033Asnp.D1033NQ9HAW4protein_codingdeleterious(0.01)probably_damaging(0.981)TCGA-AC-A23H-01Breastbreast invasive carcinomaFemale>=65I/IIUnknownUnknownPD
CLSPNSNVMissense_Mutationnovelc.908A>Cp.Asn303Thrp.N303TQ9HAW4protein_codingtolerated(0.14)benign(0.337)TCGA-EW-A1J3-01Breastbreast invasive carcinomaFemale<65I/IIChemotherapycarboplatinSD
CLSPNSNVMissense_Mutationc.1567N>Ap.Glu523Lysp.E523KQ9HAW4protein_codingtolerated(0.26)possibly_damaging(0.636)TCGA-GM-A2D9-01Breastbreast invasive carcinomaFemale>=65I/IIHormone TherapyarimidexSD
CLSPNSNVMissense_Mutationc.3929N>Gp.Ser1310Cysp.S1310CQ9HAW4protein_codingdeleterious(0.03)benign(0.428)TCGA-GM-A2DO-01Breastbreast invasive carcinomaFemale<65I/IIHormone TherapytamoxiphenCR
CLSPNinsertionIn_Frame_Insnovelc.2301_2302insTCCGCCCGCCTCGGCCTCCCGp.Thr767_Lys768insSerAlaArgLeuGlyLeuProp.T767_K768insSARLGLPQ9HAW4protein_codingTCGA-A7-A0CJ-01Breastbreast invasive carcinomaFemale<65I/IIChemotherapycytoxanSD
CLSPNinsertionFrame_Shift_Insnovelc.2352_2353insAGCTATCATTCCTTGGTGACACATCTTTTCCTTGTTGp.Gln787HisfsTer50p.Q787Hfs*50Q9HAW4protein_codingTCGA-A8-A09C-01Breastbreast invasive carcinomaFemale>=65I/IIUnknownUnknownSD
CLSPNdeletionFrame_Shift_Delc.3902delNp.Lys1301SerfsTer4p.K1301Sfs*4Q9HAW4protein_codingTCGA-A8-A0AB-01Breastbreast invasive carcinomaFemale<65I/IIChemotherapy5-fluorouracilCR
CLSPNinsertionNonsense_Mutationnovelc.2862_2863insTGGTCTTGGTGACACAGGTCAp.Ser954_Thr955insTrpSerTrpTerHisArgSerp.S954_T955insWSW*HRSQ9HAW4protein_codingTCGA-AO-A03R-01Breastbreast invasive carcinomaFemale<65I/IIChemotherapydoxorubicinSD
CLSPNinsertionNonsense_Mutationnovelc.2860_2861insGAGGTCAGGAGTTCAAGACCAGp.Ser954Terp.S954*Q9HAW4protein_codingTCGA-AO-A03R-01Breastbreast invasive carcinomaFemale<65I/IIChemotherapydoxorubicinSD
CLSPNinsertionFrame_Shift_Insnovelc.3573_3574insTCCACCTGCCTCTGCCTCCCAAAGTGTTGGGp.Ile1192SerfsTer14p.I1192Sfs*14Q9HAW4protein_codingTCGA-AR-A0TY-01Breastbreast invasive carcinomaFemale<65I/IIUnspecificPaclitaxelPD
Page: 1 2 3 4 5 6 7 8 9 10 11 12 13 14 

Top

Related drugs of malignant transformation related genes

check buttonIdentification of chemicals and drugs interact with genes involved in malignant transfromation
(DGIdb 4.0)
Entrez IDSymbolCategoryInteraction TypesDrug Claim NameDrug NamePMIDs
Page: 1