Schematic overview of the cellular and molecular mechanisms involved in the cancer progression, including the proposed cellular and molecular mechanisms in cancer cells trajectory. AT1: alveolar type 1 cells; AT2: alveolar type 2 cells; AAH: atypical adenomatous hyperplasia; AIS: adenocarcinoma in situ; MIA: minimally invasive adenocarcinoma; IA: invasive adenocarcinoma; EMT: epithelial-mesenchymal transition

Home

Download

Statistics

Help

Contact

Center for Computational Systems Medicine
leaf

Gene summary

leaf

Malignant transformation analysis

leaf

Malignant transformation related pathway analysis

leaf

Cell-cell communication analysis

leaf

Single-cell gene regulatory network inference analysis

leaf

Somatic mutation of malignant transformation related genes

leaf

Related drugs of malignant transformation related genes

Gene: CLPX

Gene summary for CLPX

check button Gene summary.

Gene informationSpeciesHuman
Gene symbol

CLPX

Gene ID

10845

Gene namecaseinolytic mitochondrial matrix peptidase chaperone subunit X
Gene AliasEPP2
Cytomap15q22.31
Gene Typeprotein-coding
GO ID

GO:0006457

UniProtAcc

A0A024R5X7


Top

Malignant transformation analysis

check button Identification of the aberrant gene expression in precancerous and cancerous lesions by comparing the gene expression of stem-like cells in diseased tissues with normal stem cells
check button Malignant transformation involving gene list.
Entrez IDSymbolReplicatesSpeciesOrganTissueAdj P-valueLog2FCMalignancy
10845CLPXLZE4THumanEsophagusESCC3.62e-093.13e-010.0811
10845CLPXLZE7THumanEsophagusESCC6.10e-064.48e-010.0667
10845CLPXLZE22THumanEsophagusESCC1.39e-022.33e-010.068
10845CLPXLZE24THumanEsophagusESCC1.75e-081.89e-010.0596
10845CLPXP2T-EHumanEsophagusESCC1.39e-254.06e-010.1177
10845CLPXP4T-EHumanEsophagusESCC3.03e-203.79e-010.1323
10845CLPXP5T-EHumanEsophagusESCC6.01e-112.82e-010.1327
10845CLPXP8T-EHumanEsophagusESCC1.30e-203.01e-010.0889
10845CLPXP9T-EHumanEsophagusESCC2.98e-142.42e-010.1131
10845CLPXP10T-EHumanEsophagusESCC7.00e-274.10e-010.116
10845CLPXP11T-EHumanEsophagusESCC1.84e-043.51e-010.1426
10845CLPXP12T-EHumanEsophagusESCC1.63e-305.48e-010.1122
10845CLPXP15T-EHumanEsophagusESCC4.73e-234.59e-010.1149
10845CLPXP16T-EHumanEsophagusESCC1.15e-285.81e-010.1153
10845CLPXP19T-EHumanEsophagusESCC2.59e-073.32e-010.1662
10845CLPXP20T-EHumanEsophagusESCC1.42e-101.42e-010.1124
10845CLPXP21T-EHumanEsophagusESCC1.18e-071.90e-010.1617
10845CLPXP22T-EHumanEsophagusESCC6.81e-122.73e-010.1236
10845CLPXP23T-EHumanEsophagusESCC1.16e-125.18e-010.108
10845CLPXP24T-EHumanEsophagusESCC1.81e-122.70e-010.1287
Page: 1 2 3 4 5 

check button Transcriptomic changes along malignancy continuum.
TissueExpression DynamicsAbbreviation
EsophagusThe image shows the transcriptomic changes along malignancy continuum.log2FC in expression of this searched gene in stem-like cells from each diseased tissue sample relative to stem-like cells in normal samples in each tissue plotted against the malignancy continuum. Samples are colored based on if they are from different disease stage.
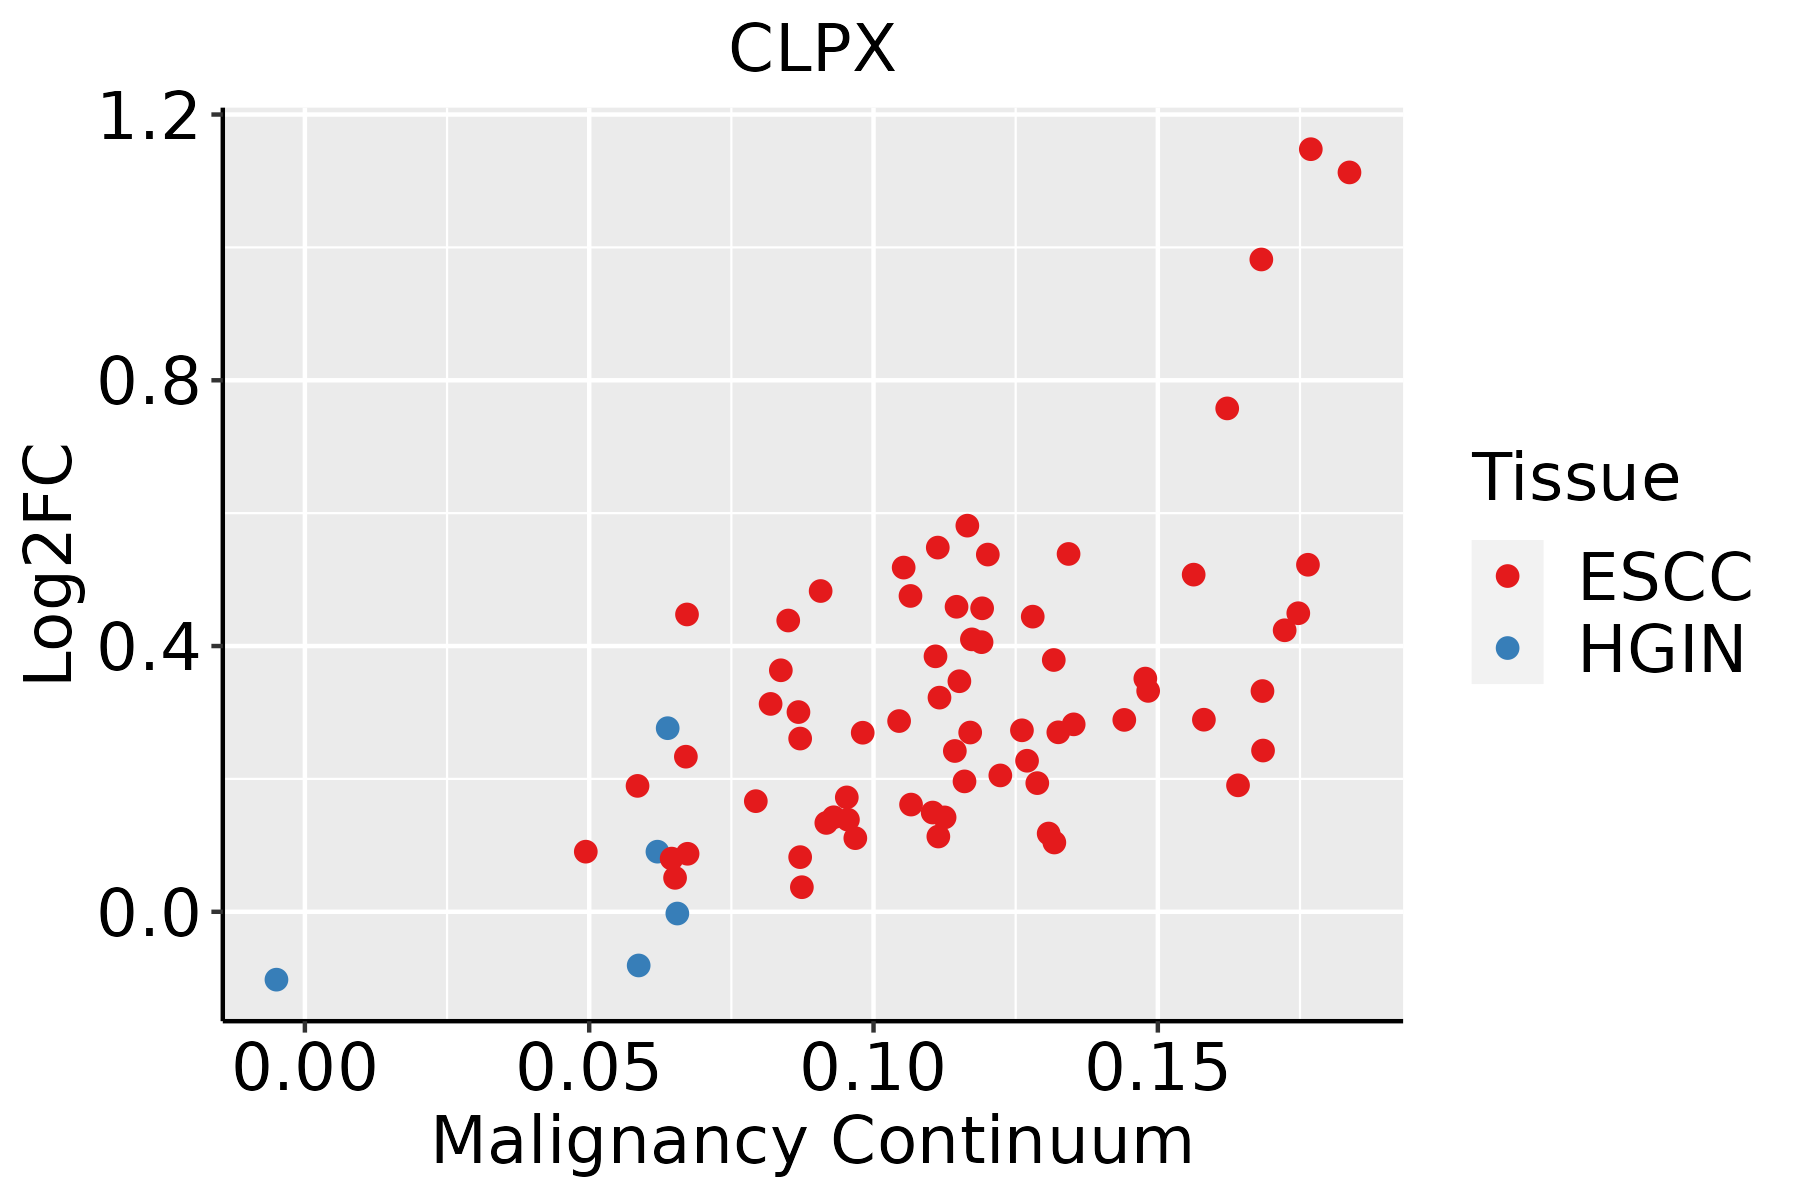
ESCC: Esophageal squamous cell carcinoma
HGIN: High-grade intraepithelial neoplasias
LGIN: Low-grade intraepithelial neoplasias
LiverThe image shows the transcriptomic changes along malignancy continuum.log2FC in expression of this searched gene in stem-like cells from each diseased tissue sample relative to stem-like cells in normal samples in each tissue plotted against the malignancy continuum. Samples are colored based on if they are from different disease stage.
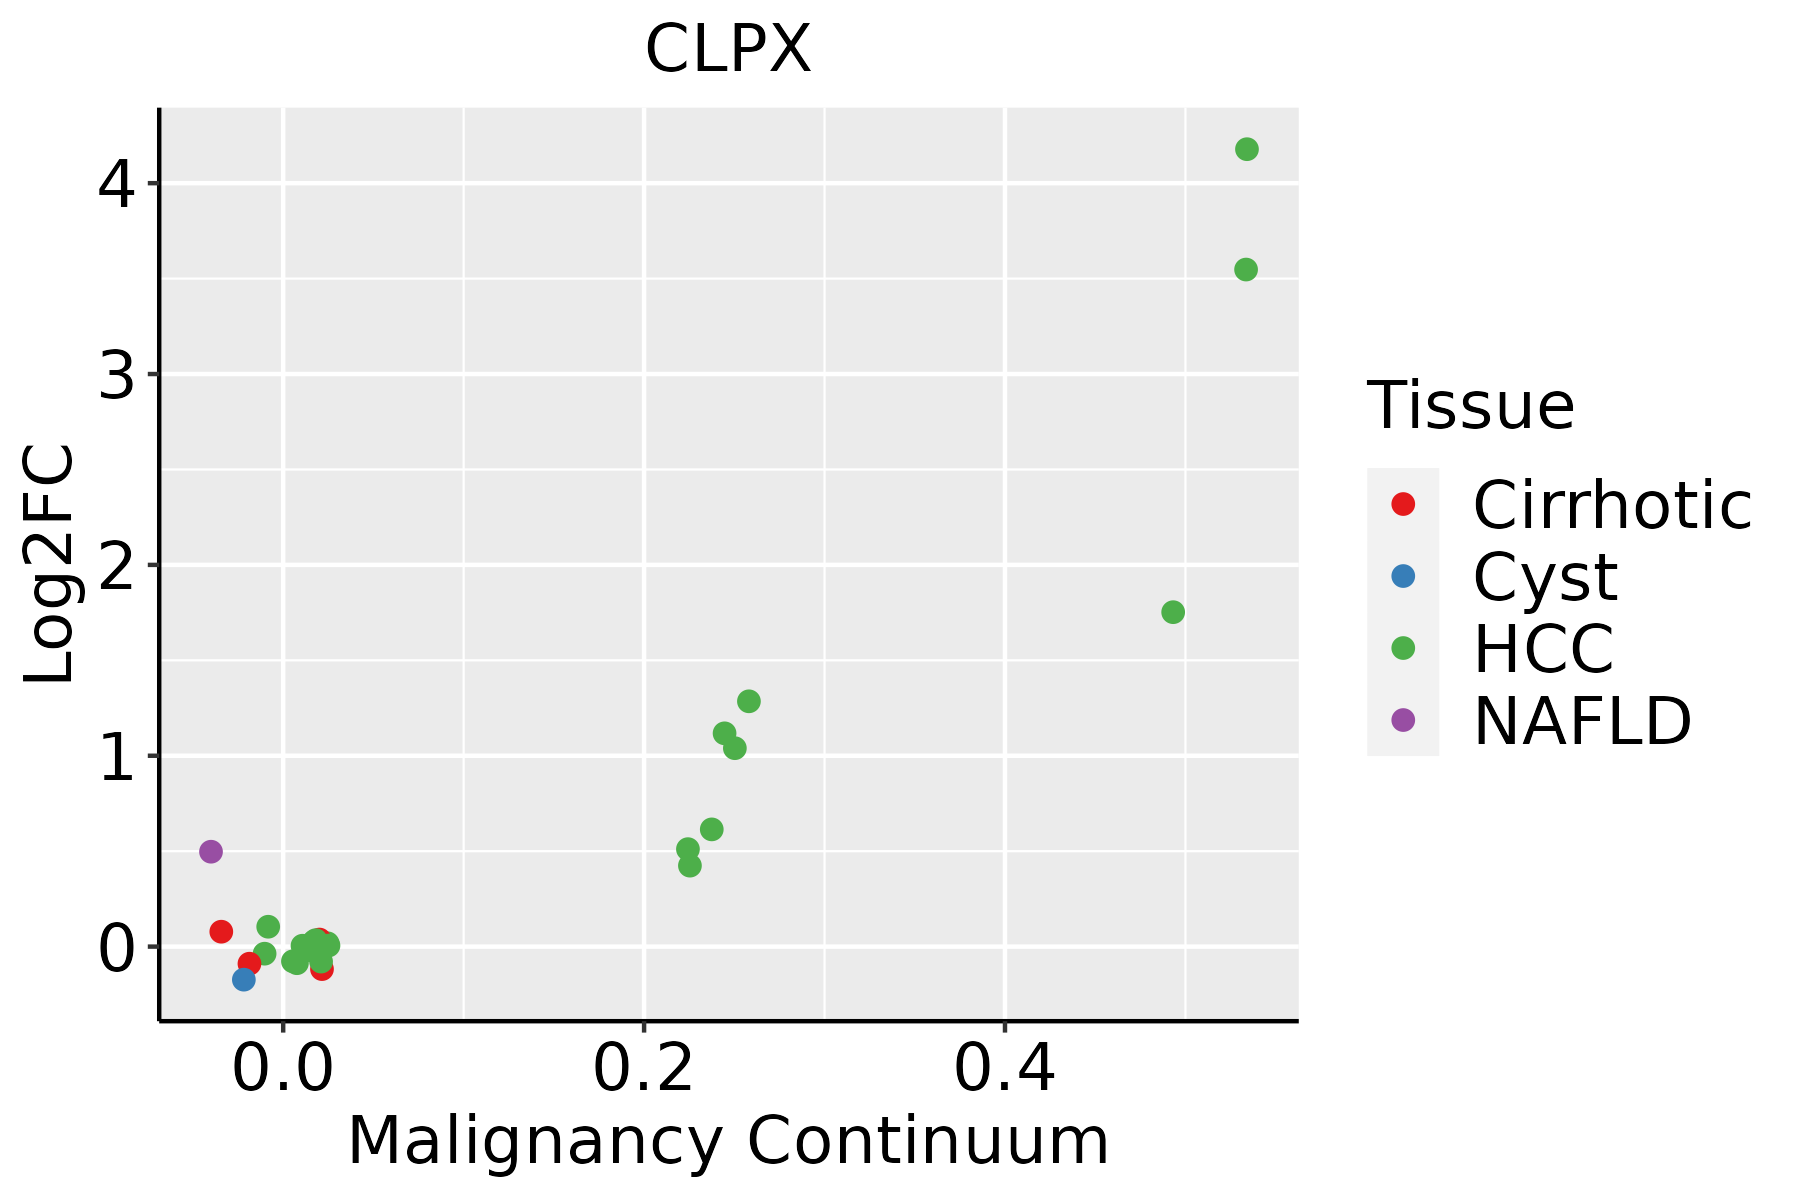
HCC: Hepatocellular carcinoma
NAFLD: Non-alcoholic fatty liver disease
Oral CavityThe image shows the transcriptomic changes along malignancy continuum.log2FC in expression of this searched gene in stem-like cells from each diseased tissue sample relative to stem-like cells in normal samples in each tissue plotted against the malignancy continuum. Samples are colored based on if they are from different disease stage.
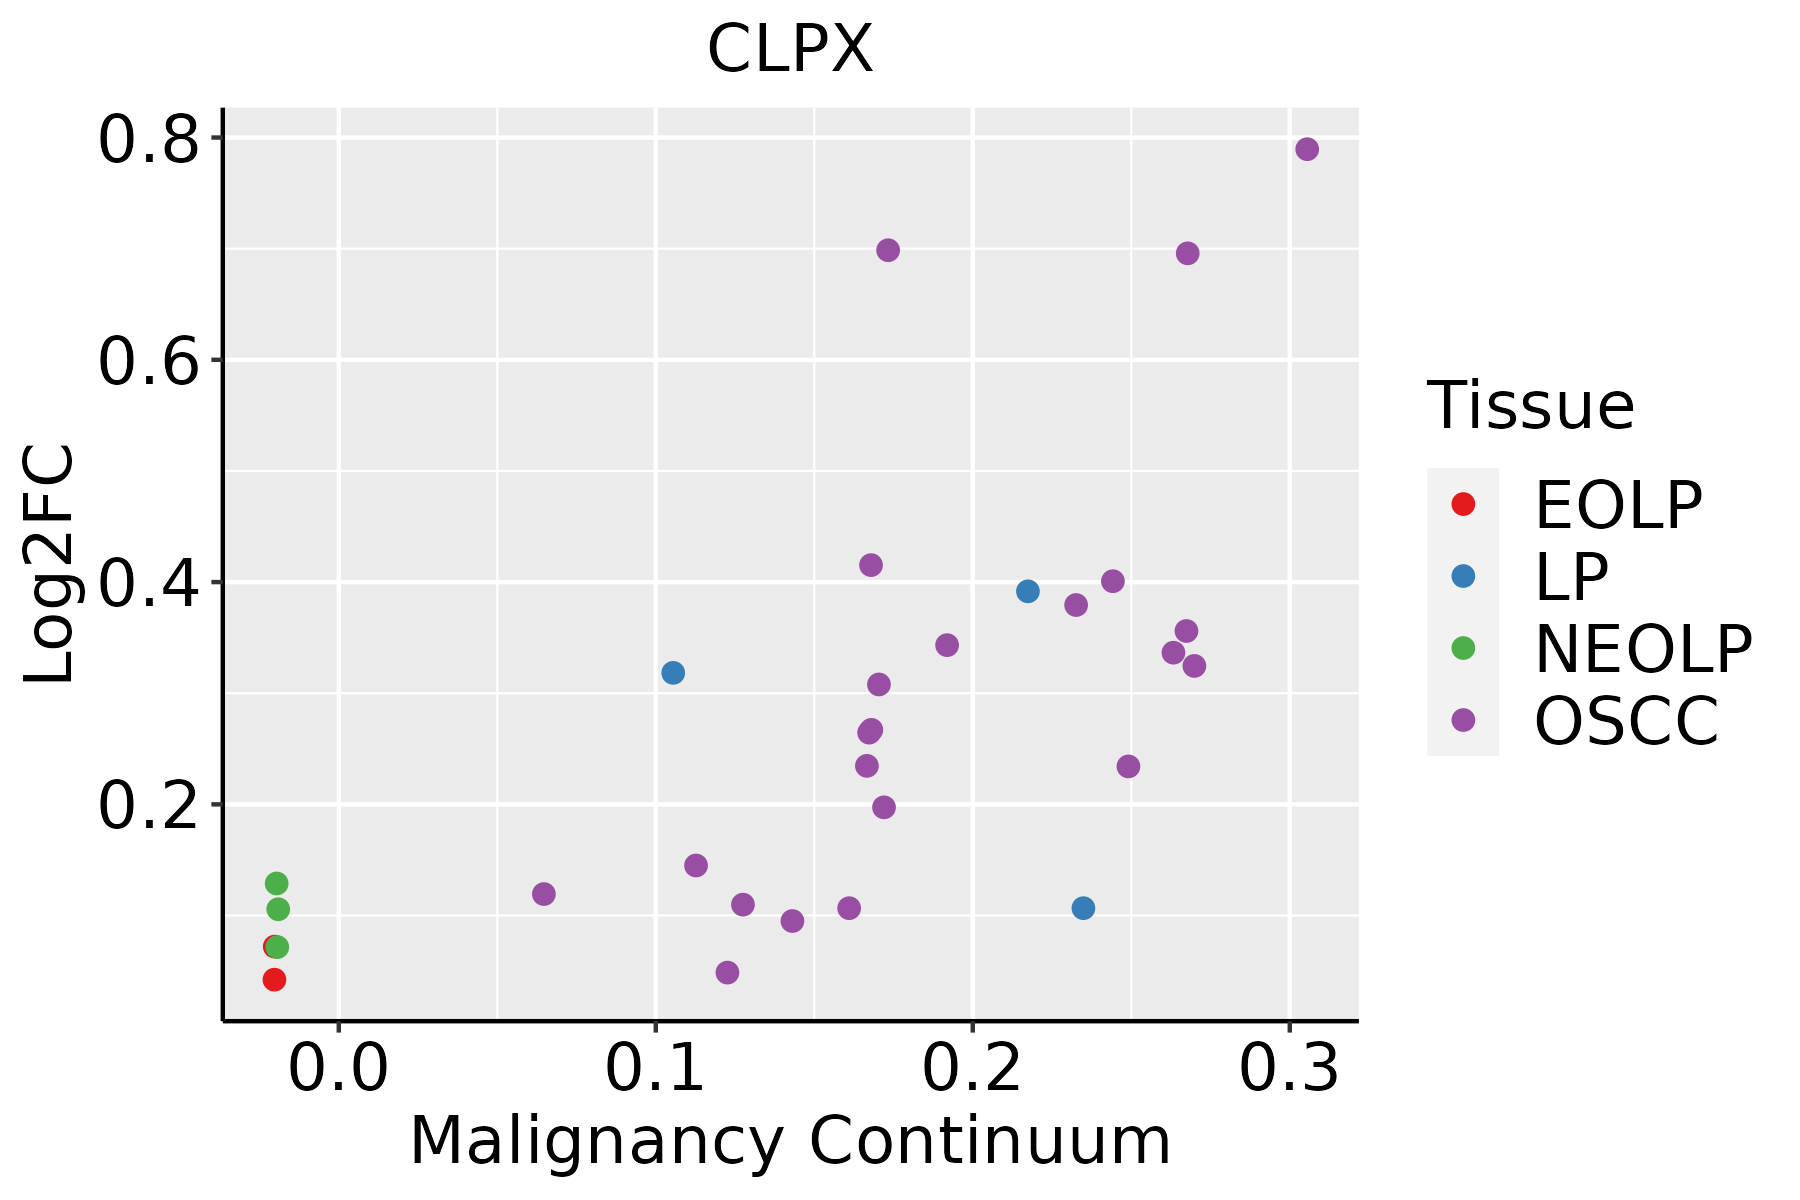
EOLP: Erosive Oral lichen planus
LP: leukoplakia
NEOLP: Non-erosive oral lichen planus
OSCC: Oral squamous cell carcinoma
SkinThe image shows the transcriptomic changes along malignancy continuum.log2FC in expression of this searched gene in stem-like cells from each diseased tissue sample relative to stem-like cells in normal samples in each tissue plotted against the malignancy continuum. Samples are colored based on if they are from different disease stage.AK: Actinic keratosis
cSCC: Cutaneous squamous cell carcinoma
SCCIS:squamous cell carcinoma in situ
ThyroidThe image shows the transcriptomic changes along malignancy continuum.log2FC in expression of this searched gene in stem-like cells from each diseased tissue sample relative to stem-like cells in normal samples in each tissue plotted against the malignancy continuum. Samples are colored based on if they are from different disease stage.
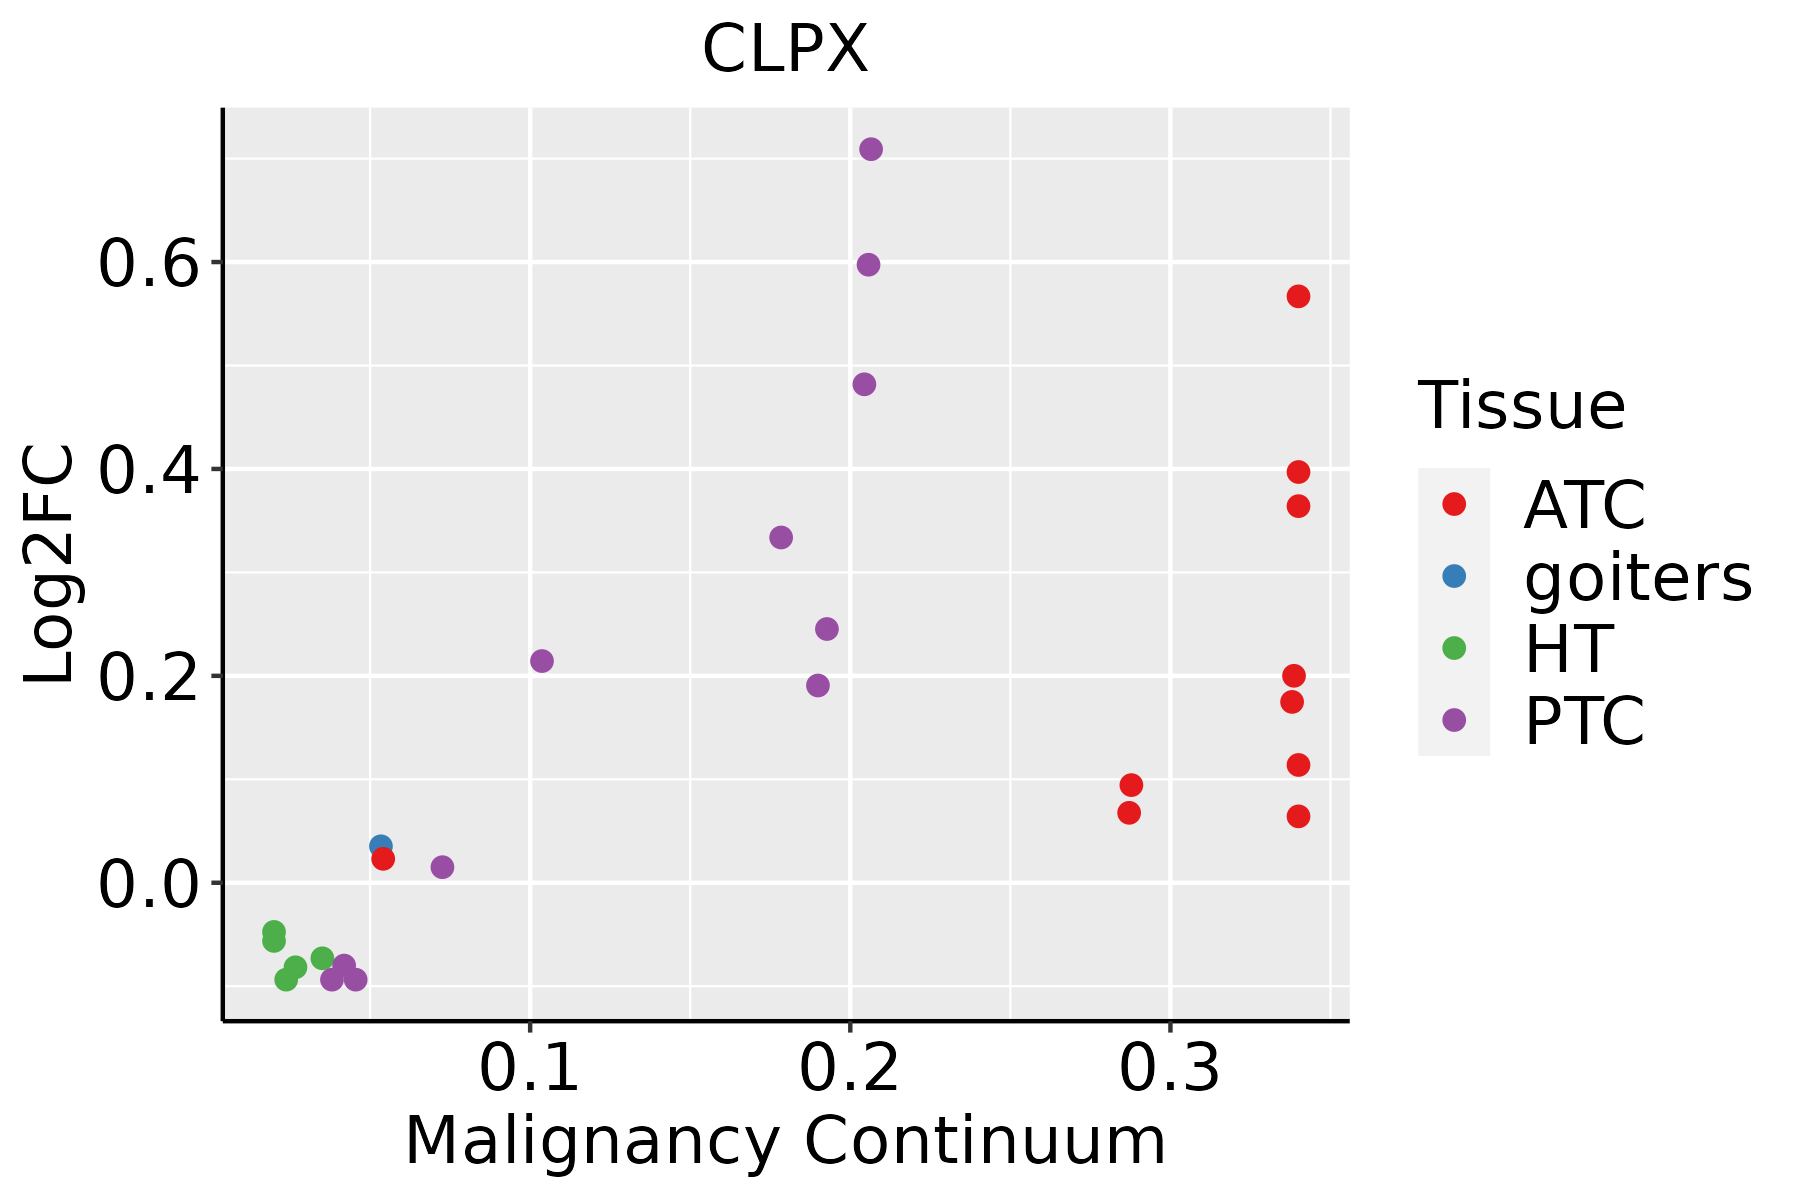
ATC: Anaplastic thyroid cancer
HT: Hashimoto's thyroiditis
PTC: Papillary thyroid cancer
∗log2FC in expression of this searched gene in stem-like cells from each diseased tissue sample relative to stem-like cells in normal samples in each tissue plotted against the malignancy continuum. Samples are colored based on if they are from different disease stage.

Top

Malignant transformation related pathway analysis

check buttonFind out the enriched GO biological processes and KEGG pathways involved in transition from healthy to precancer to cancer
check button Figure of enriched GO biological processes.
TissueDisease StageEnriched GO biological Processes
ColorectumADGO analysis - Figure of enriched GO biological processes: Top 15 enriched GO BP terms are showed in the bar plot of each disease state in each tissue. Each row represents a significant GO biological process which is colored according to the -log10(p.adjust).
ColorectumSERGO analysis - Figure of enriched GO biological processes: Top 15 enriched GO BP terms are showed in the bar plot of each disease state in each tissue. Each row represents a significant GO biological process which is colored according to the -log10(p.adjust).
ColorectumMSSGO analysis - Figure of enriched GO biological processes: Top 15 enriched GO BP terms are showed in the bar plot of each disease state in each tissue. Each row represents a significant GO biological process which is colored according to the -log10(p.adjust).
ColorectumMSI-HGO analysis - Figure of enriched GO biological processes: Top 15 enriched GO BP terms are showed in the bar plot of each disease state in each tissue. Each row represents a significant GO biological process which is colored according to the -log10(p.adjust).
ColorectumFAPGO analysis - Figure of enriched GO biological processes: Top 15 enriched GO BP terms are showed in the bar plot of each disease state in each tissue. Each row represents a significant GO biological process which is colored according to the -log10(p.adjust).
∗Top 15 enriched GO BP terms are showed in the bar plot of each disease state in each tissue. Each row represents a significant GO biological process which is colored according to the -log10(p.adjust).
Page: 1 2 3 4 5 6 7 8 9 

check button Enriched GO biological processes.
GO IDTissueDisease StageDescriptionGene RatioBg Ratiopvaluep.adjustCount
GO:0006457110EsophagusESCCprotein folding163/8552212/187231.13e-201.74e-18163
GO:0045862111EsophagusESCCpositive regulation of proteolysis256/8552372/187237.88e-209.43e-18256
GO:0046034111EsophagusESCCATP metabolic process189/8552277/187231.99e-141.04e-12189
GO:0010952111EsophagusESCCpositive regulation of peptidase activity133/8552197/187234.31e-101.14e-08133
GO:0052547111EsophagusESCCregulation of peptidase activity275/8552461/187237.54e-101.88e-08275
GO:00458627LiverNAFLDpositive regulation of proteolysis65/1882372/187236.58e-062.29e-0465
GO:00525477LiverNAFLDregulation of peptidase activity72/1882461/187231.03e-042.03e-0372
GO:00460347LiverNAFLDATP metabolic process46/1882277/187234.55e-046.69e-0346
GO:004603422LiverHCCATP metabolic process198/7958277/187238.30e-231.55e-20198
GO:000645712LiverHCCprotein folding160/7958212/187231.07e-221.88e-20160
GO:004586222LiverHCCpositive regulation of proteolysis232/7958372/187235.66e-153.98e-13232
GO:005254722LiverHCCregulation of peptidase activity247/7958461/187238.28e-071.27e-05247
GO:001095212LiverHCCpositive regulation of peptidase activity110/7958197/187231.04e-048.98e-04110
GO:000645718Oral cavityOSCCprotein folding154/7305212/187231.89e-234.60e-21154
GO:004586220Oral cavityOSCCpositive regulation of proteolysis236/7305372/187236.53e-221.38e-19236
GO:005254720Oral cavityOSCCregulation of peptidase activity255/7305461/187235.78e-132.75e-11255
GO:004603420Oral cavityOSCCATP metabolic process166/7305277/187231.16e-125.12e-11166
GO:001095220Oral cavityOSCCpositive regulation of peptidase activity123/7305197/187232.12e-117.21e-10123
GO:0006457111SkincSCCprotein folding131/4864212/187232.96e-281.32e-25131
GO:0046034112SkincSCCATP metabolic process142/4864277/187231.38e-191.96e-17142
Page: 1 2 

check button Enriched KEGG pathways.
Pathway IDTissueDisease StageDescriptionGene RatioBg Ratiopvaluep.adjustqvalueCount
Page: 1 

Top

Cell-cell communication analysis

check buttonIdentification of potential cell-cell interactions between two cell types and their ligand-receptor pairs for different disease states
LigandReceptorLRpairPathwayTissueDisease Stage
Page: 1 

Top

Single-cell gene regulatory network inference analysis

check buttonFind out the significant the regulons (TFs) and the target genes of each regulon across cell types for different disease states
TFCell TypeTissueDisease StageTarget GeneRSSRegulon Activity
∗The dot plots of a searched regulon are shown for all cell subpopulations in each disease state of each tissue based on the regulon specific score inferred using pySCENIC and by calculating the average expression.
Page: 1 

Top

Somatic mutation of malignant transformation related genes

check buttonAnnotation of somatic variants for genes involved in malignant transformation
Hugo SymbolVariant ClassVariant ClassificationdbSNP RSHGVScHGVSpHGVSp ShortSWISSPROTBIOTYPESIFTPolyPhenTumor Sample BarcodeTissueHistologySexAgeStageTherapy TypesDrugsOutcome
CLPXSNVMissense_Mutationc.839A>Tp.Asp280Valp.D280VO76031protein_codingtolerated(0.23)benign(0.011)TCGA-A8-A06Y-01Breastbreast invasive carcinomaFemale>=65I/IIHormone TherapyanastrozolePD
CLPXSNVMissense_Mutationnovelc.1075G>Ap.Glu359Lysp.E359KO76031protein_codingdeleterious(0)probably_damaging(0.996)TCGA-AC-A5XS-01Breastbreast invasive carcinomaFemale>=65I/IIHormone TherapyfemaraSD
CLPXSNVMissense_Mutationc.599N>Cp.Arg200Thrp.R200TO76031protein_codingdeleterious(0)probably_damaging(0.999)TCGA-BH-A0BP-01Breastbreast invasive carcinomaFemale>=65I/IIUnknownUnknownSD
CLPXSNVMissense_Mutationc.278N>Gp.Ser93Cysp.S93CO76031protein_codingdeleterious(0.01)possibly_damaging(0.478)TCGA-C8-A27B-01Breastbreast invasive carcinomaFemale<65I/IIChemotherapy5-fluorouracilCR
CLPXinsertionNonsense_Mutationnovelc.524_525insGATAGGGCCAGAGATAGTAAGGTGTATCp.Tyr175Terp.Y175*O76031protein_codingTCGA-A8-A08H-01Breastbreast invasive carcinomaFemale>=65I/IIUnknownUnknownSD
CLPXinsertionFrame_Shift_Insrs747704551c.1721_1722insCAAACCAATAAp.Glu574AspfsTer24p.E574Dfs*24O76031protein_codingTCGA-DS-A1OC-01Cervixcervical & endocervical cancerFemale<65I/IIChemotherapygemcitabineSD
CLPXSNVMissense_Mutationc.23N>Ap.Thr8Asnp.T8NO76031protein_codingtolerated_low_confidence(0.13)benign(0.059)TCGA-A6-A566-01Colorectumcolon adenocarcinomaFemale<65III/IVChemotherapyoxaliplatinPD
CLPXSNVMissense_Mutationrs771233943c.1429C>Tp.Arg477Trpp.R477WO76031protein_codingdeleterious(0.03)probably_damaging(0.964)TCGA-AA-3510-01Colorectumcolon adenocarcinomaMale>=65I/IIUnknownUnknownSD
CLPXSNVMissense_Mutationc.1091G>Ap.Gly364Aspp.G364DO76031protein_codingdeleterious(0)probably_damaging(0.978)TCGA-AA-3672-01Colorectumcolon adenocarcinomaFemale>=65III/IVUnknownUnknownSD
CLPXSNVMissense_Mutationrs771233943c.1429N>Tp.Arg477Trpp.R477WO76031protein_codingdeleterious(0.03)probably_damaging(0.964)TCGA-AA-A00N-01Colorectumcolon adenocarcinomaMale>=65I/IIUnknownUnknownPD
Page: 1 2 3 4 5 6 

Top

Related drugs of malignant transformation related genes

check buttonIdentification of chemicals and drugs interact with genes involved in malignant transfromation
(DGIdb 4.0)
Entrez IDSymbolCategoryInteraction TypesDrug Claim NameDrug NamePMIDs
Page: 1