Schematic overview of the cellular and molecular mechanisms involved in the cancer progression, including the proposed cellular and molecular mechanisms in cancer cells trajectory. AT1: alveolar type 1 cells; AT2: alveolar type 2 cells; AAH: atypical adenomatous hyperplasia; AIS: adenocarcinoma in situ; MIA: minimally invasive adenocarcinoma; IA: invasive adenocarcinoma; EMT: epithelial-mesenchymal transition

Home

Download

Statistics

Help

Contact

Center for Computational Systems Medicine
leaf

Gene summary

leaf

Malignant transformation analysis

leaf

Malignant transformation related pathway analysis

leaf

Cell-cell communication analysis

leaf

Single-cell gene regulatory network inference analysis

leaf

Somatic mutation of malignant transformation related genes

leaf

Related drugs of malignant transformation related genes

Gene: CLPTM1

Gene summary for CLPTM1

check button Gene summary.

Gene informationSpeciesHuman
Gene symbol

CLPTM1

Gene ID

1209

Gene nameCLPTM1 regulator of GABA type A receptor forward trafficking
Gene AliasCLPTM1
Cytomap19q13.32
Gene Typeprotein-coding
GO ID

GO:0001775

UniProtAcc

O96005


Top

Malignant transformation analysis

check button Identification of the aberrant gene expression in precancerous and cancerous lesions by comparing the gene expression of stem-like cells in diseased tissues with normal stem cells
check button Malignant transformation involving gene list.
Entrez IDSymbolReplicatesSpeciesOrganTissueAdj P-valueLog2FCMalignancy
1209CLPTM1HTA11_3410_2000001011HumanColorectumAD1.81e-021.72e-010.0155
1209CLPTM1HTA11_2487_2000001011HumanColorectumSER6.88e-085.07e-01-0.1808
1209CLPTM1HTA11_1938_2000001011HumanColorectumAD5.90e-034.20e-01-0.0811
1209CLPTM1HTA11_347_2000001011HumanColorectumAD3.56e-084.60e-01-0.1954
1209CLPTM1HTA11_83_2000001011HumanColorectumSER1.20e-034.58e-01-0.1526
1209CLPTM1HTA11_696_2000001011HumanColorectumAD1.11e-165.90e-01-0.1464
1209CLPTM1HTA11_866_2000001011HumanColorectumAD9.76e-062.97e-01-0.1001
1209CLPTM1HTA11_1391_2000001011HumanColorectumAD2.26e-136.30e-01-0.059
1209CLPTM1HTA11_546_2000001011HumanColorectumAD8.48e-045.48e-01-0.0842
1209CLPTM1HTA11_10711_2000001011HumanColorectumAD2.85e-023.44e-010.0338
1209CLPTM1HTA11_7696_3000711011HumanColorectumAD7.13e-246.59e-010.0674
1209CLPTM1HTA11_99999971662_82457HumanColorectumMSS1.26e-083.92e-010.3859
1209CLPTM1HTA11_99999974143_84620HumanColorectumMSS3.61e-022.75e-010.3005
1209CLPTM1A002-C-201HumanColorectumFAP3.68e-02-1.31e-010.0324
1209CLPTM1A002-C-116HumanColorectumFAP9.36e-06-1.24e-01-0.0452
1209CLPTM1LZE2THumanEsophagusESCC3.39e-049.01e-010.082
1209CLPTM1LZE4THumanEsophagusESCC5.05e-063.25e-010.0811
1209CLPTM1LZE5THumanEsophagusESCC1.66e-054.06e-010.0514
1209CLPTM1LZE7THumanEsophagusESCC2.89e-033.73e-010.0667
1209CLPTM1LZE8THumanEsophagusESCC7.60e-076.78e-020.067
Page: 1 2 3 4 5 6 7 

check button Transcriptomic changes along malignancy continuum.
TissueExpression DynamicsAbbreviation
Colorectum (GSE201348)The image shows the transcriptomic changes along malignancy continuum.log2FC in expression of this searched gene in stem-like cells from each diseased tissue sample relative to stem-like cells in normal samples in each tissue plotted against the malignancy continuum. Samples are colored based on if they are from different disease stage.FAP: Familial adenomatous polyposis
CRC: Colorectal cancer
Colorectum (HTA11)The image shows the transcriptomic changes along malignancy continuum.log2FC in expression of this searched gene in stem-like cells from each diseased tissue sample relative to stem-like cells in normal samples in each tissue plotted against the malignancy continuum. Samples are colored based on if they are from different disease stage.AD: Adenomas
SER: Sessile serrated lesions
MSI-H: Microsatellite-high colorectal cancer
MSS: Microsatellite stable colorectal cancer
EsophagusThe image shows the transcriptomic changes along malignancy continuum.log2FC in expression of this searched gene in stem-like cells from each diseased tissue sample relative to stem-like cells in normal samples in each tissue plotted against the malignancy continuum. Samples are colored based on if they are from different disease stage.
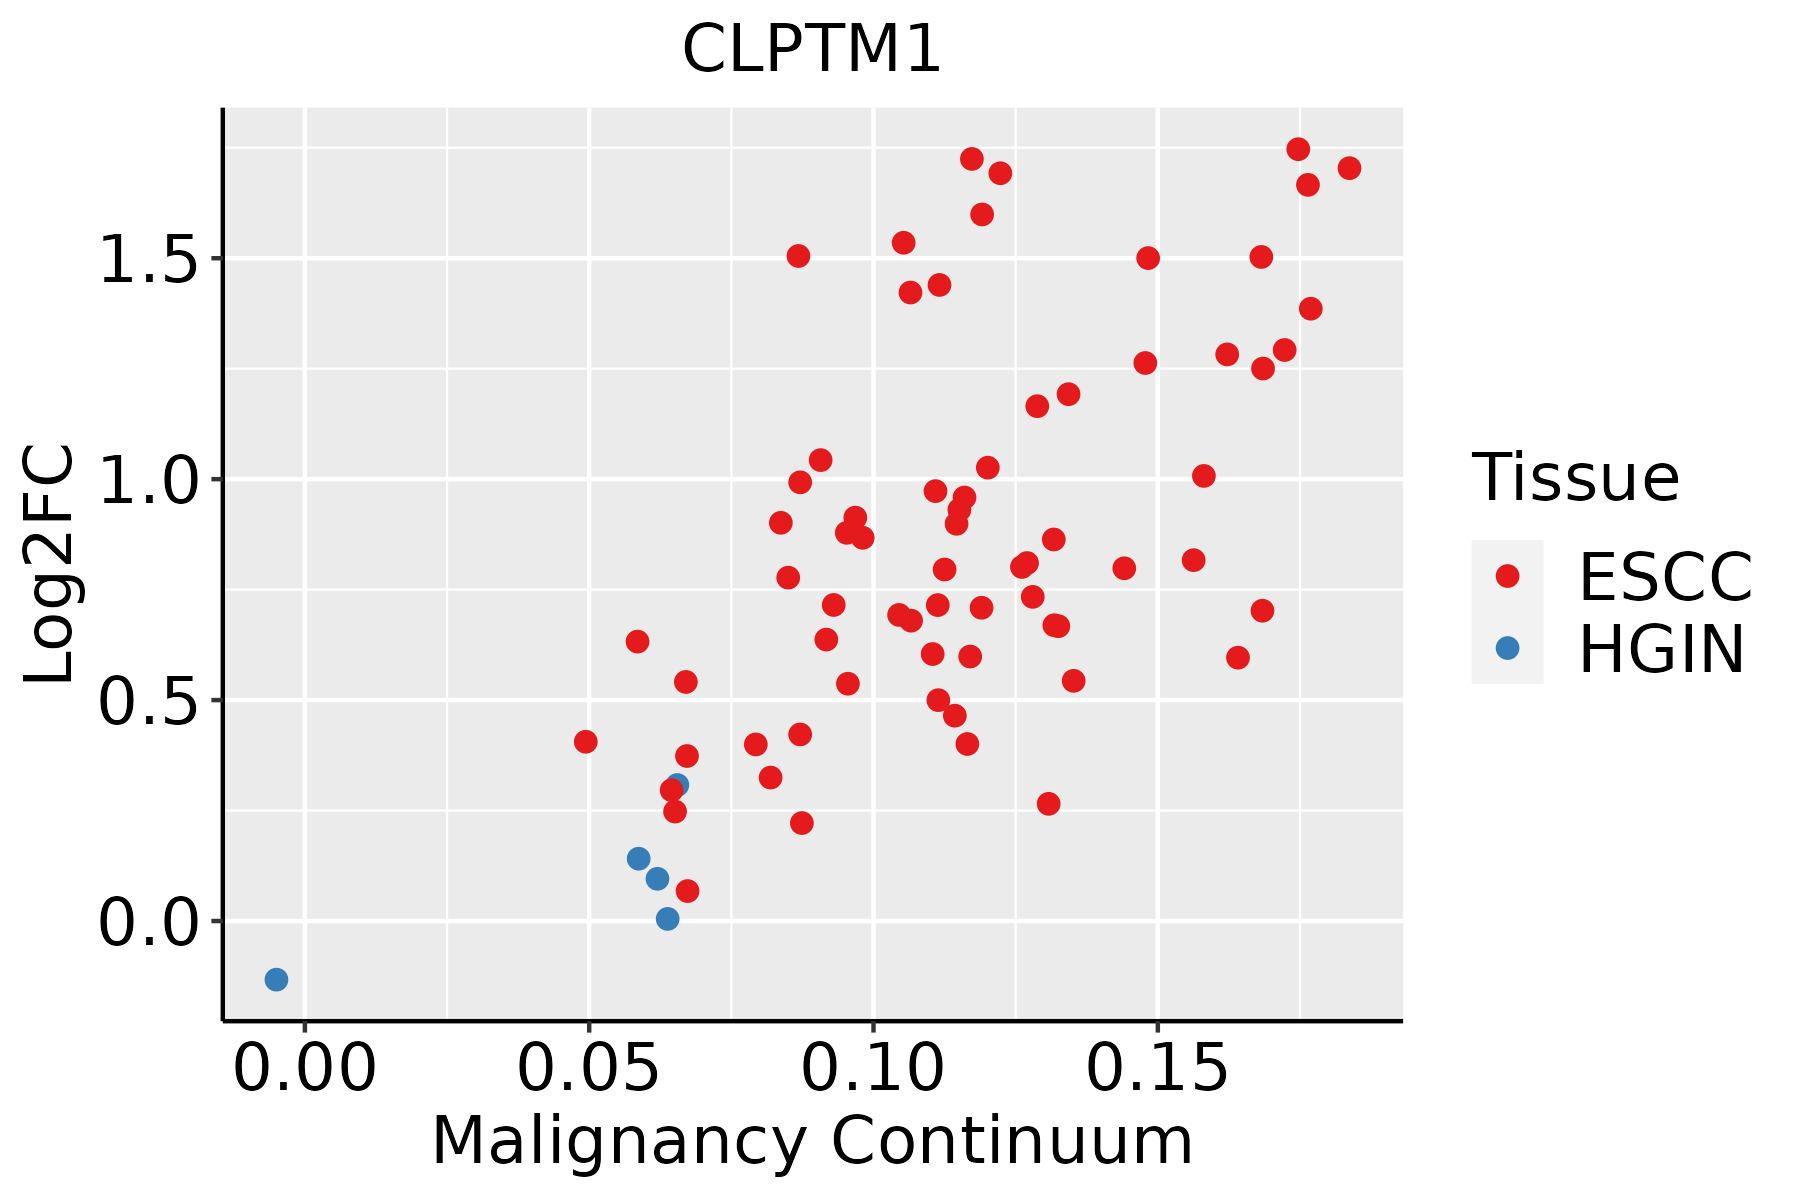
ESCC: Esophageal squamous cell carcinoma
HGIN: High-grade intraepithelial neoplasias
LGIN: Low-grade intraepithelial neoplasias
LiverThe image shows the transcriptomic changes along malignancy continuum.log2FC in expression of this searched gene in stem-like cells from each diseased tissue sample relative to stem-like cells in normal samples in each tissue plotted against the malignancy continuum. Samples are colored based on if they are from different disease stage.HCC: Hepatocellular carcinoma
NAFLD: Non-alcoholic fatty liver disease
Oral CavityThe image shows the transcriptomic changes along malignancy continuum.log2FC in expression of this searched gene in stem-like cells from each diseased tissue sample relative to stem-like cells in normal samples in each tissue plotted against the malignancy continuum. Samples are colored based on if they are from different disease stage.
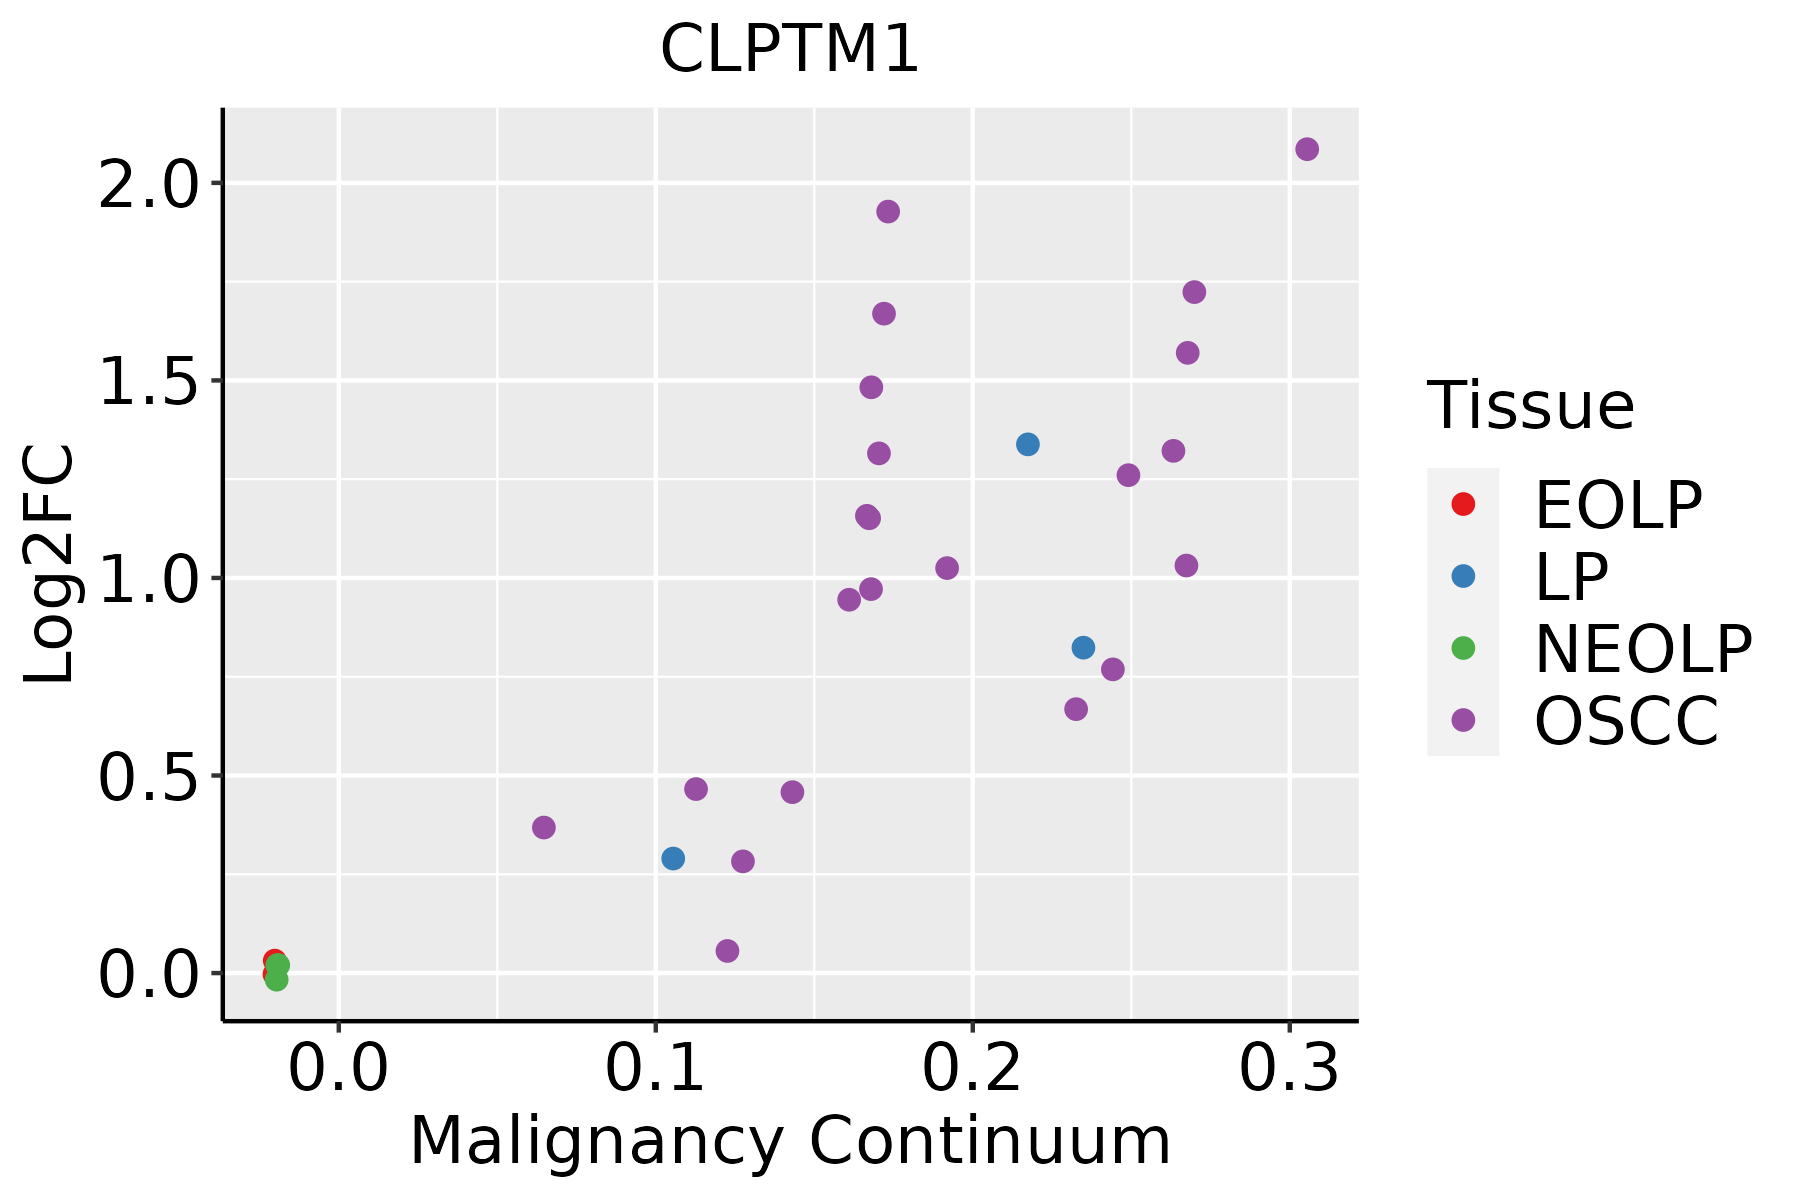
EOLP: Erosive Oral lichen planus
LP: leukoplakia
NEOLP: Non-erosive oral lichen planus
OSCC: Oral squamous cell carcinoma
SkinThe image shows the transcriptomic changes along malignancy continuum.log2FC in expression of this searched gene in stem-like cells from each diseased tissue sample relative to stem-like cells in normal samples in each tissue plotted against the malignancy continuum. Samples are colored based on if they are from different disease stage.
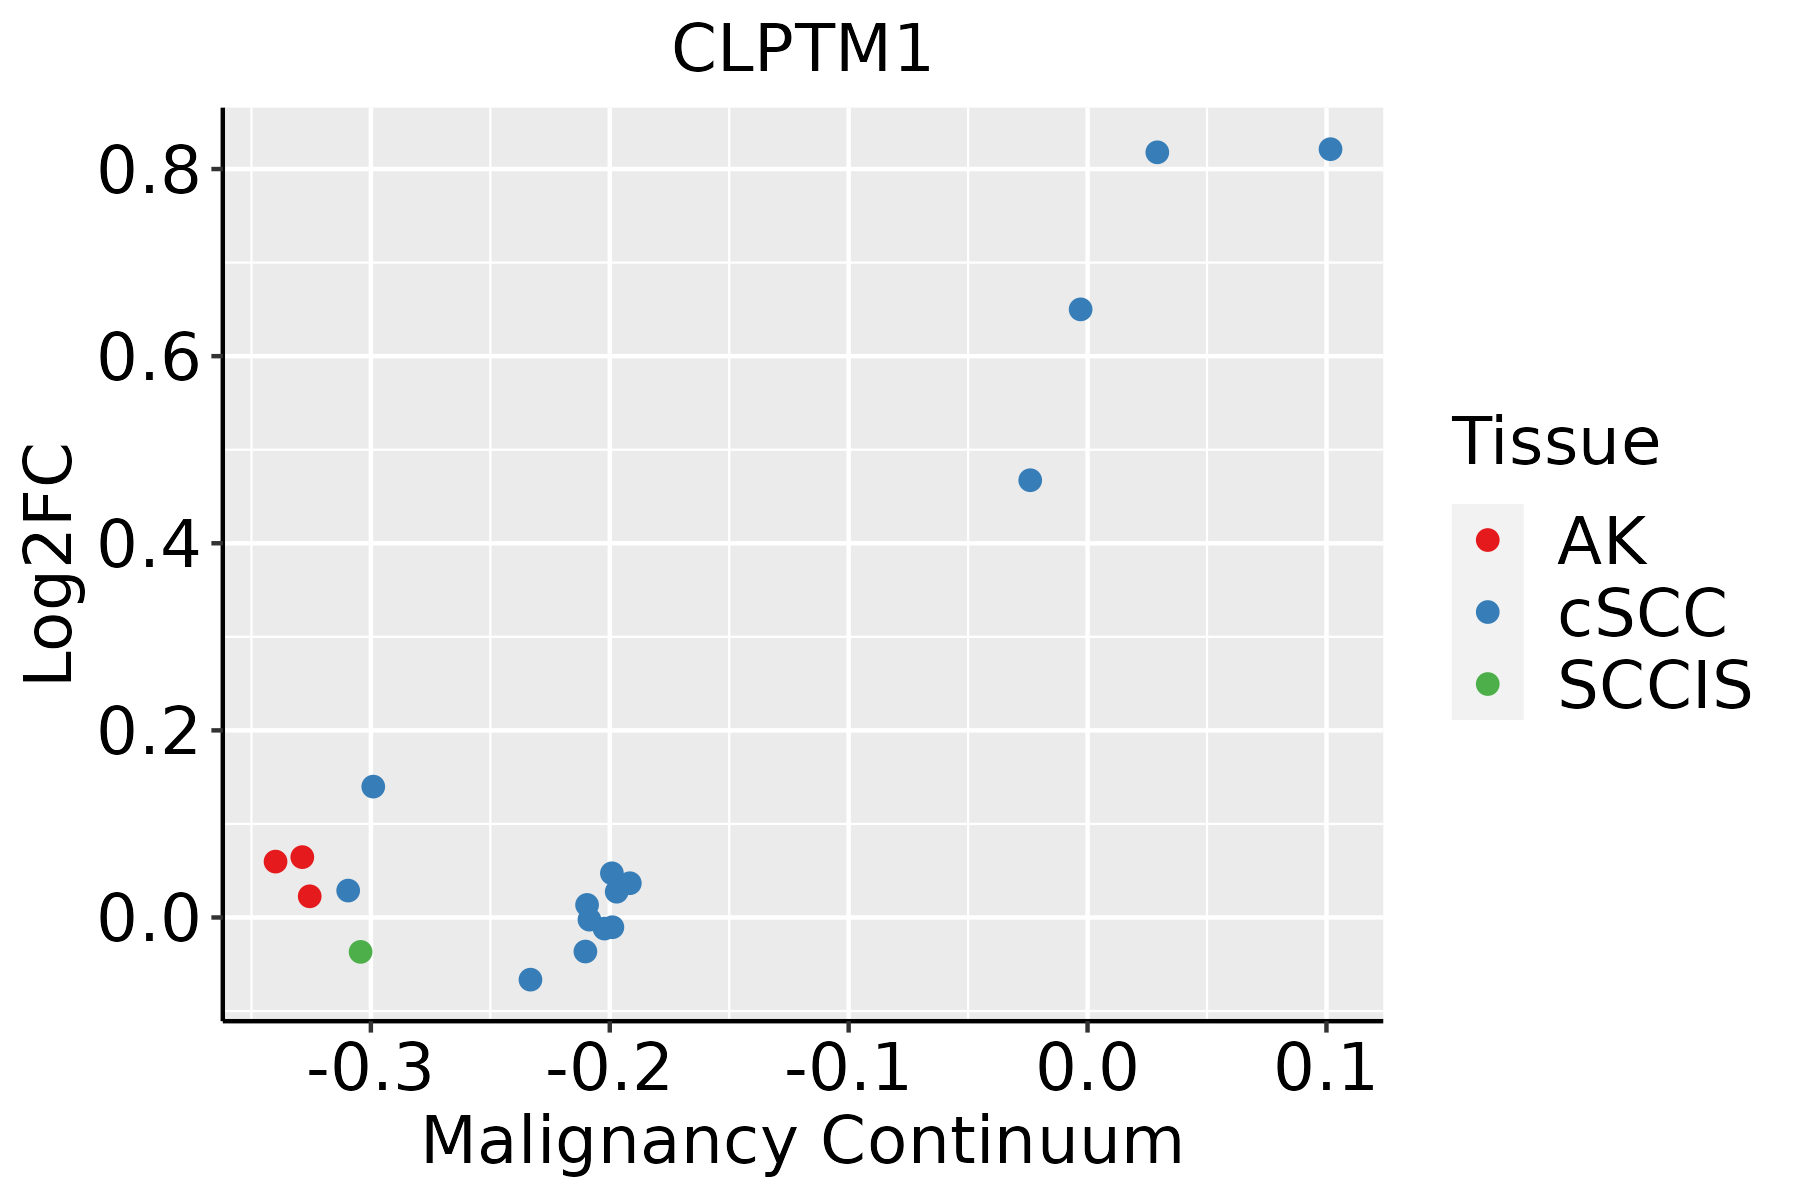
AK: Actinic keratosis
cSCC: Cutaneous squamous cell carcinoma
SCCIS:squamous cell carcinoma in situ
ThyroidThe image shows the transcriptomic changes along malignancy continuum.log2FC in expression of this searched gene in stem-like cells from each diseased tissue sample relative to stem-like cells in normal samples in each tissue plotted against the malignancy continuum. Samples are colored based on if they are from different disease stage.
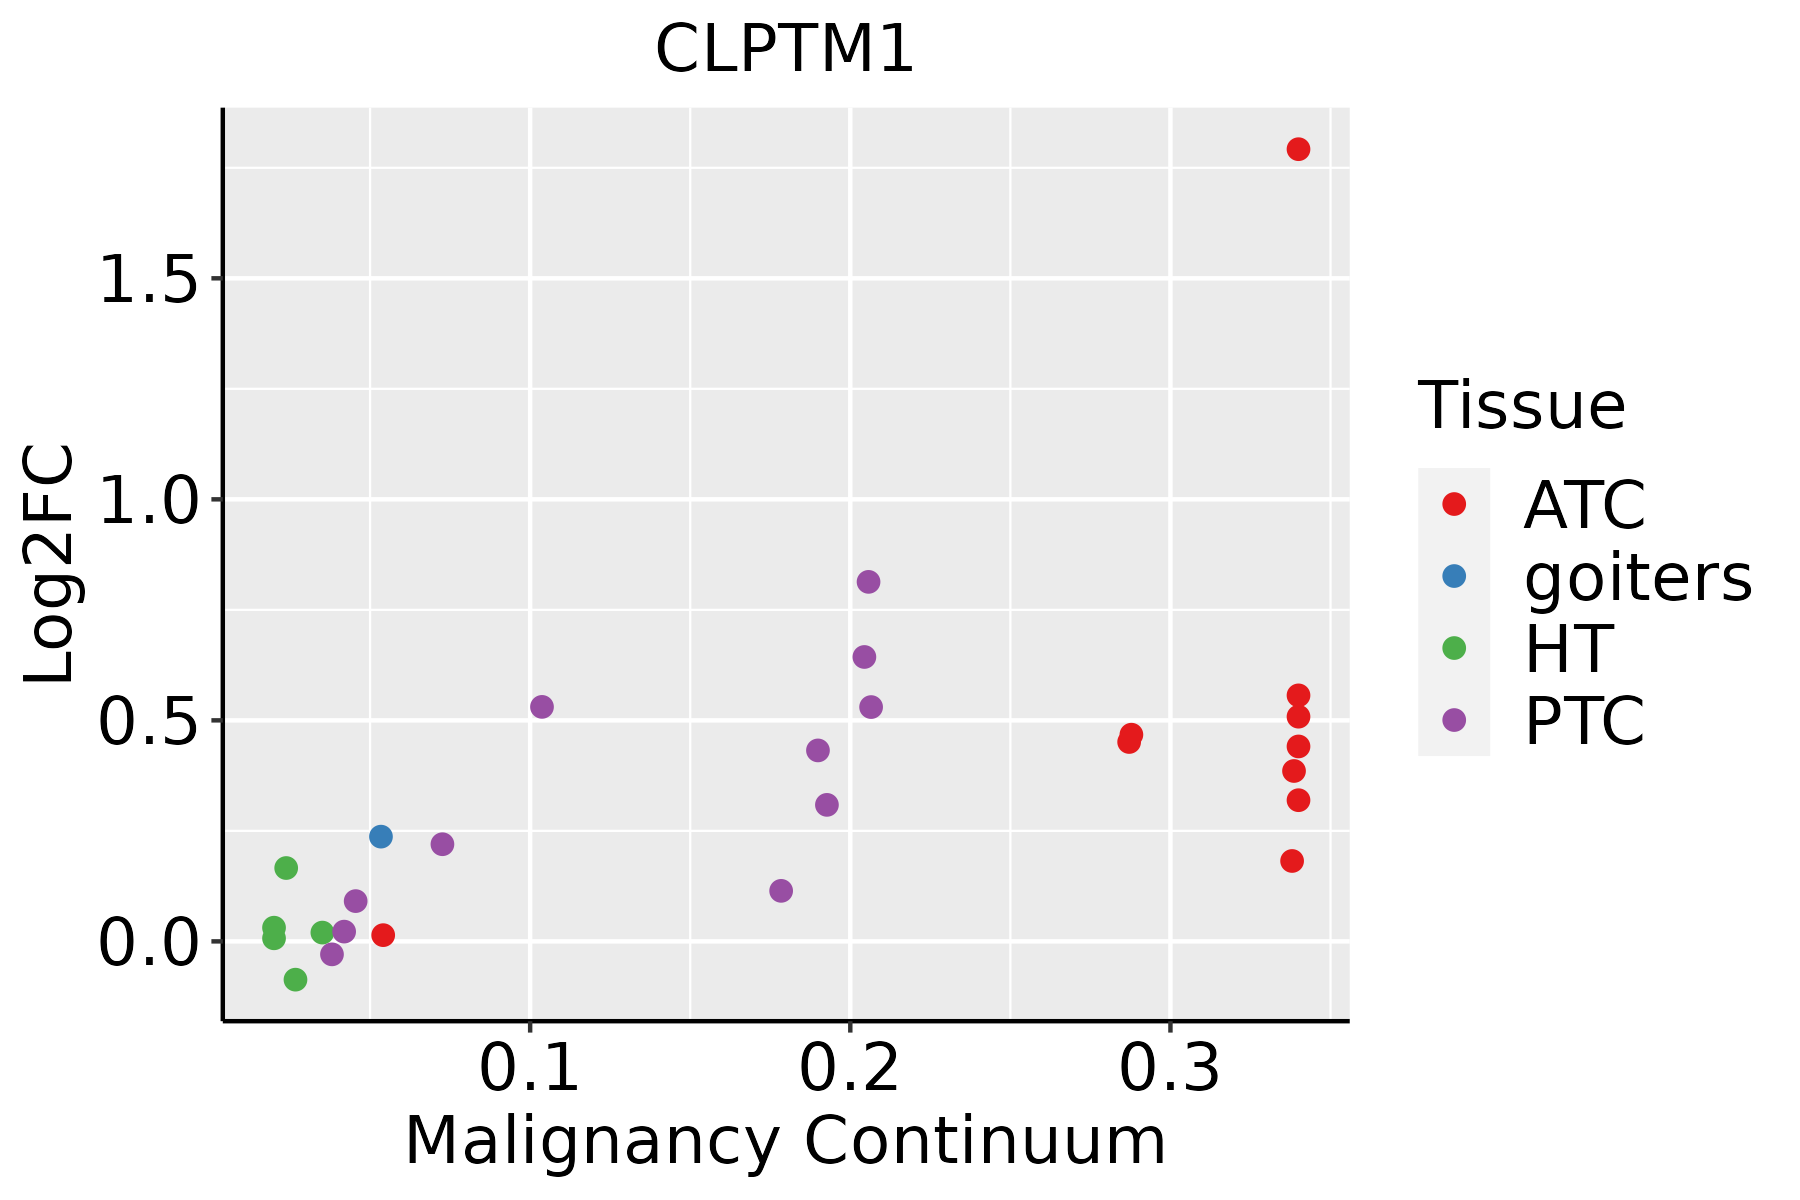
ATC: Anaplastic thyroid cancer
HT: Hashimoto's thyroiditis
PTC: Papillary thyroid cancer
∗log2FC in expression of this searched gene in stem-like cells from each diseased tissue sample relative to stem-like cells in normal samples in each tissue plotted against the malignancy continuum. Samples are colored based on if they are from different disease stage.

Top

Malignant transformation related pathway analysis

check buttonFind out the enriched GO biological processes and KEGG pathways involved in transition from healthy to precancer to cancer
check button Figure of enriched GO biological processes.
TissueDisease StageEnriched GO biological Processes
ColorectumADGO analysis - Figure of enriched GO biological processes: Top 15 enriched GO BP terms are showed in the bar plot of each disease state in each tissue. Each row represents a significant GO biological process which is colored according to the -log10(p.adjust).
ColorectumSERGO analysis - Figure of enriched GO biological processes: Top 15 enriched GO BP terms are showed in the bar plot of each disease state in each tissue. Each row represents a significant GO biological process which is colored according to the -log10(p.adjust).
ColorectumMSSGO analysis - Figure of enriched GO biological processes: Top 15 enriched GO BP terms are showed in the bar plot of each disease state in each tissue. Each row represents a significant GO biological process which is colored according to the -log10(p.adjust).
ColorectumMSI-HGO analysis - Figure of enriched GO biological processes: Top 15 enriched GO BP terms are showed in the bar plot of each disease state in each tissue. Each row represents a significant GO biological process which is colored according to the -log10(p.adjust).
ColorectumFAPGO analysis - Figure of enriched GO biological processes: Top 15 enriched GO BP terms are showed in the bar plot of each disease state in each tissue. Each row represents a significant GO biological process which is colored according to the -log10(p.adjust).
∗Top 15 enriched GO BP terms are showed in the bar plot of each disease state in each tissue. Each row represents a significant GO biological process which is colored according to the -log10(p.adjust).
Page: 1 2 3 4 5 6 7 8 9 

check button Enriched GO biological processes.
GO IDTissueDisease StageDescriptionGene RatioBg Ratiopvaluep.adjustCount
GO:1903706ColorectumADregulation of hemopoiesis99/3918367/187233.08e-032.28e-0299
GO:19037061ColorectumMSSregulation of hemopoiesis89/3467367/187233.39e-032.56e-0289
GO:1903131ColorectumFAPmononuclear cell differentiation79/2622426/187235.00e-033.33e-0279
GO:19037063ColorectumFAPregulation of hemopoiesis69/2622367/187236.01e-033.78e-0269
GO:190370620EsophagusHGINregulation of hemopoiesis69/2587367/187234.39e-033.86e-0269
GO:1903706110EsophagusESCCregulation of hemopoiesis201/8552367/187232.60e-041.58e-03201
GO:004211018EsophagusESCCT cell activation256/8552487/187231.18e-035.87e-03256
GO:19031317EsophagusESCCmononuclear cell differentiation226/8552426/187231.20e-035.88e-03226
GO:190210510EsophagusESCCregulation of leukocyte differentiation152/8552279/187231.82e-038.35e-03152
GO:00302176EsophagusESCCT cell differentiation137/8552257/187238.09e-032.87e-02137
GO:00300984EsophagusESCClymphocyte differentiation192/8552374/187231.52e-024.93e-02192
GO:004211016Oral cavityOSCCT cell activation245/7305487/187232.00e-073.22e-06245
GO:19031316Oral cavityOSCCmononuclear cell differentiation210/7305426/187238.44e-069.02e-05210
GO:190370618Oral cavityOSCCregulation of hemopoiesis180/7305367/187235.16e-054.30e-04180
GO:005086315Oral cavityOSCCregulation of T cell activation161/7305329/187231.44e-041.02e-03161
GO:00300983Oral cavityOSCClymphocyte differentiation179/7305374/187232.74e-041.74e-03179
GO:19021059Oral cavityOSCCregulation of leukocyte differentiation136/7305279/187235.53e-043.21e-03136
GO:00302175Oral cavityOSCCT cell differentiation126/7305257/187236.51e-043.66e-03126
GO:00330771Oral cavityOSCCT cell differentiation in thymus42/730575/187232.09e-039.63e-0342
GO:00456194Oral cavityOSCCregulation of lymphocyte differentiation83/7305174/187231.18e-024.00e-0283
Page: 1 2 

check button Enriched KEGG pathways.
Pathway IDTissueDisease StageDescriptionGene RatioBg Ratiopvaluep.adjustqvalueCount
Page: 1 

Top

Cell-cell communication analysis

check buttonIdentification of potential cell-cell interactions between two cell types and their ligand-receptor pairs for different disease states
LigandReceptorLRpairPathwayTissueDisease Stage
Page: 1 

Top

Single-cell gene regulatory network inference analysis

check buttonFind out the significant the regulons (TFs) and the target genes of each regulon across cell types for different disease states
TFCell TypeTissueDisease StageTarget GeneRSSRegulon Activity
∗The dot plots of a searched regulon are shown for all cell subpopulations in each disease state of each tissue based on the regulon specific score inferred using pySCENIC and by calculating the average expression.
Page: 1 

Top

Somatic mutation of malignant transformation related genes

check buttonAnnotation of somatic variants for genes involved in malignant transformation
Hugo SymbolVariant ClassVariant ClassificationdbSNP RSHGVScHGVSpHGVSp ShortSWISSPROTBIOTYPESIFTPolyPhenTumor Sample BarcodeTissueHistologySexAgeStageTherapy TypesDrugsOutcome
CLPTM1SNVMissense_Mutationc.921N>Gp.Phe307Leup.F307LO96005protein_codingtolerated(0.05)benign(0.026)TCGA-A8-A097-01Breastbreast invasive carcinomaFemale>=65I/IIHormone TherapytamoxiphenSD
CLPTM1SNVMissense_Mutationrs199925354c.886N>Ap.Glu296Lysp.E296KO96005protein_codingtolerated(0.08)benign(0.148)TCGA-C8-A274-01Breastbreast invasive carcinomaFemale<65I/IIHormone TherapytamoxiphenSD
CLPTM1insertionNonsense_Mutationnovelc.182_183insAGGACAGCAAAAGACTCTCTAGGTCACCACTGTCCCp.Phe61delinsLeuGlyGlnGlnLysThrLeuTerValThrThrValProp.F61delinsLGQQKTL*VTTVPO96005protein_codingTCGA-BH-A0B3-01Breastbreast invasive carcinomaFemale<65I/IIChemotherapycyclophosphamideSD
CLPTM1deletionFrame_Shift_Delnovelc.829delNp.Ile278SerfsTer68p.I278Sfs*68O96005protein_codingTCGA-EW-A2FV-01Breastbreast invasive carcinomaFemale<65III/IVChemotherapydocetaxelSD
CLPTM1SNVMissense_Mutationnovelc.152N>Cp.Asn51Thrp.N51TO96005protein_codingdeleterious(0.02)probably_damaging(0.982)TCGA-2W-A8YY-01Cervixcervical & endocervical cancerFemale<65I/IIChemotherapycisplatinCR
CLPTM1SNVMissense_Mutationnovelc.1579N>Tp.Leu527Phep.L527FO96005protein_codingdeleterious(0)probably_damaging(0.994)TCGA-2W-A8YY-01Cervixcervical & endocervical cancerFemale<65I/IIChemotherapycisplatinCR
CLPTM1SNVMissense_Mutationnovelc.114N>Cp.Glu38Aspp.E38DO96005protein_codingtolerated(0.16)benign(0.003)TCGA-DS-A1OB-01Cervixcervical & endocervical cancerFemale<65I/IIChemotherapycarboplatinPD
CLPTM1SNVMissense_Mutationnovelc.1137C>Gp.Ile379Metp.I379MO96005protein_codingdeleterious(0.01)probably_damaging(0.932)TCGA-MA-AA41-01Cervixcervical & endocervical cancerFemale<65I/IIUnknownUnknownSD
CLPTM1SNVMissense_Mutationc.656N>Gp.Asp219Glyp.D219GO96005protein_codingtolerated(0.17)benign(0.03)TCGA-A6-5665-01Colorectumcolon adenocarcinomaFemale>=65I/IIUnknownUnknownPD
CLPTM1SNVMissense_Mutationrs770360744c.1198N>Ap.Val400Ilep.V400IO96005protein_codingtolerated(0.2)possibly_damaging(0.457)TCGA-A6-6653-01Colorectumcolon adenocarcinomaMale>=65I/IIUnknownUnknownSD
Page: 1 2 3 4 5 6 

Top

Related drugs of malignant transformation related genes

check buttonIdentification of chemicals and drugs interact with genes involved in malignant transfromation
(DGIdb 4.0)
Entrez IDSymbolCategoryInteraction TypesDrug Claim NameDrug NamePMIDs
Page: 1