
|
|||||
|
 | |
| |
| |
| |
| |
| |
|
Gene: CLPB |
Gene summary for CLPB |
| Gene information | Species | Human | Gene symbol | CLPB | Gene ID | 81570 |
| Gene name | caseinolytic mitochondrial matrix peptidase chaperone subunit B | |
| Gene Alias | ANKCLB | |
| Cytomap | 11q13.4 | |
| Gene Type | protein-coding | GO ID | GO:0002221 | UniProtAcc | Q9H078 |
Top |
Malignant transformation analysis |
| Identification of the aberrant gene expression in precancerous and cancerous lesions by comparing the gene expression of stem-like cells in diseased tissues with normal stem cells |
| Entrez ID | Symbol | Replicates | Species | Organ | Tissue | Adj P-value | Log2FC | Malignancy |
| 81570 | CLPB | LZE7T | Human | Esophagus | ESCC | 1.02e-03 | 1.86e-01 | 0.0667 |
| 81570 | CLPB | LZE8T | Human | Esophagus | ESCC | 2.72e-03 | 1.23e-01 | 0.067 |
| 81570 | CLPB | LZE22T | Human | Esophagus | ESCC | 1.40e-06 | 3.26e-01 | 0.068 |
| 81570 | CLPB | LZE24T | Human | Esophagus | ESCC | 1.48e-08 | 2.03e-01 | 0.0596 |
| 81570 | CLPB | P2T-E | Human | Esophagus | ESCC | 1.33e-30 | 5.23e-01 | 0.1177 |
| 81570 | CLPB | P4T-E | Human | Esophagus | ESCC | 1.49e-09 | 2.45e-01 | 0.1323 |
| 81570 | CLPB | P9T-E | Human | Esophagus | ESCC | 1.11e-03 | 1.12e-01 | 0.1131 |
| 81570 | CLPB | P10T-E | Human | Esophagus | ESCC | 3.53e-05 | 1.49e-01 | 0.116 |
| 81570 | CLPB | P11T-E | Human | Esophagus | ESCC | 2.06e-07 | 2.71e-01 | 0.1426 |
| 81570 | CLPB | P12T-E | Human | Esophagus | ESCC | 2.38e-09 | 2.20e-01 | 0.1122 |
| 81570 | CLPB | P15T-E | Human | Esophagus | ESCC | 1.32e-06 | 1.48e-01 | 0.1149 |
| 81570 | CLPB | P16T-E | Human | Esophagus | ESCC | 2.79e-07 | 2.06e-01 | 0.1153 |
| 81570 | CLPB | P17T-E | Human | Esophagus | ESCC | 5.71e-11 | 4.47e-01 | 0.1278 |
| 81570 | CLPB | P19T-E | Human | Esophagus | ESCC | 7.48e-03 | 2.40e-01 | 0.1662 |
| 81570 | CLPB | P20T-E | Human | Esophagus | ESCC | 1.39e-16 | 3.86e-01 | 0.1124 |
| 81570 | CLPB | P21T-E | Human | Esophagus | ESCC | 9.20e-25 | 5.11e-01 | 0.1617 |
| 81570 | CLPB | P23T-E | Human | Esophagus | ESCC | 8.01e-24 | 5.05e-01 | 0.108 |
| 81570 | CLPB | P26T-E | Human | Esophagus | ESCC | 1.24e-10 | 2.81e-01 | 0.1276 |
| 81570 | CLPB | P27T-E | Human | Esophagus | ESCC | 2.91e-06 | 1.44e-01 | 0.1055 |
| 81570 | CLPB | P28T-E | Human | Esophagus | ESCC | 1.38e-32 | 6.76e-01 | 0.1149 |
| Page: 1 2 3 |
| Tissue | Expression Dynamics | Abbreviation |
| Esophagus | 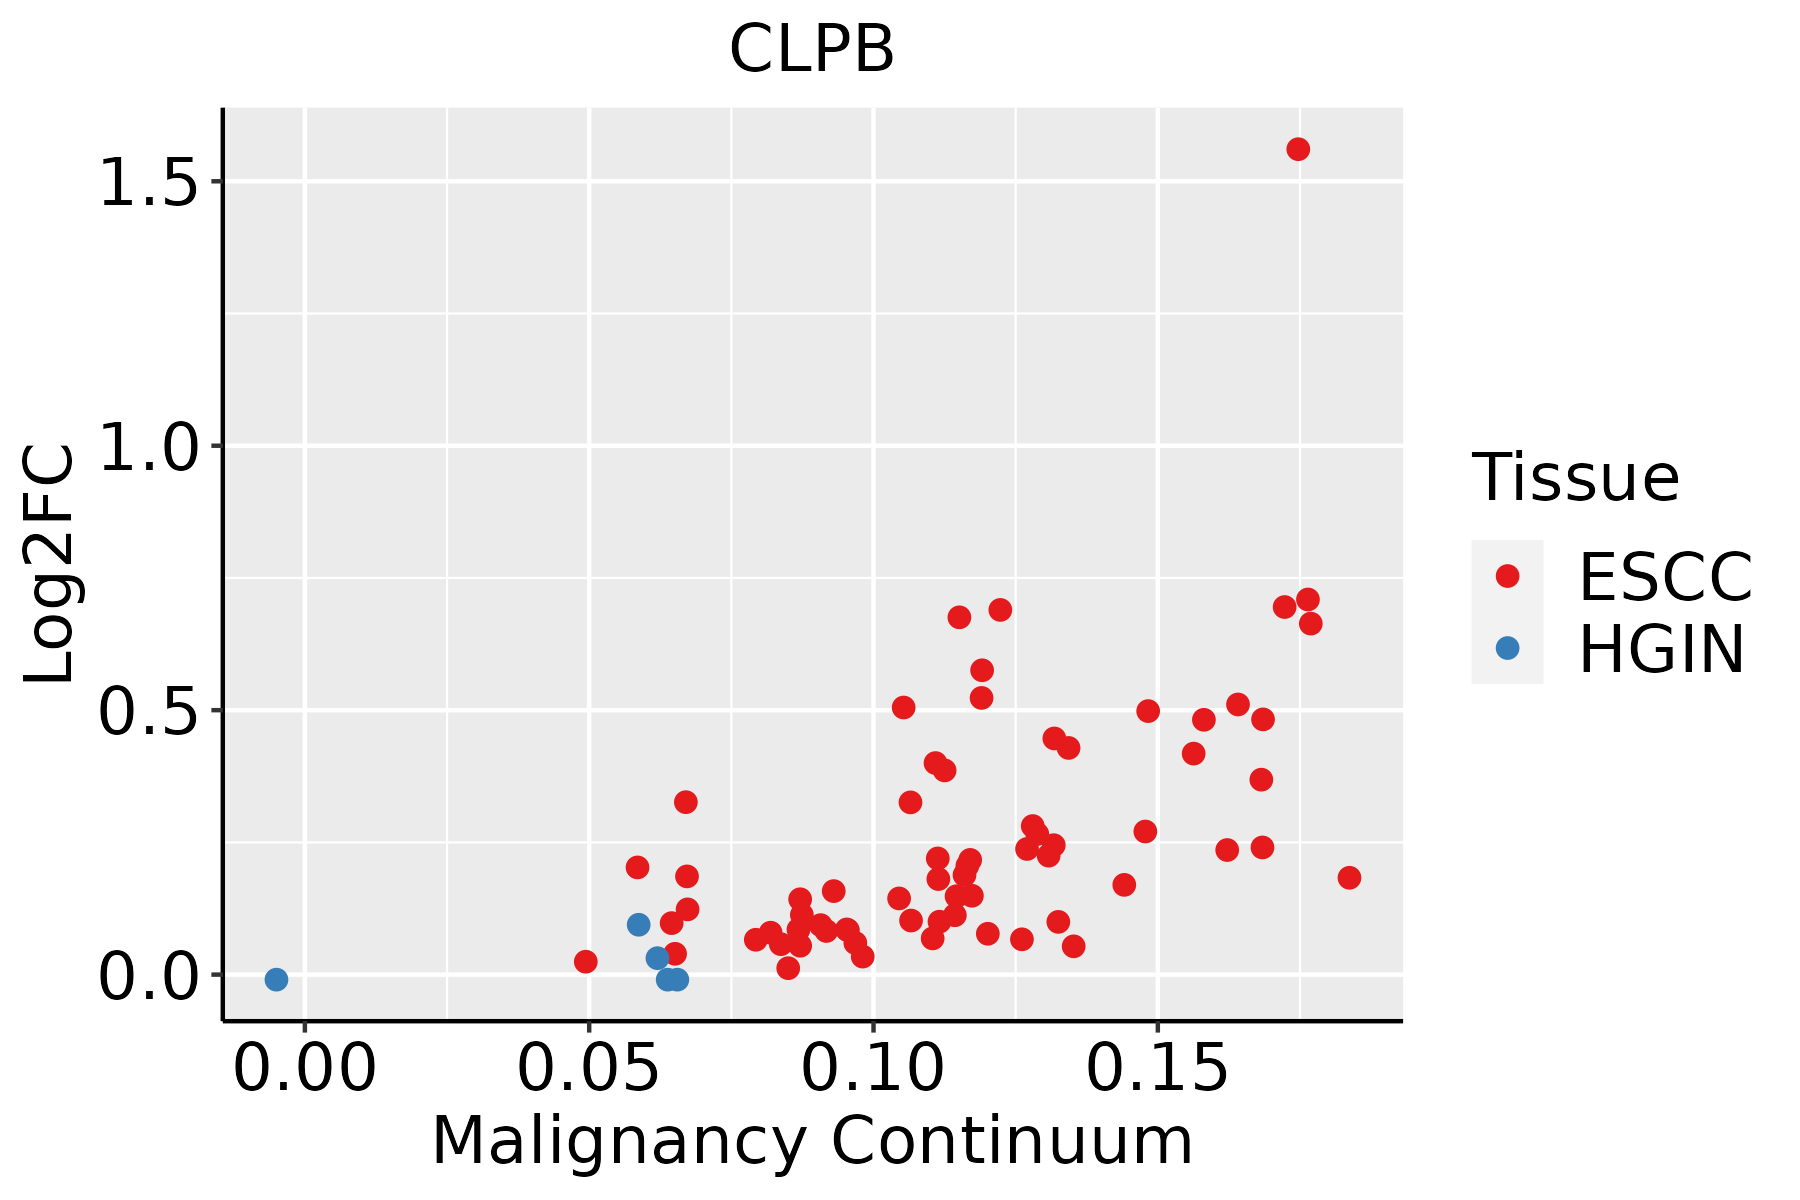 | ESCC: Esophageal squamous cell carcinoma |
| HGIN: High-grade intraepithelial neoplasias | ||
| LGIN: Low-grade intraepithelial neoplasias | ||
| Liver |  | HCC: Hepatocellular carcinoma |
| NAFLD: Non-alcoholic fatty liver disease | ||
| Oral Cavity |  | EOLP: Erosive Oral lichen planus |
| LP: leukoplakia | ||
| NEOLP: Non-erosive oral lichen planus | ||
| OSCC: Oral squamous cell carcinoma |
| ∗log2FC in expression of this searched gene in stem-like cells from each diseased tissue sample relative to stem-like cells in normal samples in each tissue plotted against the malignancy continuum. Samples are colored based on if they are from different disease stage. |
Top |
Malignant transformation related pathway analysis |
| Find out the enriched GO biological processes and KEGG pathways involved in transition from healthy to precancer to cancer |
| Tissue | Disease Stage | Enriched GO biological Processes |
| Colorectum | AD |  |
| Colorectum | SER |  |
| Colorectum | MSS |  |
| Colorectum | MSI-H |  |
| Colorectum | FAP |  |
| ∗Top 15 enriched GO BP terms are showed in the bar plot of each disease state in each tissue. Each row represents a significant GO biological process which is colored according to the -log10(p.adjust). |
| Page: 1 2 3 4 5 6 7 8 9 |
| GO ID | Tissue | Disease Stage | Description | Gene Ratio | Bg Ratio | pvalue | p.adjust | Count |
| GO:000961518 | Esophagus | ESCC | response to virus | 238/8552 | 367/18723 | 6.65e-14 | 3.32e-12 | 238 |
| GO:00516075 | Esophagus | ESCC | defense response to virus | 171/8552 | 265/18723 | 3.91e-10 | 1.05e-08 | 171 |
| GO:01405465 | Esophagus | ESCC | defense response to symbiont | 171/8552 | 265/18723 | 3.91e-10 | 1.05e-08 | 171 |
| GO:0030522110 | Esophagus | ESCC | intracellular receptor signaling pathway | 170/8552 | 265/18723 | 8.58e-10 | 2.09e-08 | 170 |
| GO:0009408110 | Esophagus | ESCC | response to heat | 77/8552 | 110/18723 | 2.01e-07 | 3.11e-06 | 77 |
| GO:0034605111 | Esophagus | ESCC | cellular response to heat | 52/8552 | 69/18723 | 4.87e-07 | 6.53e-06 | 52 |
| GO:003952813 | Esophagus | ESCC | cytoplasmic pattern recognition receptor signaling pathway in response to virus | 28/8552 | 34/18723 | 1.21e-05 | 1.12e-04 | 28 |
| GO:009858613 | Esophagus | ESCC | cellular response to virus | 56/8552 | 84/18723 | 8.20e-05 | 6.01e-04 | 56 |
| GO:000926619 | Esophagus | ESCC | response to temperature stimulus | 106/8552 | 178/18723 | 1.30e-04 | 8.84e-04 | 106 |
| GO:003952913 | Esophagus | ESCC | RIG-I signaling pathway | 22/8552 | 27/18723 | 1.49e-04 | 9.92e-04 | 22 |
| GO:000275313 | Esophagus | ESCC | cytoplasmic pattern recognition receptor signaling pathway | 41/8552 | 60/18723 | 3.25e-04 | 1.91e-03 | 41 |
| GO:01403742 | Esophagus | ESCC | antiviral innate immune response | 13/8552 | 15/18723 | 1.31e-03 | 6.26e-03 | 13 |
| GO:003052222 | Liver | HCC | intracellular receptor signaling pathway | 171/7958 | 265/18723 | 3.00e-13 | 1.61e-11 | 171 |
| GO:003460512 | Liver | HCC | cellular response to heat | 53/7958 | 69/18723 | 6.62e-09 | 1.70e-07 | 53 |
| GO:000961511 | Liver | HCC | response to virus | 210/7958 | 367/18723 | 7.32e-09 | 1.86e-07 | 210 |
| GO:000940811 | Liver | HCC | response to heat | 76/7958 | 110/18723 | 1.48e-08 | 3.58e-07 | 76 |
| GO:0039528 | Liver | HCC | cytoplasmic pattern recognition receptor signaling pathway in response to virus | 30/7958 | 34/18723 | 3.88e-08 | 8.39e-07 | 30 |
| GO:00027533 | Liver | HCC | cytoplasmic pattern recognition receptor signaling pathway | 46/7958 | 60/18723 | 7.37e-08 | 1.49e-06 | 46 |
| GO:00022211 | Liver | HCC | pattern recognition receptor signaling pathway | 107/7958 | 172/18723 | 1.37e-07 | 2.58e-06 | 107 |
| GO:00395291 | Liver | HCC | RIG-I signaling pathway | 24/7958 | 27/18723 | 7.23e-07 | 1.12e-05 | 24 |
| Page: 1 2 |
| Pathway ID | Tissue | Disease Stage | Description | Gene Ratio | Bg Ratio | pvalue | p.adjust | qvalue | Count |
| hsa042138 | Liver | HCC | Longevity regulating pathway - multiple species | 41/4020 | 62/8465 | 2.30e-03 | 7.86e-03 | 4.37e-03 | 41 |
| hsa0421311 | Liver | HCC | Longevity regulating pathway - multiple species | 41/4020 | 62/8465 | 2.30e-03 | 7.86e-03 | 4.37e-03 | 41 |
| hsa0421310 | Oral cavity | OSCC | Longevity regulating pathway - multiple species | 38/3704 | 62/8465 | 3.97e-03 | 9.86e-03 | 5.02e-03 | 38 |
| hsa0421313 | Oral cavity | OSCC | Longevity regulating pathway - multiple species | 38/3704 | 62/8465 | 3.97e-03 | 9.86e-03 | 5.02e-03 | 38 |
| Page: 1 |
Top |
Cell-cell communication analysis |
| Identification of potential cell-cell interactions between two cell types and their ligand-receptor pairs for different disease states |
| Ligand | Receptor | LRpair | Pathway | Tissue | Disease Stage |
| Page: 1 |
Top |
Single-cell gene regulatory network inference analysis |
| Find out the significant the regulons (TFs) and the target genes of each regulon across cell types for different disease states |
| TF | Cell Type | Tissue | Disease Stage | Target Gene | RSS | Regulon Activity |
| ∗The dot plots of a searched regulon are shown for all cell subpopulations in each disease state of each tissue based on the regulon specific score inferred using pySCENIC and by calculating the average expression. |
| Page: 1 |
Top |
Somatic mutation of malignant transformation related genes |
| Annotation of somatic variants for genes involved in malignant transformation |
| Hugo Symbol | Variant Class | Variant Classification | dbSNP RS | HGVSc | HGVSp | HGVSp Short | SWISSPROT | BIOTYPE | SIFT | PolyPhen | Tumor Sample Barcode | Tissue | Histology | Sex | Age | Stage | Therapy Types | Drugs | Outcome |
| CLPB | SNV | Missense_Mutation | novel | c.1721N>G | p.Ser574Trp | p.S574W | Q9H078 | protein_coding | deleterious(0) | probably_damaging(0.998) | TCGA-5L-AAT1-01 | Breast | breast invasive carcinoma | Female | <65 | III/IV | Hormone Therapy | letrozol | SD |
| CLPB | deletion | Frame_Shift_Del | novel | c.1616delN | p.Asn539ThrfsTer6 | p.N539Tfs*6 | Q9H078 | protein_coding | TCGA-D8-A27V-01 | Breast | breast invasive carcinoma | Female | <65 | I/II | Hormone Therapy | tamoxiphen | SD | ||
| CLPB | SNV | Missense_Mutation | rs150857620 | c.1700N>G | p.Tyr567Cys | p.Y567C | Q9H078 | protein_coding | deleterious(0) | probably_damaging(0.999) | TCGA-C5-A1BI-01 | Cervix | cervical & endocervical cancer | Female | <65 | III/IV | Chemotherapy | cisplatin | SD |
| CLPB | SNV | Missense_Mutation | c.1446G>C | p.Lys482Asn | p.K482N | Q9H078 | protein_coding | tolerated(0.06) | probably_damaging(0.984) | TCGA-MU-A5YI-01 | Cervix | cervical & endocervical cancer | Female | <65 | I/II | Unknown | Unknown | PD | |
| CLPB | SNV | Missense_Mutation | c.757G>T | p.Asp253Tyr | p.D253Y | Q9H078 | protein_coding | deleterious(0.02) | benign(0.248) | TCGA-Q1-A73P-01 | Cervix | cervical & endocervical cancer | Female | <65 | I/II | Unknown | Unknown | SD | |
| CLPB | SNV | Missense_Mutation | c.730G>A | p.Ala244Thr | p.A244T | Q9H078 | protein_coding | tolerated_low_confidence(0.54) | benign(0) | TCGA-VS-A9UI-01 | Cervix | cervical & endocervical cancer | Female | >=65 | I/II | Unknown | Unknown | SD | |
| CLPB | SNV | Missense_Mutation | novel | c.1517N>T | p.Ala506Val | p.A506V | Q9H078 | protein_coding | deleterious(0.01) | probably_damaging(0.988) | TCGA-5M-AAT6-01 | Colorectum | colon adenocarcinoma | Female | <65 | III/IV | Unknown | Unknown | PD |
| CLPB | SNV | Missense_Mutation | c.95N>A | p.Ala32Asp | p.A32D | Q9H078 | protein_coding | deleterious_low_confidence(0) | benign(0.05) | TCGA-AA-3966-01 | Colorectum | colon adenocarcinoma | Female | >=65 | I/II | Unknown | Unknown | SD | |
| CLPB | SNV | Missense_Mutation | c.497N>G | p.Leu166Arg | p.L166R | Q9H078 | protein_coding | deleterious(0.02) | probably_damaging(1) | TCGA-AD-5900-01 | Colorectum | colon adenocarcinoma | Male | >=65 | I/II | Unknown | Unknown | SD | |
| CLPB | SNV | Missense_Mutation | c.217N>T | p.Arg73Cys | p.R73C | Q9H078 | protein_coding | deleterious_low_confidence(0) | possibly_damaging(0.53) | TCGA-AZ-6601-01 | Colorectum | colon adenocarcinoma | Male | >=65 | I/II | Unknown | Unknown | PD |
| Page: 1 2 3 4 5 6 |
Top |
Related drugs of malignant transformation related genes |
| Identification of chemicals and drugs interact with genes involved in malignant transfromation |
| (DGIdb 4.0) |
| Entrez ID | Symbol | Category | Interaction Types | Drug Claim Name | Drug Name | PMIDs |
| Page: 1 |

Copyright 2023-Present -The University of Texas Health Science Center at Houston |