
|
|||||
|
 | |
| |
| |
| |
| |
| |
|
Gene: CLP1 |
Gene summary for CLP1 |
| Gene information | Species | Human | Gene symbol | CLP1 | Gene ID | 10978 |
| Gene name | cleavage factor polyribonucleotide kinase subunit 1 | |
| Gene Alias | HEAB | |
| Cytomap | 11q12.1 | |
| Gene Type | protein-coding | GO ID | GO:0000394 | UniProtAcc | Q92989 |
Top |
Malignant transformation analysis |
| Identification of the aberrant gene expression in precancerous and cancerous lesions by comparing the gene expression of stem-like cells in diseased tissues with normal stem cells |
| Entrez ID | Symbol | Replicates | Species | Organ | Tissue | Adj P-value | Log2FC | Malignancy |
| 10978 | CLP1 | C04 | Human | Oral cavity | OSCC | 4.92e-04 | 2.99e-01 | 0.2633 |
| 10978 | CLP1 | C21 | Human | Oral cavity | OSCC | 1.11e-06 | 3.31e-01 | 0.2678 |
| 10978 | CLP1 | C30 | Human | Oral cavity | OSCC | 7.81e-08 | 5.18e-01 | 0.3055 |
| 10978 | CLP1 | C38 | Human | Oral cavity | OSCC | 6.34e-05 | 5.08e-01 | 0.172 |
| 10978 | CLP1 | C43 | Human | Oral cavity | OSCC | 1.58e-14 | 3.25e-01 | 0.1704 |
| 10978 | CLP1 | C46 | Human | Oral cavity | OSCC | 8.97e-09 | 2.93e-01 | 0.1673 |
| 10978 | CLP1 | C57 | Human | Oral cavity | OSCC | 2.07e-05 | 2.80e-01 | 0.1679 |
| 10978 | CLP1 | C06 | Human | Oral cavity | OSCC | 8.60e-05 | 8.00e-01 | 0.2699 |
| 10978 | CLP1 | C08 | Human | Oral cavity | OSCC | 2.70e-05 | 2.22e-01 | 0.1919 |
| 10978 | CLP1 | LN22 | Human | Oral cavity | OSCC | 1.06e-04 | 5.59e-01 | 0.1733 |
| 10978 | CLP1 | SYSMH2 | Human | Oral cavity | OSCC | 4.67e-04 | 1.56e-01 | 0.2326 |
| 10978 | CLP1 | SYSMH3 | Human | Oral cavity | OSCC | 4.29e-10 | 2.83e-01 | 0.2442 |
| Page: 1 |
| Tissue | Expression Dynamics | Abbreviation |
| Oral Cavity | 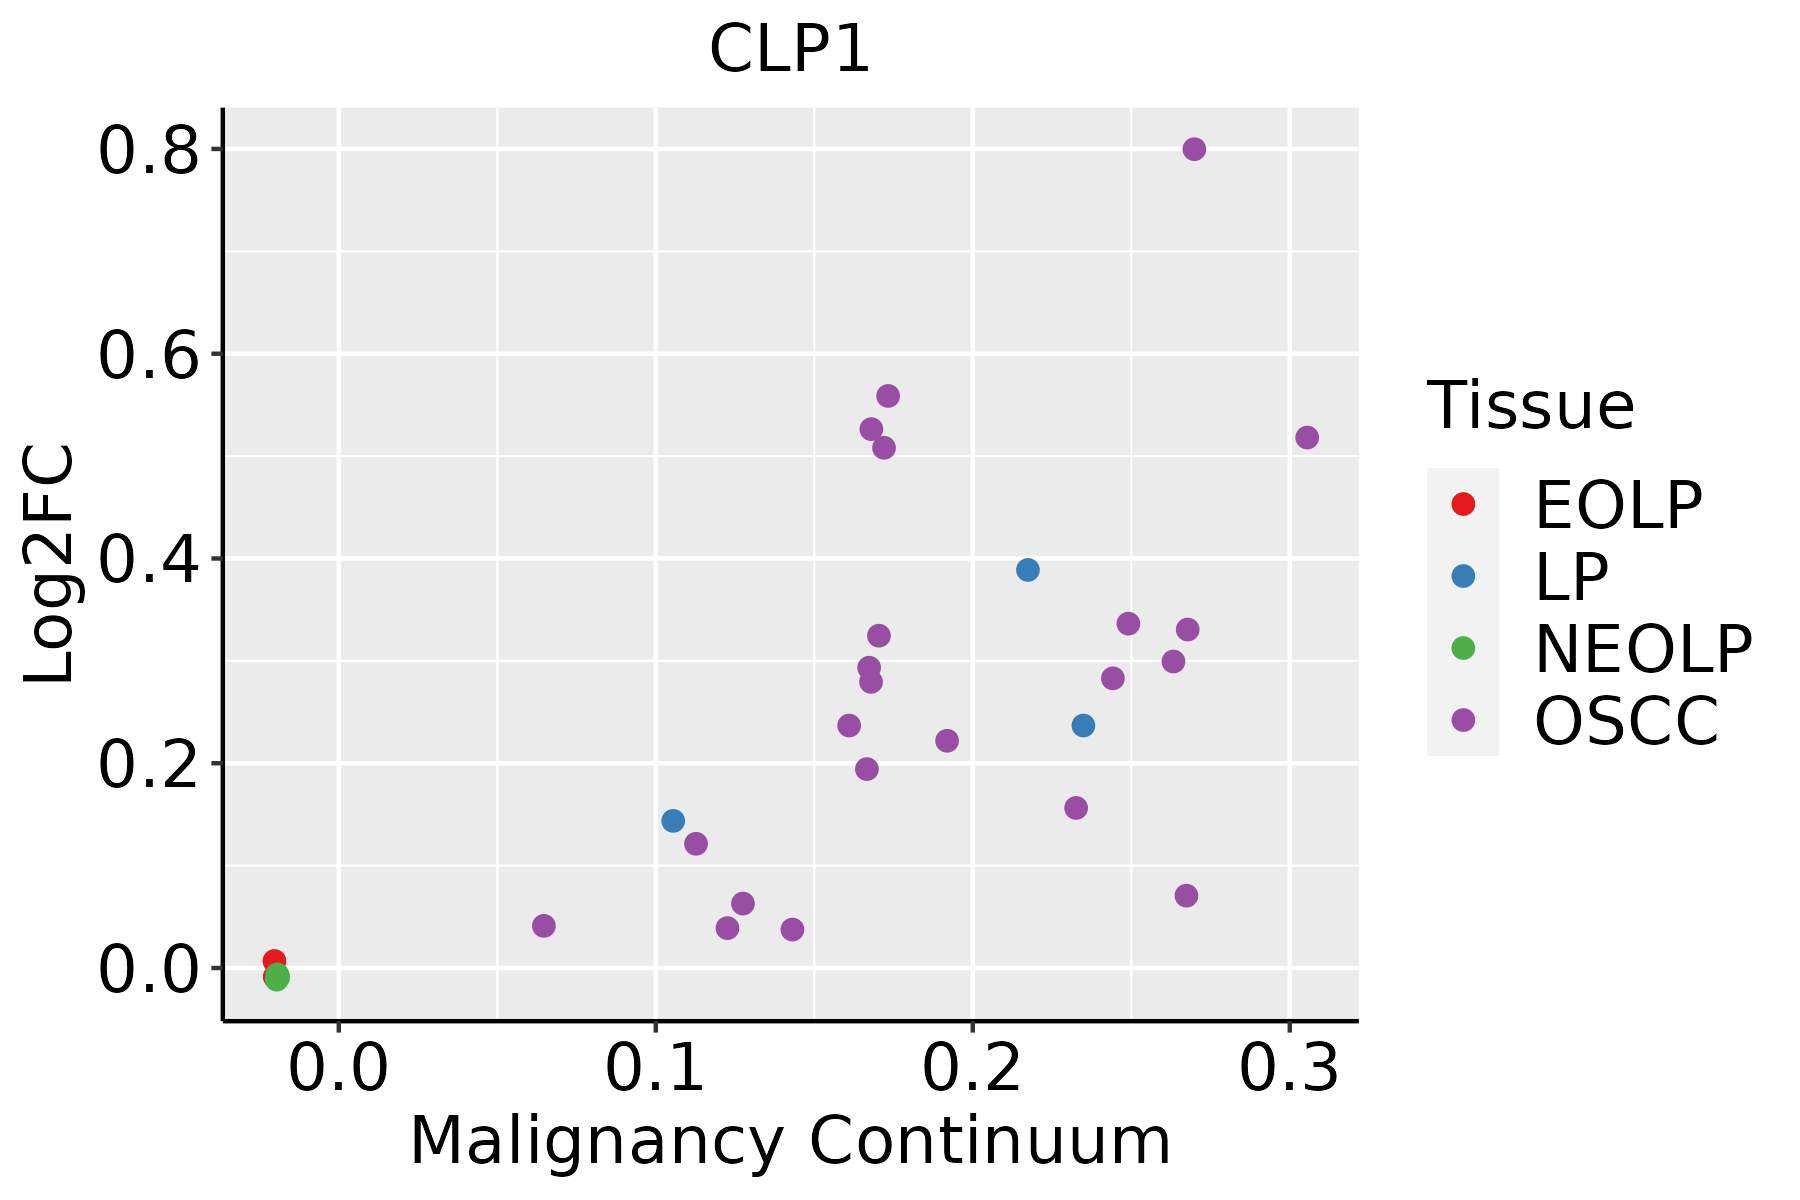 | EOLP: Erosive Oral lichen planus |
| LP: leukoplakia | ||
| NEOLP: Non-erosive oral lichen planus | ||
| OSCC: Oral squamous cell carcinoma |
| ∗log2FC in expression of this searched gene in stem-like cells from each diseased tissue sample relative to stem-like cells in normal samples in each tissue plotted against the malignancy continuum. Samples are colored based on if they are from different disease stage. |
Top |
Malignant transformation related pathway analysis |
| Find out the enriched GO biological processes and KEGG pathways involved in transition from healthy to precancer to cancer |
| Tissue | Disease Stage | Enriched GO biological Processes |
| Colorectum | AD |  |
| Colorectum | SER |  |
| Colorectum | MSS |  |
| Colorectum | MSI-H |  |
| Colorectum | FAP |  |
| ∗Top 15 enriched GO BP terms are showed in the bar plot of each disease state in each tissue. Each row represents a significant GO biological process which is colored according to the -log10(p.adjust). |
| Page: 1 2 3 4 5 6 7 8 9 |
| GO ID | Tissue | Disease Stage | Description | Gene Ratio | Bg Ratio | pvalue | p.adjust | Count |
| GO:002261320 | Oral cavity | OSCC | ribonucleoprotein complex biogenesis | 333/7305 | 463/18723 | 8.28e-48 | 5.24e-44 | 333 |
| GO:000838020 | Oral cavity | OSCC | RNA splicing | 308/7305 | 434/18723 | 2.43e-42 | 7.70e-39 | 308 |
| GO:00344709 | Oral cavity | OSCC | ncRNA processing | 263/7305 | 395/18723 | 4.38e-29 | 2.78e-26 | 263 |
| GO:00346605 | Oral cavity | OSCC | ncRNA metabolic process | 296/7305 | 485/18723 | 2.94e-23 | 6.65e-21 | 296 |
| GO:007182620 | Oral cavity | OSCC | ribonucleoprotein complex subunit organization | 152/7305 | 227/18723 | 1.05e-17 | 1.01e-15 | 152 |
| GO:002261820 | Oral cavity | OSCC | ribonucleoprotein complex assembly | 146/7305 | 220/18723 | 1.53e-16 | 1.23e-14 | 146 |
| GO:00311242 | Oral cavity | OSCC | mRNA 3'-end processing | 49/7305 | 62/18723 | 1.40e-10 | 4.14e-09 | 49 |
| GO:00311232 | Oral cavity | OSCC | RNA 3'-end processing | 75/7305 | 116/18723 | 1.93e-08 | 3.79e-07 | 75 |
| GO:00080332 | Oral cavity | OSCC | tRNA processing | 78/7305 | 127/18723 | 2.56e-07 | 4.00e-06 | 78 |
| GO:00063782 | Oral cavity | OSCC | mRNA polyadenylation | 34/7305 | 44/18723 | 2.63e-07 | 4.10e-06 | 34 |
| GO:00436312 | Oral cavity | OSCC | RNA polyadenylation | 34/7305 | 45/18723 | 6.73e-07 | 9.53e-06 | 34 |
| GO:00063991 | Oral cavity | OSCC | tRNA metabolic process | 101/7305 | 179/18723 | 1.65e-06 | 2.15e-05 | 101 |
| GO:0000394 | Oral cavity | OSCC | RNA splicing, via endonucleolytic cleavage and ligation | 9/7305 | 11/18723 | 4.85e-03 | 1.92e-02 | 9 |
| GO:00162463 | Oral cavity | OSCC | RNA interference | 10/7305 | 13/18723 | 6.32e-03 | 2.35e-02 | 10 |
| GO:0006388 | Oral cavity | OSCC | tRNA splicing, via endonucleolytic cleavage and ligation | 8/7305 | 10/18723 | 1.03e-02 | 3.53e-02 | 8 |
| Page: 1 |
| Pathway ID | Tissue | Disease Stage | Description | Gene Ratio | Bg Ratio | pvalue | p.adjust | qvalue | Count |
| hsa030158 | Oral cavity | OSCC | mRNA surveillance pathway | 75/3704 | 97/8465 | 1.30e-11 | 2.01e-10 | 1.02e-10 | 75 |
| hsa0301513 | Oral cavity | OSCC | mRNA surveillance pathway | 75/3704 | 97/8465 | 1.30e-11 | 2.01e-10 | 1.02e-10 | 75 |
| Page: 1 |
Top |
Cell-cell communication analysis |
| Identification of potential cell-cell interactions between two cell types and their ligand-receptor pairs for different disease states |
| Ligand | Receptor | LRpair | Pathway | Tissue | Disease Stage |
| Page: 1 |
Top |
Single-cell gene regulatory network inference analysis |
| Find out the significant the regulons (TFs) and the target genes of each regulon across cell types for different disease states |
| TF | Cell Type | Tissue | Disease Stage | Target Gene | RSS | Regulon Activity |
| ∗The dot plots of a searched regulon are shown for all cell subpopulations in each disease state of each tissue based on the regulon specific score inferred using pySCENIC and by calculating the average expression. |
| Page: 1 |
Top |
Somatic mutation of malignant transformation related genes |
| Annotation of somatic variants for genes involved in malignant transformation |
| Hugo Symbol | Variant Class | Variant Classification | dbSNP RS | HGVSc | HGVSp | HGVSp Short | SWISSPROT | BIOTYPE | SIFT | PolyPhen | Tumor Sample Barcode | Tissue | Histology | Sex | Age | Stage | Therapy Types | Drugs | Outcome |
| CLP1 | insertion | Frame_Shift_Ins | novel | c.450_451insCT | p.Asp151LeufsTer58 | p.D151Lfs*58 | Q92989 | protein_coding | TCGA-A8-A085-01 | Breast | breast invasive carcinoma | Male | <65 | I/II | Hormone Therapy | tamoxiphen | SD | ||
| CLP1 | insertion | Frame_Shift_Ins | novel | c.451_452insTGCCTAGAACACAAATTAA | p.Asp151ValfsTer52 | p.D151Vfs*52 | Q92989 | protein_coding | TCGA-A8-A085-01 | Breast | breast invasive carcinoma | Male | <65 | I/II | Hormone Therapy | tamoxiphen | SD | ||
| CLP1 | insertion | Nonsense_Mutation | novel | c.1143_1144insCTTCCGGCGGGAATGTAGGGATGAGCGTATCCGTG | p.Ser382LeufsTer6 | p.S382Lfs*6 | Q92989 | protein_coding | TCGA-AN-A0FX-01 | Breast | breast invasive carcinoma | Female | <65 | I/II | Unknown | Unknown | SD | ||
| CLP1 | SNV | Missense_Mutation | rs764684265 | c.899N>A | p.Arg300His | p.R300H | Q92989 | protein_coding | deleterious(0.02) | probably_damaging(0.953) | TCGA-2W-A8YY-01 | Cervix | cervical & endocervical cancer | Female | <65 | I/II | Chemotherapy | cisplatin | CR |
| CLP1 | SNV | Missense_Mutation | novel | c.256N>G | p.Lys86Glu | p.K86E | Q92989 | protein_coding | tolerated(0.25) | benign(0.003) | TCGA-C5-A7UI-01 | Cervix | cervical & endocervical cancer | Female | <65 | I/II | Unknown | Unknown | SD |
| CLP1 | SNV | Missense_Mutation | novel | c.633C>G | p.Phe211Leu | p.F211L | Q92989 | protein_coding | tolerated(0.39) | benign(0.017) | TCGA-DS-A1OB-01 | Cervix | cervical & endocervical cancer | Female | <65 | I/II | Chemotherapy | carboplatin | PD |
| CLP1 | SNV | Missense_Mutation | c.796N>G | p.Leu266Val | p.L266V | Q92989 | protein_coding | deleterious(0) | probably_damaging(0.976) | TCGA-AA-3666-01 | Colorectum | colon adenocarcinoma | Male | >=65 | III/IV | Unknown | Unknown | PD | |
| CLP1 | SNV | Missense_Mutation | c.1064N>C | p.Val355Ala | p.V355A | Q92989 | protein_coding | deleterious(0.01) | possibly_damaging(0.883) | TCGA-AA-3715-01 | Colorectum | colon adenocarcinoma | Male | >=65 | I/II | Unknown | Unknown | PD | |
| CLP1 | SNV | Missense_Mutation | c.493N>A | p.Ala165Thr | p.A165T | Q92989 | protein_coding | tolerated(0.07) | possibly_damaging(0.739) | TCGA-AA-3821-01 | Colorectum | colon adenocarcinoma | Female | >=65 | I/II | Unknown | Unknown | SD | |
| CLP1 | SNV | Missense_Mutation | novel | c.191C>T | p.Ala64Val | p.A64V | Q92989 | protein_coding | deleterious(0) | possibly_damaging(0.904) | TCGA-AA-3947-01 | Colorectum | colon adenocarcinoma | Female | <65 | I/II | Unknown | Unknown | SD |
| Page: 1 2 3 4 5 |
Top |
Related drugs of malignant transformation related genes |
| Identification of chemicals and drugs interact with genes involved in malignant transfromation |
| (DGIdb 4.0) |
| Entrez ID | Symbol | Category | Interaction Types | Drug Claim Name | Drug Name | PMIDs |
| Page: 1 |

Copyright 2023-Present -The University of Texas Health Science Center at Houston |