
|
|||||
|
 | |
| |
| |
| |
| |
| |
|
Gene: CLN6 |
Gene summary for CLN6 |
| Gene information | Species | Human | Gene symbol | CLN6 | Gene ID | 54982 |
| Gene name | CLN6 transmembrane ER protein | |
| Gene Alias | CLN4A | |
| Cytomap | 15q23 | |
| Gene Type | protein-coding | GO ID | GO:0001573 | UniProtAcc | A0A024R601 |
Top |
Malignant transformation analysis |
| Identification of the aberrant gene expression in precancerous and cancerous lesions by comparing the gene expression of stem-like cells in diseased tissues with normal stem cells |
| Entrez ID | Symbol | Replicates | Species | Organ | Tissue | Adj P-value | Log2FC | Malignancy |
| 54982 | CLN6 | LZE2T | Human | Esophagus | ESCC | 3.94e-07 | 6.05e-01 | 0.082 |
| 54982 | CLN6 | LZE7T | Human | Esophagus | ESCC | 1.40e-08 | 3.32e-01 | 0.0667 |
| 54982 | CLN6 | LZE20T | Human | Esophagus | ESCC | 7.90e-04 | 1.51e-01 | 0.0662 |
| 54982 | CLN6 | LZE22T | Human | Esophagus | ESCC | 1.54e-04 | 3.33e-01 | 0.068 |
| 54982 | CLN6 | LZE24T | Human | Esophagus | ESCC | 2.42e-13 | 2.96e-01 | 0.0596 |
| 54982 | CLN6 | LZE21T | Human | Esophagus | ESCC | 1.78e-08 | 4.67e-01 | 0.0655 |
| 54982 | CLN6 | P1T-E | Human | Esophagus | ESCC | 1.05e-09 | 3.79e-01 | 0.0875 |
| 54982 | CLN6 | P2T-E | Human | Esophagus | ESCC | 3.14e-50 | 8.37e-01 | 0.1177 |
| 54982 | CLN6 | P4T-E | Human | Esophagus | ESCC | 7.53e-29 | 5.92e-01 | 0.1323 |
| 54982 | CLN6 | P5T-E | Human | Esophagus | ESCC | 3.89e-12 | 2.22e-01 | 0.1327 |
| 54982 | CLN6 | P8T-E | Human | Esophagus | ESCC | 1.77e-22 | 4.17e-01 | 0.0889 |
| 54982 | CLN6 | P9T-E | Human | Esophagus | ESCC | 1.67e-23 | 4.76e-01 | 0.1131 |
| 54982 | CLN6 | P10T-E | Human | Esophagus | ESCC | 1.05e-38 | 7.31e-01 | 0.116 |
| 54982 | CLN6 | P11T-E | Human | Esophagus | ESCC | 6.27e-12 | 3.86e-01 | 0.1426 |
| 54982 | CLN6 | P12T-E | Human | Esophagus | ESCC | 6.36e-33 | 5.63e-01 | 0.1122 |
| 54982 | CLN6 | P15T-E | Human | Esophagus | ESCC | 4.28e-40 | 7.84e-01 | 0.1149 |
| 54982 | CLN6 | P16T-E | Human | Esophagus | ESCC | 2.65e-49 | 8.31e-01 | 0.1153 |
| 54982 | CLN6 | P17T-E | Human | Esophagus | ESCC | 3.52e-10 | 4.26e-01 | 0.1278 |
| 54982 | CLN6 | P19T-E | Human | Esophagus | ESCC | 5.23e-14 | 6.46e-01 | 0.1662 |
| 54982 | CLN6 | P20T-E | Human | Esophagus | ESCC | 1.39e-16 | 3.50e-01 | 0.1124 |
| Page: 1 2 3 4 5 |
| Tissue | Expression Dynamics | Abbreviation |
| Esophagus | 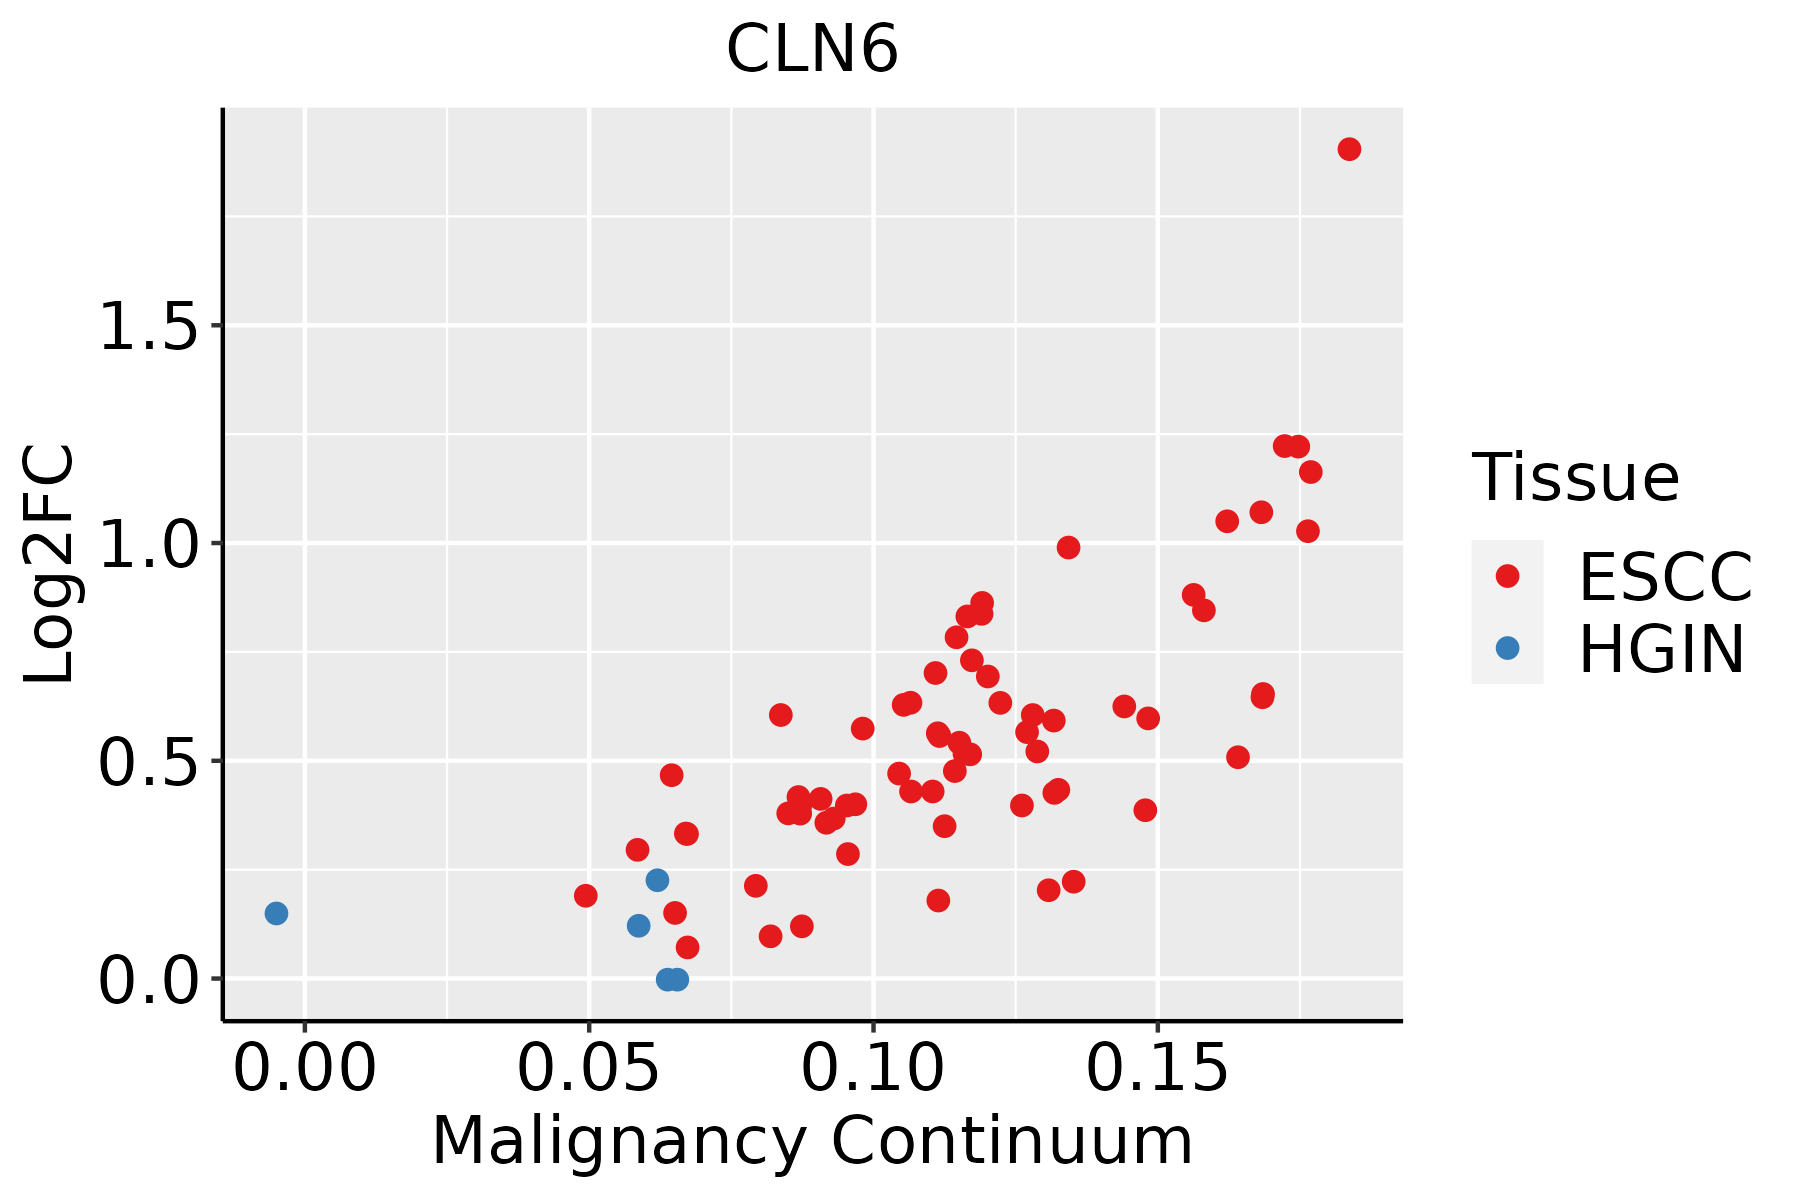 | ESCC: Esophageal squamous cell carcinoma |
| HGIN: High-grade intraepithelial neoplasias | ||
| LGIN: Low-grade intraepithelial neoplasias | ||
| Liver | 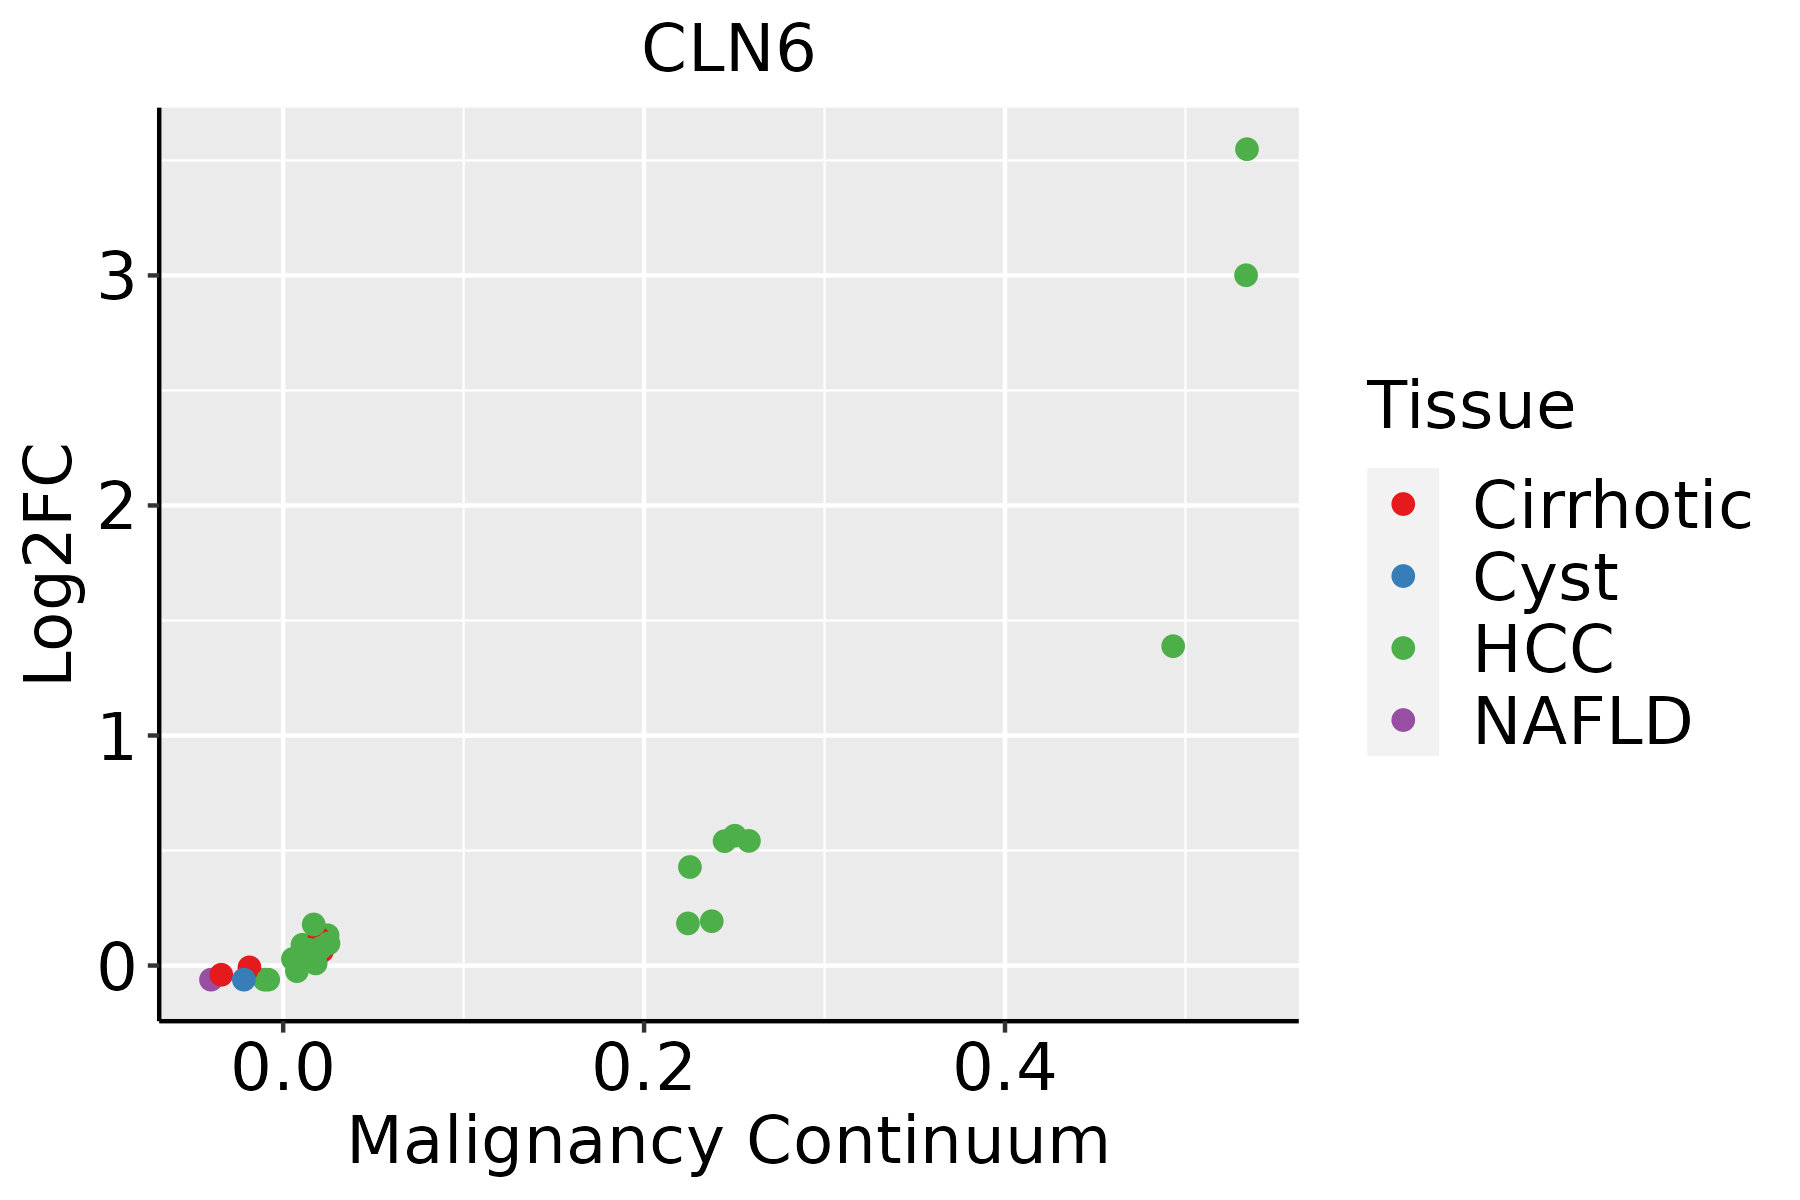 | HCC: Hepatocellular carcinoma |
| NAFLD: Non-alcoholic fatty liver disease | ||
| Oral Cavity |  | EOLP: Erosive Oral lichen planus |
| LP: leukoplakia | ||
| NEOLP: Non-erosive oral lichen planus | ||
| OSCC: Oral squamous cell carcinoma | ||
| Skin |  | AK: Actinic keratosis |
| cSCC: Cutaneous squamous cell carcinoma | ||
| SCCIS:squamous cell carcinoma in situ |
| ∗log2FC in expression of this searched gene in stem-like cells from each diseased tissue sample relative to stem-like cells in normal samples in each tissue plotted against the malignancy continuum. Samples are colored based on if they are from different disease stage. |
Top |
Malignant transformation related pathway analysis |
| Find out the enriched GO biological processes and KEGG pathways involved in transition from healthy to precancer to cancer |
| Tissue | Disease Stage | Enriched GO biological Processes |
| Colorectum | AD |  |
| Colorectum | SER |  |
| Colorectum | MSS |  |
| Colorectum | MSI-H |  |
| Colorectum | FAP |  |
| ∗Top 15 enriched GO BP terms are showed in the bar plot of each disease state in each tissue. Each row represents a significant GO biological process which is colored according to the -log10(p.adjust). |
| Page: 1 2 3 4 5 6 7 8 9 |
| GO ID | Tissue | Disease Stage | Description | Gene Ratio | Bg Ratio | pvalue | p.adjust | Count |
| GO:0045862111 | Esophagus | ESCC | positive regulation of proteolysis | 256/8552 | 372/18723 | 7.88e-20 | 9.43e-18 | 256 |
| GO:000703314 | Esophagus | ESCC | vacuole organization | 127/8552 | 180/18723 | 1.04e-11 | 3.85e-10 | 127 |
| GO:00066433 | Esophagus | ESCC | membrane lipid metabolic process | 130/8552 | 203/18723 | 9.29e-08 | 1.54e-06 | 130 |
| GO:00070403 | Esophagus | ESCC | lysosome organization | 53/8552 | 74/18723 | 5.34e-06 | 5.57e-05 | 53 |
| GO:00801713 | Esophagus | ESCC | lytic vacuole organization | 53/8552 | 74/18723 | 5.34e-06 | 5.57e-05 | 53 |
| GO:00060668 | Esophagus | ESCC | alcohol metabolic process | 202/8552 | 353/18723 | 7.32e-06 | 7.26e-05 | 202 |
| GO:00066652 | Esophagus | ESCC | sphingolipid metabolic process | 96/8552 | 155/18723 | 3.21e-05 | 2.66e-04 | 96 |
| GO:00070353 | Esophagus | ESCC | vacuolar acidification | 20/8552 | 24/18723 | 1.69e-04 | 1.11e-03 | 20 |
| GO:00070423 | Esophagus | ESCC | lysosomal lumen acidification | 11/8552 | 11/18723 | 1.80e-04 | 1.16e-03 | 11 |
| GO:00066642 | Esophagus | ESCC | glycolipid metabolic process | 63/8552 | 100/18723 | 3.55e-04 | 2.06e-03 | 63 |
| GO:19035092 | Esophagus | ESCC | liposaccharide metabolic process | 63/8552 | 101/18723 | 5.25e-04 | 2.90e-03 | 63 |
| GO:19026524 | Esophagus | ESCC | secondary alcohol metabolic process | 87/8552 | 147/18723 | 6.58e-04 | 3.50e-03 | 87 |
| GO:00514521 | Esophagus | ESCC | intracellular pH reduction | 29/8552 | 42/18723 | 1.87e-03 | 8.46e-03 | 29 |
| GO:00458511 | Esophagus | ESCC | pH reduction | 31/8552 | 46/18723 | 2.42e-03 | 1.06e-02 | 31 |
| GO:00066721 | Esophagus | ESCC | ceramide metabolic process | 61/8552 | 102/18723 | 2.82e-03 | 1.19e-02 | 61 |
| GO:00082034 | Esophagus | ESCC | cholesterol metabolic process | 79/8552 | 137/18723 | 3.11e-03 | 1.29e-02 | 79 |
| GO:00161254 | Esophagus | ESCC | sterol metabolic process | 86/8552 | 152/18723 | 4.37e-03 | 1.73e-02 | 86 |
| GO:004586212 | Liver | Cirrhotic | positive regulation of proteolysis | 163/4634 | 372/18723 | 4.18e-16 | 5.14e-14 | 163 |
| GO:000820211 | Liver | Cirrhotic | steroid metabolic process | 143/4634 | 319/18723 | 2.79e-15 | 3.18e-13 | 143 |
| GO:19026521 | Liver | Cirrhotic | secondary alcohol metabolic process | 75/4634 | 147/18723 | 5.62e-12 | 3.91e-10 | 75 |
| Page: 1 2 3 4 |
| Pathway ID | Tissue | Disease Stage | Description | Gene Ratio | Bg Ratio | pvalue | p.adjust | qvalue | Count |
| Page: 1 |
Top |
Cell-cell communication analysis |
| Identification of potential cell-cell interactions between two cell types and their ligand-receptor pairs for different disease states |
| Ligand | Receptor | LRpair | Pathway | Tissue | Disease Stage |
| Page: 1 |
Top |
Single-cell gene regulatory network inference analysis |
| Find out the significant the regulons (TFs) and the target genes of each regulon across cell types for different disease states |
| TF | Cell Type | Tissue | Disease Stage | Target Gene | RSS | Regulon Activity |
| ∗The dot plots of a searched regulon are shown for all cell subpopulations in each disease state of each tissue based on the regulon specific score inferred using pySCENIC and by calculating the average expression. |
| Page: 1 |
Top |
Somatic mutation of malignant transformation related genes |
| Annotation of somatic variants for genes involved in malignant transformation |
| Hugo Symbol | Variant Class | Variant Classification | dbSNP RS | HGVSc | HGVSp | HGVSp Short | SWISSPROT | BIOTYPE | SIFT | PolyPhen | Tumor Sample Barcode | Tissue | Histology | Sex | Age | Stage | Therapy Types | Drugs | Outcome |
| CLN6 | SNV | Missense_Mutation | rs781133812 | c.317N>A | p.Arg106His | p.R106H | Q9NWW5 | protein_coding | deleterious(0.02) | possibly_damaging(0.823) | TCGA-A6-2672-01 | Colorectum | colon adenocarcinoma | Female | >=65 | III/IV | Unknown | Unknown | SD |
| CLN6 | SNV | Missense_Mutation | novel | c.193G>C | p.Ala65Pro | p.A65P | Q9NWW5 | protein_coding | deleterious(0.03) | possibly_damaging(0.744) | TCGA-AA-3854-01 | Colorectum | colon adenocarcinoma | Female | >=65 | I/II | Unknown | Unknown | SD |
| CLN6 | SNV | Missense_Mutation | c.203T>C | p.Val68Ala | p.V68A | Q9NWW5 | protein_coding | tolerated(0.15) | benign(0.003) | TCGA-AA-3994-01 | Colorectum | colon adenocarcinoma | Male | >=65 | III/IV | Chemotherapy | capecitabine | CR | |
| CLN6 | SNV | Missense_Mutation | c.535N>C | p.Cys179Arg | p.C179R | Q9NWW5 | protein_coding | deleterious(0.03) | benign(0.1) | TCGA-AD-6889-01 | Colorectum | colon adenocarcinoma | Male | >=65 | I/II | Chemotherapy | xeloda | PD | |
| CLN6 | insertion | Frame_Shift_Ins | novel | c.578_579insT | p.Ser194GlnfsTer8 | p.S194Qfs*8 | Q9NWW5 | protein_coding | TCGA-A6-5665-01 | Colorectum | colon adenocarcinoma | Female | >=65 | I/II | Unknown | Unknown | PD | ||
| CLN6 | SNV | Missense_Mutation | novel | c.465G>T | p.Lys155Asn | p.K155N | Q9NWW5 | protein_coding | deleterious(0.05) | benign(0.003) | TCGA-A5-A2K5-01 | Endometrium | uterine corpus endometrioid carcinoma | Female | >=65 | I/II | Unknown | Unknown | SD |
| CLN6 | SNV | Missense_Mutation | novel | c.808C>A | p.Leu270Ile | p.L270I | Q9NWW5 | protein_coding | deleterious(0.01) | probably_damaging(0.996) | TCGA-AP-A051-01 | Endometrium | uterine corpus endometrioid carcinoma | Female | >=65 | I/II | Unknown | Unknown | SD |
| CLN6 | SNV | Missense_Mutation | novel | c.450N>T | p.Glu150Asp | p.E150D | Q9NWW5 | protein_coding | tolerated(0.28) | benign(0.038) | TCGA-AX-A0IZ-01 | Endometrium | uterine corpus endometrioid carcinoma | Female | <65 | I/II | Unknown | Unknown | SD |
| CLN6 | SNV | Missense_Mutation | rs145746878 | c.754C>T | p.Arg252Cys | p.R252C | Q9NWW5 | protein_coding | deleterious(0.03) | benign(0.007) | TCGA-AX-A2HC-01 | Endometrium | uterine corpus endometrioid carcinoma | Female | <65 | III/IV | Chemotherapy | paclitaxel | PD |
| CLN6 | SNV | Missense_Mutation | rs781133812 | c.317G>A | p.Arg106His | p.R106H | Q9NWW5 | protein_coding | deleterious(0.02) | possibly_damaging(0.823) | TCGA-AX-A2HC-01 | Endometrium | uterine corpus endometrioid carcinoma | Female | <65 | III/IV | Chemotherapy | paclitaxel | PD |
| Page: 1 2 3 |
Top |
Related drugs of malignant transformation related genes |
| Identification of chemicals and drugs interact with genes involved in malignant transfromation |
| (DGIdb 4.0) |
| Entrez ID | Symbol | Category | Interaction Types | Drug Claim Name | Drug Name | PMIDs |
| Page: 1 |

Copyright 2023-Present -The University of Texas Health Science Center at Houston |