
|
|||||
|
 | |
| |
| |
| |
| |
| |
|
Gene: CLN5 |
Gene summary for CLN5 |
| Gene information | Species | Human | Gene symbol | CLN5 | Gene ID | 1203 |
| Gene name | CLN5 intracellular trafficking protein | |
| Gene Alias | CLN5 | |
| Cytomap | 13q22.3 | |
| Gene Type | protein-coding | GO ID | GO:0006465 | UniProtAcc | A0A024R644 |
Top |
Malignant transformation analysis |
| Identification of the aberrant gene expression in precancerous and cancerous lesions by comparing the gene expression of stem-like cells in diseased tissues with normal stem cells |
| Entrez ID | Symbol | Replicates | Species | Organ | Tissue | Adj P-value | Log2FC | Malignancy |
| 1203 | CLN5 | LZE4T | Human | Esophagus | ESCC | 1.16e-07 | 1.30e-01 | 0.0811 |
| 1203 | CLN5 | LZE5T | Human | Esophagus | ESCC | 2.67e-02 | 2.73e-01 | 0.0514 |
| 1203 | CLN5 | LZE7T | Human | Esophagus | ESCC | 3.10e-03 | 2.03e-01 | 0.0667 |
| 1203 | CLN5 | LZE8T | Human | Esophagus | ESCC | 1.95e-05 | 1.15e-01 | 0.067 |
| 1203 | CLN5 | LZE20T | Human | Esophagus | ESCC | 4.34e-07 | 1.34e-01 | 0.0662 |
| 1203 | CLN5 | LZE24T | Human | Esophagus | ESCC | 6.50e-08 | 2.03e-01 | 0.0596 |
| 1203 | CLN5 | P1T-E | Human | Esophagus | ESCC | 2.06e-04 | 2.32e-01 | 0.0875 |
| 1203 | CLN5 | P2T-E | Human | Esophagus | ESCC | 7.60e-18 | 2.42e-01 | 0.1177 |
| 1203 | CLN5 | P4T-E | Human | Esophagus | ESCC | 1.08e-19 | 3.46e-01 | 0.1323 |
| 1203 | CLN5 | P5T-E | Human | Esophagus | ESCC | 6.89e-06 | 9.61e-02 | 0.1327 |
| 1203 | CLN5 | P8T-E | Human | Esophagus | ESCC | 2.17e-24 | 4.96e-01 | 0.0889 |
| 1203 | CLN5 | P9T-E | Human | Esophagus | ESCC | 1.20e-19 | 4.74e-01 | 0.1131 |
| 1203 | CLN5 | P10T-E | Human | Esophagus | ESCC | 7.48e-35 | 5.83e-01 | 0.116 |
| 1203 | CLN5 | P11T-E | Human | Esophagus | ESCC | 2.95e-18 | 7.44e-01 | 0.1426 |
| 1203 | CLN5 | P12T-E | Human | Esophagus | ESCC | 5.92e-13 | 2.65e-01 | 0.1122 |
| 1203 | CLN5 | P15T-E | Human | Esophagus | ESCC | 6.60e-09 | 2.37e-01 | 0.1149 |
| 1203 | CLN5 | P16T-E | Human | Esophagus | ESCC | 3.39e-23 | 4.06e-01 | 0.1153 |
| 1203 | CLN5 | P19T-E | Human | Esophagus | ESCC | 4.62e-11 | 6.34e-01 | 0.1662 |
| 1203 | CLN5 | P20T-E | Human | Esophagus | ESCC | 3.97e-12 | 3.11e-01 | 0.1124 |
| 1203 | CLN5 | P21T-E | Human | Esophagus | ESCC | 9.15e-18 | 2.49e-01 | 0.1617 |
| Page: 1 2 3 4 5 |
| Tissue | Expression Dynamics | Abbreviation |
| Esophagus |  | ESCC: Esophageal squamous cell carcinoma |
| HGIN: High-grade intraepithelial neoplasias | ||
| LGIN: Low-grade intraepithelial neoplasias | ||
| Oral Cavity | 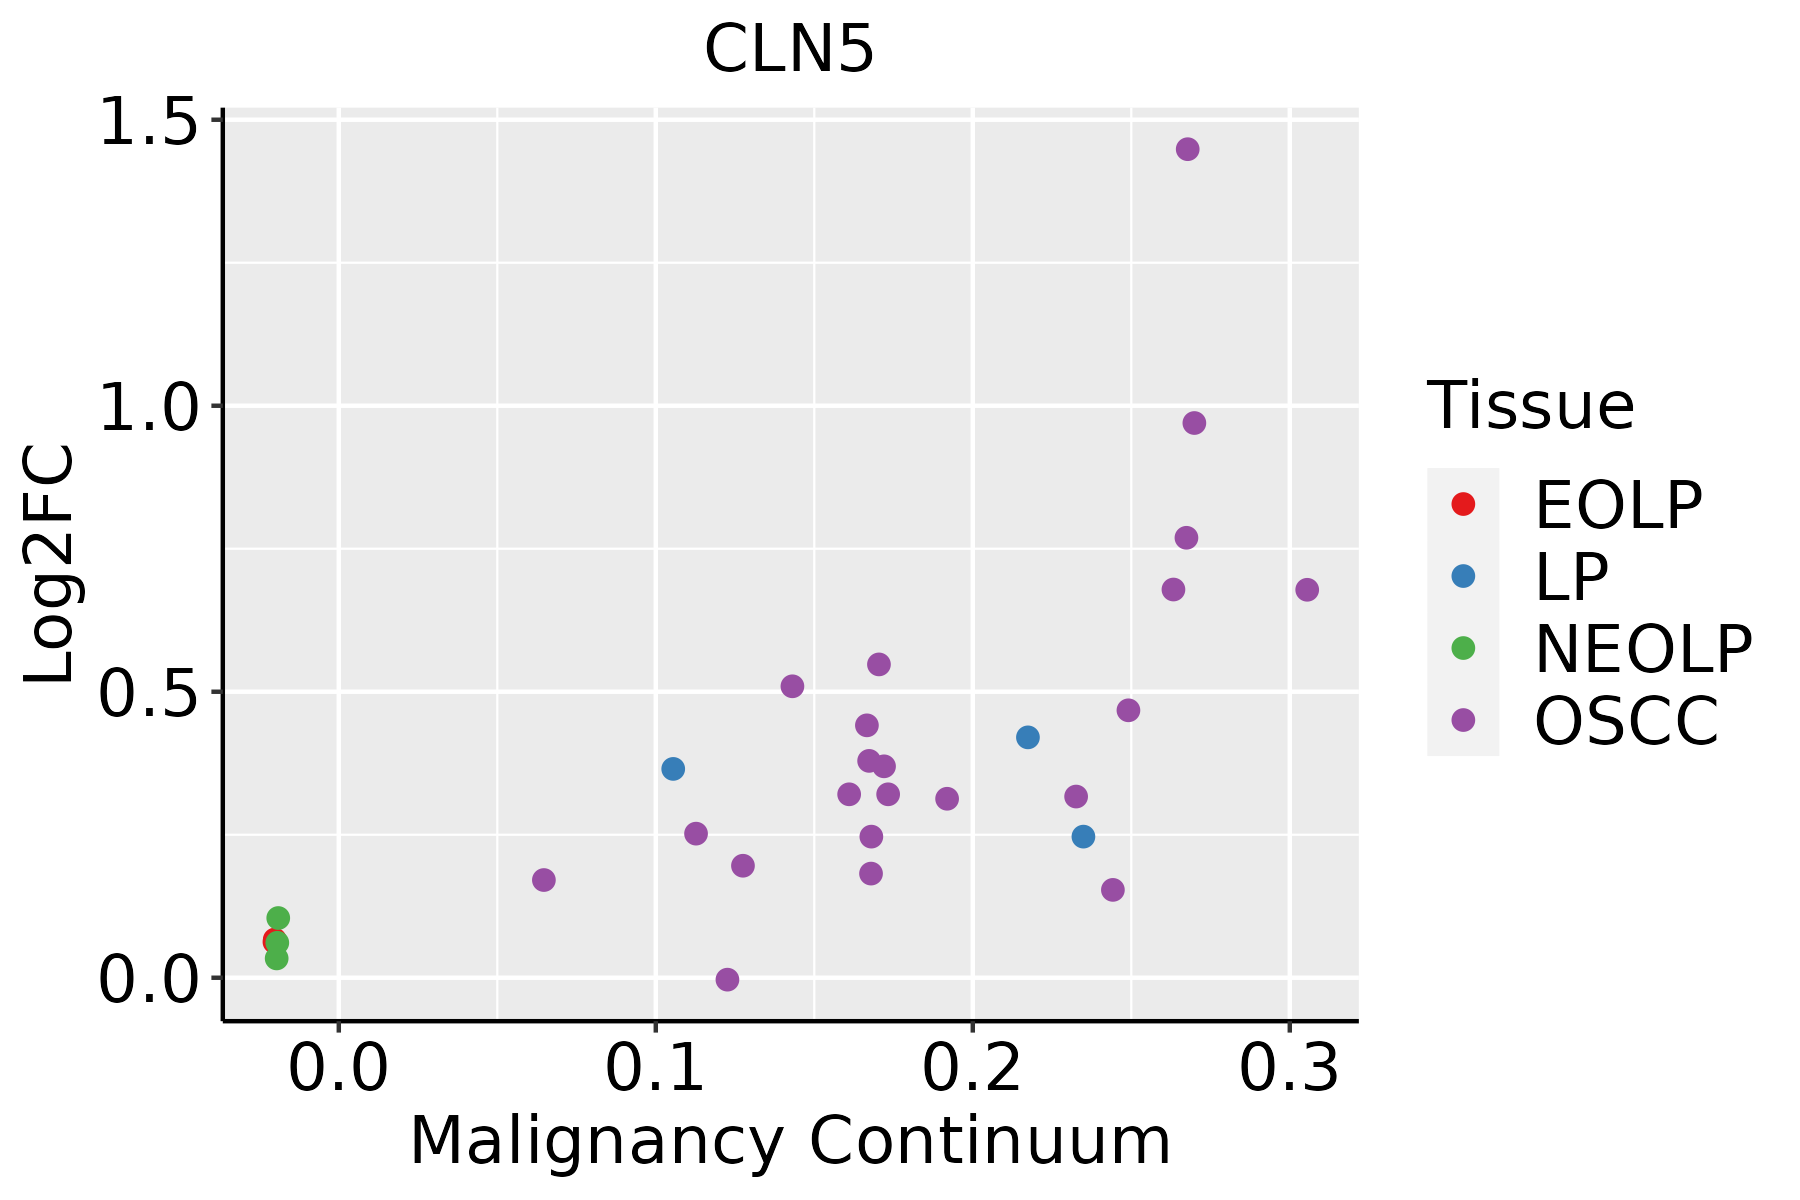 | EOLP: Erosive Oral lichen planus |
| LP: leukoplakia | ||
| NEOLP: Non-erosive oral lichen planus | ||
| OSCC: Oral squamous cell carcinoma | ||
| Thyroid | 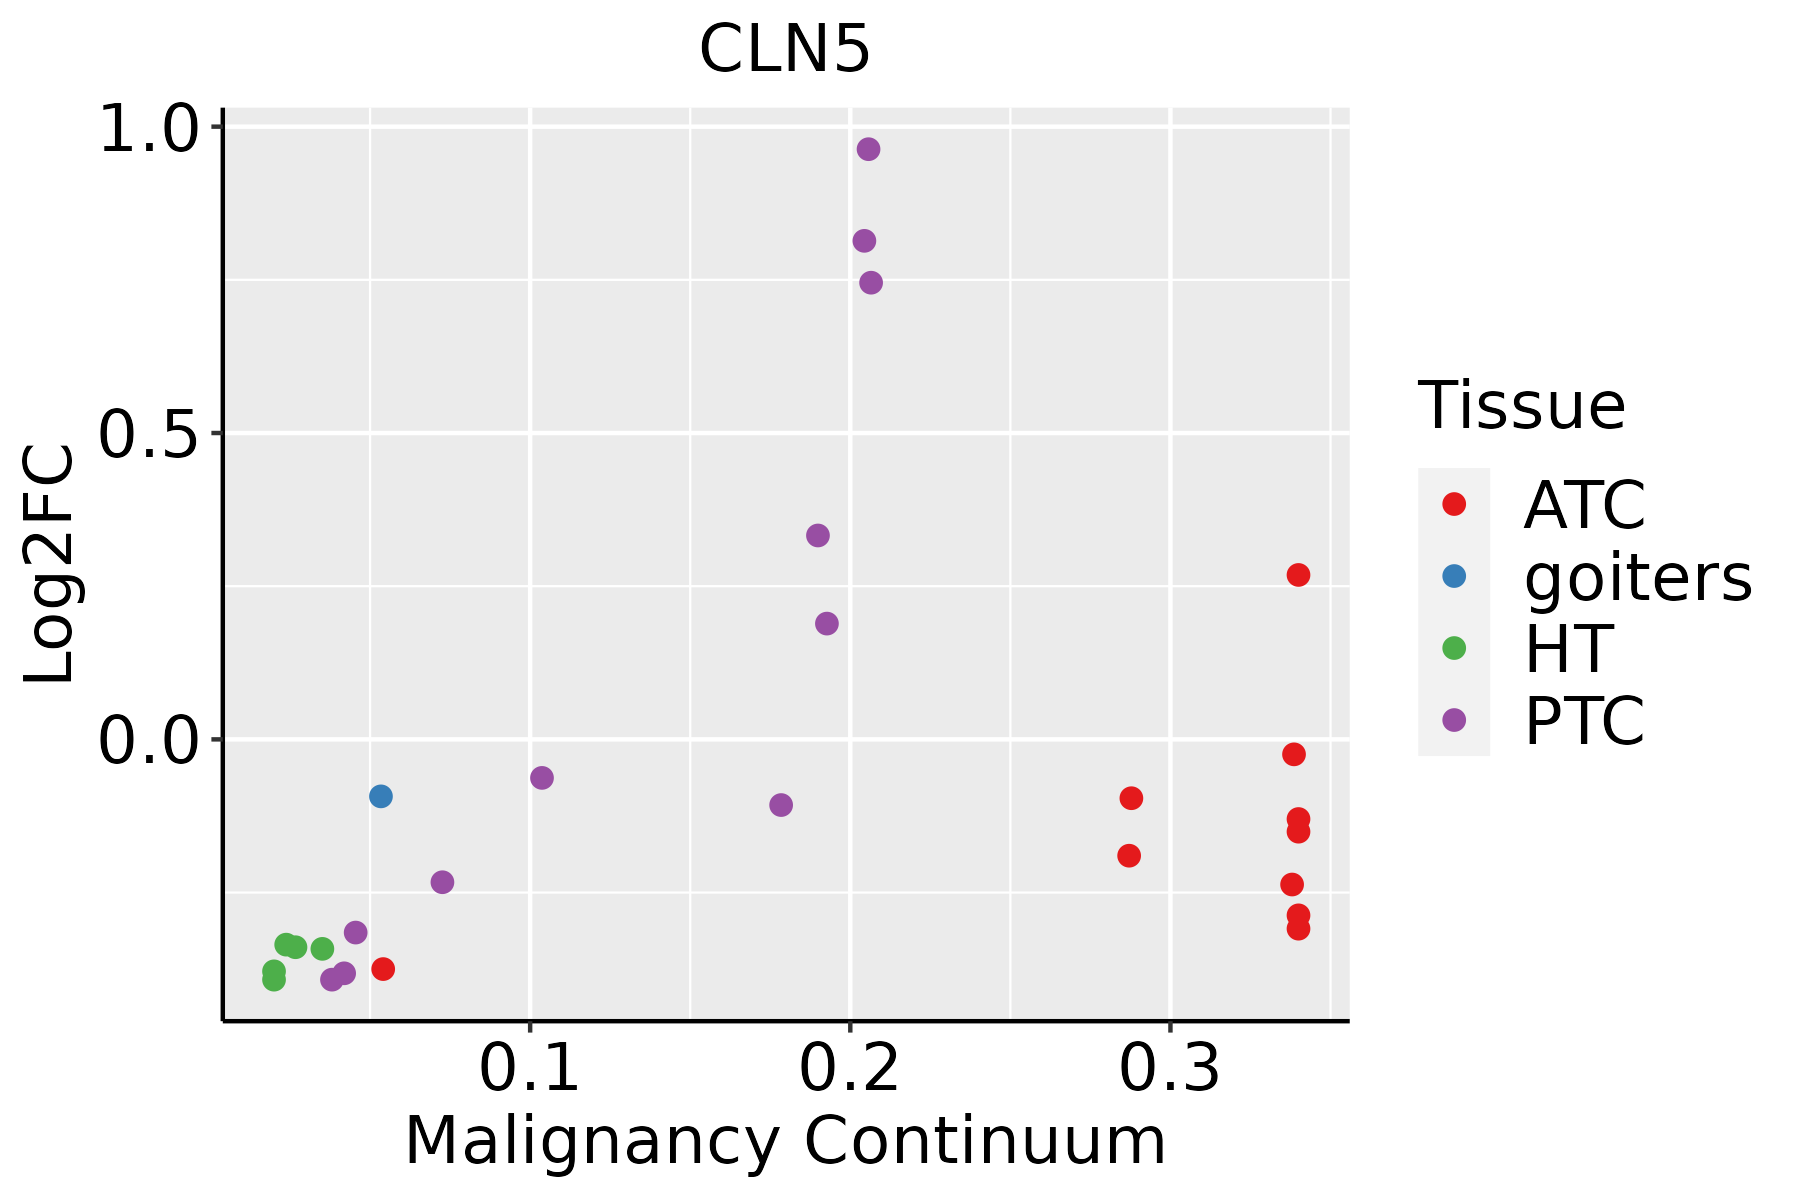 | ATC: Anaplastic thyroid cancer |
| HT: Hashimoto's thyroiditis | ||
| PTC: Papillary thyroid cancer |
| ∗log2FC in expression of this searched gene in stem-like cells from each diseased tissue sample relative to stem-like cells in normal samples in each tissue plotted against the malignancy continuum. Samples are colored based on if they are from different disease stage. |
Top |
Malignant transformation related pathway analysis |
| Find out the enriched GO biological processes and KEGG pathways involved in transition from healthy to precancer to cancer |
| Tissue | Disease Stage | Enriched GO biological Processes |
| Colorectum | AD |  |
| Colorectum | SER |  |
| Colorectum | MSS |  |
| Colorectum | MSI-H |  |
| Colorectum | FAP |  |
| ∗Top 15 enriched GO BP terms are showed in the bar plot of each disease state in each tissue. Each row represents a significant GO biological process which is colored according to the -log10(p.adjust). |
| Page: 1 2 3 4 5 6 7 8 9 |
| GO ID | Tissue | Disease Stage | Description | Gene Ratio | Bg Ratio | pvalue | p.adjust | Count |
| GO:0051098111 | Esophagus | ESCC | regulation of binding | 251/8552 | 363/18723 | 6.73e-20 | 8.46e-18 | 251 |
| GO:001619715 | Esophagus | ESCC | endosomal transport | 168/8552 | 230/18723 | 2.28e-17 | 1.93e-15 | 168 |
| GO:001648210 | Esophagus | ESCC | cytosolic transport | 124/8552 | 168/18723 | 9.69e-14 | 4.69e-12 | 124 |
| GO:000703314 | Esophagus | ESCC | vacuole organization | 127/8552 | 180/18723 | 1.04e-11 | 3.85e-10 | 127 |
| GO:0051099111 | Esophagus | ESCC | positive regulation of binding | 122/8552 | 173/18723 | 2.79e-11 | 9.45e-10 | 122 |
| GO:005160418 | Esophagus | ESCC | protein maturation | 189/8552 | 294/18723 | 7.64e-11 | 2.39e-09 | 189 |
| GO:00421477 | Esophagus | ESCC | retrograde transport, endosome to Golgi | 63/8552 | 91/18723 | 4.58e-06 | 4.87e-05 | 63 |
| GO:00700854 | Esophagus | ESCC | glycosylation | 144/8552 | 240/18723 | 5.12e-06 | 5.38e-05 | 144 |
| GO:00070403 | Esophagus | ESCC | lysosome organization | 53/8552 | 74/18723 | 5.34e-06 | 5.57e-05 | 53 |
| GO:00801713 | Esophagus | ESCC | lytic vacuole organization | 53/8552 | 74/18723 | 5.34e-06 | 5.57e-05 | 53 |
| GO:001648514 | Esophagus | ESCC | protein processing | 134/8552 | 225/18723 | 1.81e-05 | 1.60e-04 | 134 |
| GO:00070353 | Esophagus | ESCC | vacuolar acidification | 20/8552 | 24/18723 | 1.69e-04 | 1.11e-03 | 20 |
| GO:00070423 | Esophagus | ESCC | lysosomal lumen acidification | 11/8552 | 11/18723 | 1.80e-04 | 1.16e-03 | 11 |
| GO:000646516 | Esophagus | ESCC | signal peptide processing | 13/8552 | 14/18723 | 3.02e-04 | 1.81e-03 | 13 |
| GO:00514521 | Esophagus | ESCC | intracellular pH reduction | 29/8552 | 42/18723 | 1.87e-03 | 8.46e-03 | 29 |
| GO:00458511 | Esophagus | ESCC | pH reduction | 31/8552 | 46/18723 | 2.42e-03 | 1.06e-02 | 31 |
| GO:005109820 | Oral cavity | OSCC | regulation of binding | 212/7305 | 363/18723 | 3.88e-14 | 2.15e-12 | 212 |
| GO:00161979 | Oral cavity | OSCC | endosomal transport | 141/7305 | 230/18723 | 5.40e-12 | 2.06e-10 | 141 |
| GO:00070335 | Oral cavity | OSCC | vacuole organization | 115/7305 | 180/18723 | 1.11e-11 | 4.00e-10 | 115 |
| GO:005160410 | Oral cavity | OSCC | protein maturation | 170/7305 | 294/18723 | 3.97e-11 | 1.28e-09 | 170 |
| Page: 1 2 3 4 |
| Pathway ID | Tissue | Disease Stage | Description | Gene Ratio | Bg Ratio | pvalue | p.adjust | qvalue | Count |
| hsa0414222 | Esophagus | ESCC | Lysosome | 102/4205 | 132/8465 | 5.11e-11 | 7.13e-10 | 3.65e-10 | 102 |
| hsa0414232 | Esophagus | ESCC | Lysosome | 102/4205 | 132/8465 | 5.11e-11 | 7.13e-10 | 3.65e-10 | 102 |
| hsa041425 | Oral cavity | OSCC | Lysosome | 87/3704 | 132/8465 | 1.97e-07 | 1.35e-06 | 6.86e-07 | 87 |
| hsa0414212 | Oral cavity | OSCC | Lysosome | 87/3704 | 132/8465 | 1.97e-07 | 1.35e-06 | 6.86e-07 | 87 |
| Page: 1 |
Top |
Cell-cell communication analysis |
| Identification of potential cell-cell interactions between two cell types and their ligand-receptor pairs for different disease states |
| Ligand | Receptor | LRpair | Pathway | Tissue | Disease Stage |
| Page: 1 |
Top |
Single-cell gene regulatory network inference analysis |
| Find out the significant the regulons (TFs) and the target genes of each regulon across cell types for different disease states |
| TF | Cell Type | Tissue | Disease Stage | Target Gene | RSS | Regulon Activity |
| ∗The dot plots of a searched regulon are shown for all cell subpopulations in each disease state of each tissue based on the regulon specific score inferred using pySCENIC and by calculating the average expression. |
| Page: 1 |
Top |
Somatic mutation of malignant transformation related genes |
| Annotation of somatic variants for genes involved in malignant transformation |
| Hugo Symbol | Variant Class | Variant Classification | dbSNP RS | HGVSc | HGVSp | HGVSp Short | SWISSPROT | BIOTYPE | SIFT | PolyPhen | Tumor Sample Barcode | Tissue | Histology | Sex | Age | Stage | Therapy Types | Drugs | Outcome |
| CLN5 | SNV | Missense_Mutation | c.832N>C | p.Tyr278His | p.Y278H | protein_coding | deleterious(0.04) | probably_damaging(0.97) | TCGA-A8-A06Q-01 | Breast | breast invasive carcinoma | Female | <65 | III/IV | Unknown | Unknown | SD | ||
| CLN5 | SNV | Missense_Mutation | c.757G>C | p.Glu253Gln | p.E253Q | protein_coding | tolerated(0.15) | probably_damaging(0.939) | TCGA-LP-A5U2-01 | Cervix | cervical & endocervical cancer | Female | <65 | III/IV | Unknown | Unknown | SD | ||
| CLN5 | SNV | Missense_Mutation | c.1126N>G | p.Phe376Val | p.F376V | protein_coding | tolerated(0.23) | possibly_damaging(0.511) | TCGA-AA-3510-01 | Colorectum | colon adenocarcinoma | Male | >=65 | I/II | Unknown | Unknown | SD | ||
| CLN5 | SNV | Missense_Mutation | novel | c.1081N>G | p.Phe361Val | p.F361V | protein_coding | tolerated(0.16) | possibly_damaging(0.591) | TCGA-AA-A00N-01 | Colorectum | colon adenocarcinoma | Male | >=65 | I/II | Unknown | Unknown | PD | |
| CLN5 | SNV | Missense_Mutation | c.596G>A | p.Arg199Gln | p.R199Q | protein_coding | tolerated(0.12) | probably_damaging(0.997) | TCGA-AG-A002-01 | Colorectum | rectum adenocarcinoma | Male | <65 | I/II | Unknown | Unknown | SD | ||
| CLN5 | SNV | Missense_Mutation | rs770688728 | c.1016G>T | p.Arg339Ile | p.R339I | protein_coding | deleterious(0.03) | benign(0.419) | TCGA-AP-A056-01 | Endometrium | uterine corpus endometrioid carcinoma | Female | <65 | I/II | Unknown | Unknown | SD | |
| CLN5 | SNV | Missense_Mutation | c.322N>T | p.Arg108Cys | p.R108C | protein_coding | deleterious_low_confidence(0) | probably_damaging(0.999) | TCGA-AP-A059-01 | Endometrium | uterine corpus endometrioid carcinoma | Female | >=65 | I/II | Unknown | Unknown | SD | ||
| CLN5 | SNV | Missense_Mutation | novel | c.1160T>G | p.Phe387Cys | p.F387C | protein_coding | deleterious(0.01) | probably_damaging(0.976) | TCGA-AP-A1E0-01 | Endometrium | uterine corpus endometrioid carcinoma | Female | <65 | III/IV | Chemotherapy | paclitaxel | SD | |
| CLN5 | SNV | Missense_Mutation | novel | c.758N>T | p.Glu253Val | p.E253V | protein_coding | deleterious(0.02) | probably_damaging(0.974) | TCGA-AX-A06F-01 | Endometrium | uterine corpus endometrioid carcinoma | Female | <65 | III/IV | Chemotherapy | carboplatin | SD | |
| CLN5 | SNV | Missense_Mutation | novel | c.448N>A | p.Val150Ile | p.V150I | protein_coding | tolerated(0.13) | benign(0.175) | TCGA-AX-A1C5-01 | Endometrium | uterine corpus endometrioid carcinoma | Female | <65 | III/IV | Unspecific | Carboplatin | SD |
| Page: 1 2 3 4 |
Top |
Related drugs of malignant transformation related genes |
| Identification of chemicals and drugs interact with genes involved in malignant transfromation |
| (DGIdb 4.0) |
| Entrez ID | Symbol | Category | Interaction Types | Drug Claim Name | Drug Name | PMIDs |
| Page: 1 |

Copyright 2023-Present -The University of Texas Health Science Center at Houston |