
|
|||||
|
 | |
| |
| |
| |
| |
| |
|
Gene: CLMN |
Gene summary for CLMN |
| Gene information | Species | Human | Gene symbol | CLMN | Gene ID | 79789 |
| Gene name | calmin | |
| Gene Alias | CLMN | |
| Cytomap | 14q32.13 | |
| Gene Type | protein-coding | GO ID | GO:0006810 | UniProtAcc | Q6NUQ2 |
Top |
Malignant transformation analysis |
| Identification of the aberrant gene expression in precancerous and cancerous lesions by comparing the gene expression of stem-like cells in diseased tissues with normal stem cells |
| Entrez ID | Symbol | Replicates | Species | Organ | Tissue | Adj P-value | Log2FC | Malignancy |
| 79789 | CLMN | HTA11_3410_2000001011 | Human | Colorectum | AD | 2.69e-24 | -6.60e-01 | 0.0155 |
| 79789 | CLMN | HTA11_2951_2000001011 | Human | Colorectum | AD | 1.36e-04 | -7.07e-01 | 0.0216 |
| 79789 | CLMN | HTA11_347_2000001011 | Human | Colorectum | AD | 7.90e-27 | 1.01e+00 | -0.1954 |
| 79789 | CLMN | HTA11_411_2000001011 | Human | Colorectum | SER | 2.39e-02 | 7.03e-01 | -0.2602 |
| 79789 | CLMN | HTA11_866_3004761011 | Human | Colorectum | AD | 2.04e-13 | -5.81e-01 | 0.096 |
| 79789 | CLMN | HTA11_8622_2000001021 | Human | Colorectum | SER | 2.09e-03 | -5.06e-01 | 0.0528 |
| 79789 | CLMN | HTA11_10711_2000001011 | Human | Colorectum | AD | 8.48e-08 | -4.93e-01 | 0.0338 |
| 79789 | CLMN | HTA11_7696_3000711011 | Human | Colorectum | AD | 1.50e-04 | -3.72e-01 | 0.0674 |
| 79789 | CLMN | HTA11_99999970781_79442 | Human | Colorectum | MSS | 3.07e-13 | -5.43e-01 | 0.294 |
| 79789 | CLMN | HTA11_99999971662_82457 | Human | Colorectum | MSS | 5.54e-26 | -6.98e-01 | 0.3859 |
| 79789 | CLMN | HTA11_99999974143_84620 | Human | Colorectum | MSS | 9.98e-30 | -7.49e-01 | 0.3005 |
| 79789 | CLMN | F007 | Human | Colorectum | FAP | 2.31e-14 | -7.09e-01 | 0.1176 |
| 79789 | CLMN | A001-C-207 | Human | Colorectum | FAP | 8.12e-14 | -5.29e-01 | 0.1278 |
| 79789 | CLMN | A015-C-203 | Human | Colorectum | FAP | 5.10e-39 | -6.22e-01 | -0.1294 |
| 79789 | CLMN | A015-C-204 | Human | Colorectum | FAP | 1.71e-08 | -3.61e-01 | -0.0228 |
| 79789 | CLMN | A014-C-040 | Human | Colorectum | FAP | 1.44e-08 | -6.13e-01 | -0.1184 |
| 79789 | CLMN | A002-C-201 | Human | Colorectum | FAP | 5.19e-20 | -4.98e-01 | 0.0324 |
| 79789 | CLMN | A002-C-203 | Human | Colorectum | FAP | 6.96e-05 | -3.08e-01 | 0.2786 |
| 79789 | CLMN | A001-C-119 | Human | Colorectum | FAP | 1.70e-08 | -4.94e-01 | -0.1557 |
| 79789 | CLMN | A001-C-108 | Human | Colorectum | FAP | 6.82e-22 | -3.97e-01 | -0.0272 |
| Page: 1 2 3 4 5 6 |
| Tissue | Expression Dynamics | Abbreviation |
| Colorectum (GSE201348) |  | FAP: Familial adenomatous polyposis |
| CRC: Colorectal cancer | ||
| Colorectum (HTA11) |  | AD: Adenomas |
| SER: Sessile serrated lesions | ||
| MSI-H: Microsatellite-high colorectal cancer | ||
| MSS: Microsatellite stable colorectal cancer | ||
| Esophagus | 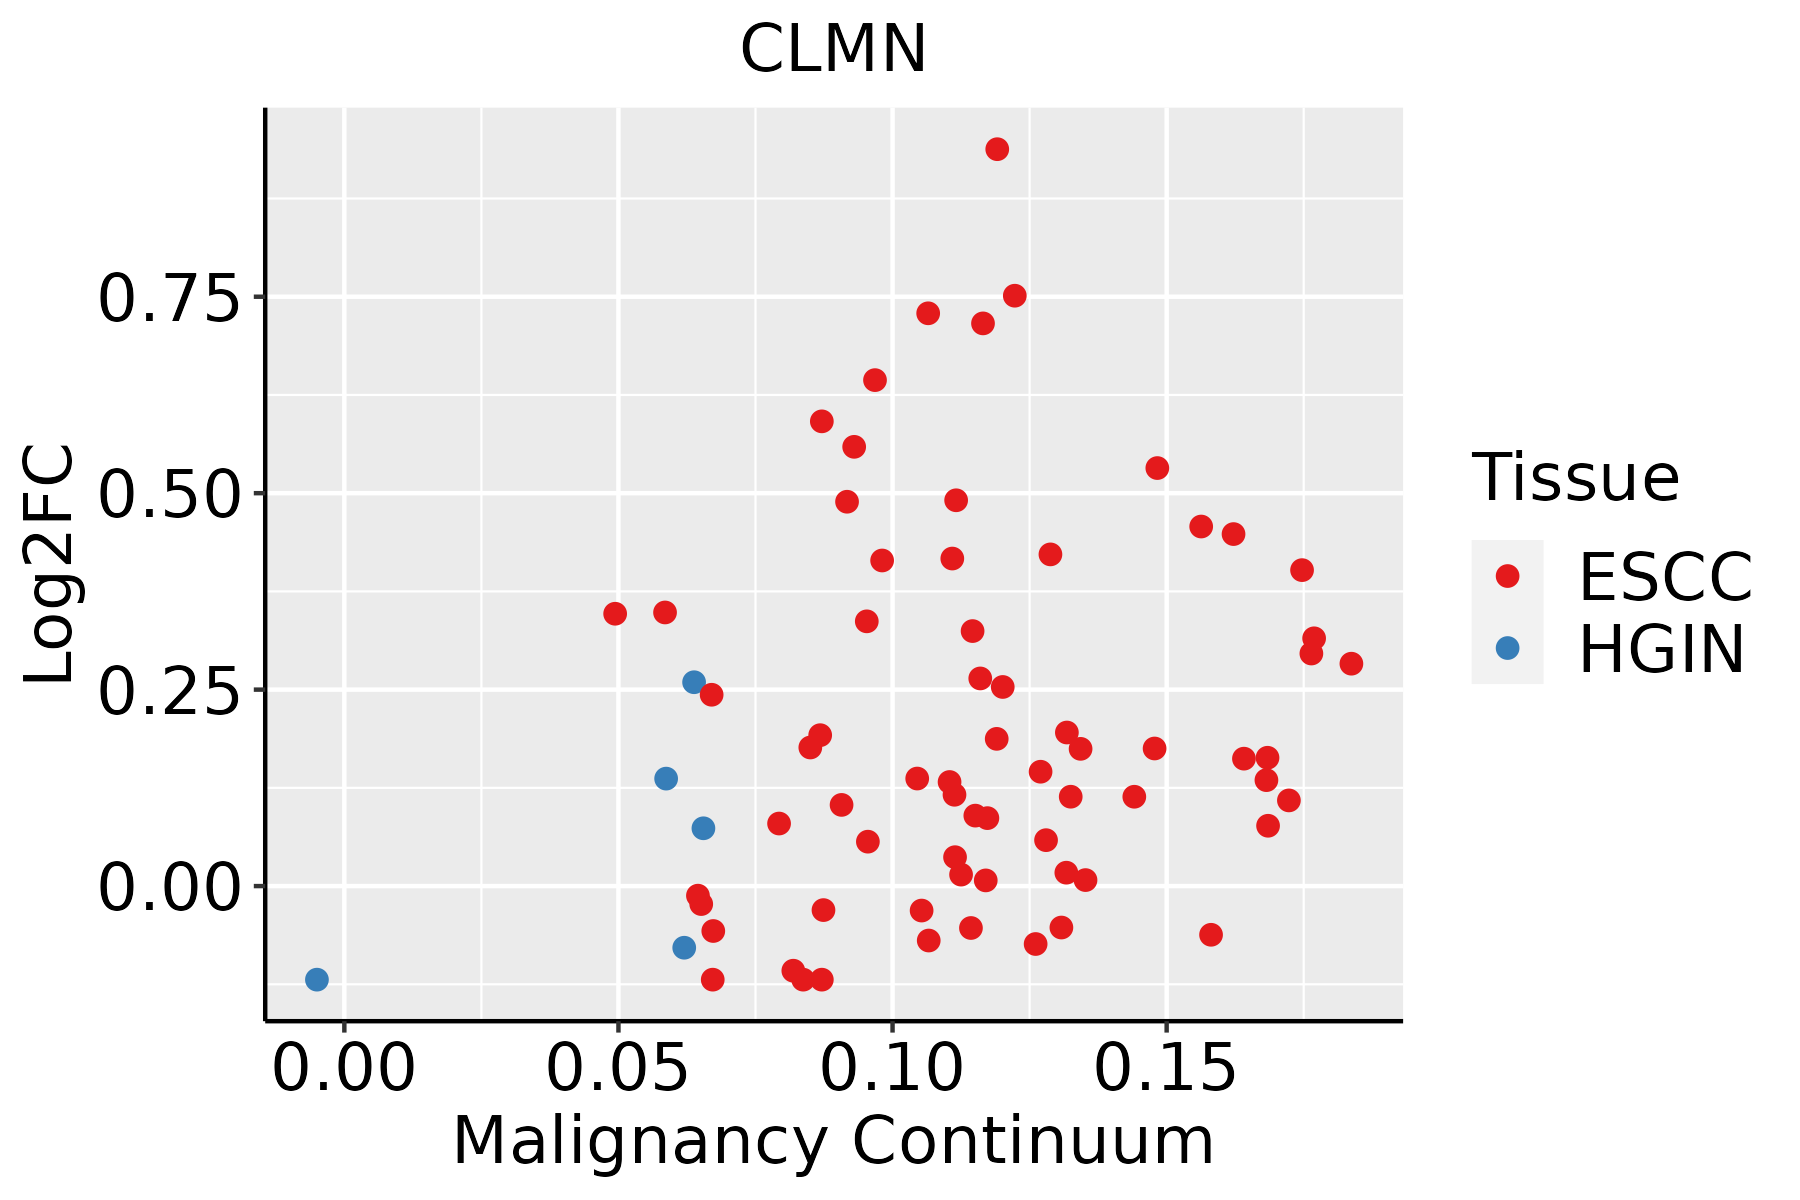 | ESCC: Esophageal squamous cell carcinoma |
| HGIN: High-grade intraepithelial neoplasias | ||
| LGIN: Low-grade intraepithelial neoplasias | ||
| Liver |  | HCC: Hepatocellular carcinoma |
| NAFLD: Non-alcoholic fatty liver disease | ||
| Lung |  | AAH: Atypical adenomatous hyperplasia |
| AIS: Adenocarcinoma in situ | ||
| IAC: Invasive lung adenocarcinoma | ||
| MIA: Minimally invasive adenocarcinoma |
| ∗log2FC in expression of this searched gene in stem-like cells from each diseased tissue sample relative to stem-like cells in normal samples in each tissue plotted against the malignancy continuum. Samples are colored based on if they are from different disease stage. |
Top |
Malignant transformation related pathway analysis |
| Find out the enriched GO biological processes and KEGG pathways involved in transition from healthy to precancer to cancer |
| Tissue | Disease Stage | Enriched GO biological Processes |
| Colorectum | AD |  |
| Colorectum | SER |  |
| Colorectum | MSS |  |
| Colorectum | MSI-H |  |
| Colorectum | FAP |  |
| ∗Top 15 enriched GO BP terms are showed in the bar plot of each disease state in each tissue. Each row represents a significant GO biological process which is colored according to the -log10(p.adjust). |
| Page: 1 2 3 4 5 6 7 8 9 |
| GO ID | Tissue | Disease Stage | Description | Gene Ratio | Bg Ratio | pvalue | p.adjust | Count |
| GO:0051656 | Colorectum | AD | establishment of organelle localization | 131/3918 | 390/18723 | 3.00e-09 | 2.06e-07 | 131 |
| GO:0007097 | Colorectum | AD | nuclear migration | 10/3918 | 20/18723 | 3.67e-03 | 2.60e-02 | 10 |
| GO:0051647 | Colorectum | AD | nucleus localization | 11/3918 | 24/18723 | 5.43e-03 | 3.55e-02 | 11 |
| GO:00516561 | Colorectum | SER | establishment of organelle localization | 100/2897 | 390/18723 | 1.11e-07 | 6.79e-06 | 100 |
| GO:00070971 | Colorectum | SER | nuclear migration | 8/2897 | 20/18723 | 7.14e-03 | 4.99e-02 | 8 |
| GO:00516471 | Colorectum | SER | nucleus localization | 9/2897 | 24/18723 | 7.19e-03 | 4.99e-02 | 9 |
| GO:00516562 | Colorectum | MSS | establishment of organelle localization | 115/3467 | 390/18723 | 7.30e-08 | 3.67e-06 | 115 |
| GO:00070972 | Colorectum | MSS | nuclear migration | 9/3467 | 20/18723 | 5.90e-03 | 3.98e-02 | 9 |
| GO:00516472 | Colorectum | MSS | nucleus localization | 10/3467 | 24/18723 | 7.25e-03 | 4.63e-02 | 10 |
| GO:00516563 | Colorectum | FAP | establishment of organelle localization | 97/2622 | 390/18723 | 5.91e-09 | 9.48e-07 | 97 |
| GO:00070973 | Colorectum | FAP | nuclear migration | 9/2622 | 20/18723 | 7.94e-04 | 8.35e-03 | 9 |
| GO:00516473 | Colorectum | FAP | nucleus localization | 9/2622 | 24/18723 | 3.66e-03 | 2.60e-02 | 9 |
| GO:00516564 | Colorectum | CRC | establishment of organelle localization | 76/2078 | 390/18723 | 6.53e-07 | 4.50e-05 | 76 |
| GO:00070974 | Colorectum | CRC | nuclear migration | 8/2078 | 20/18723 | 8.36e-04 | 1.04e-02 | 8 |
| GO:00516474 | Colorectum | CRC | nucleus localization | 8/2078 | 24/18723 | 3.25e-03 | 2.81e-02 | 8 |
| GO:005165616 | Esophagus | HGIN | establishment of organelle localization | 90/2587 | 390/18723 | 4.27e-07 | 1.94e-05 | 90 |
| GO:005165617 | Esophagus | ESCC | establishment of organelle localization | 273/8552 | 390/18723 | 9.13e-23 | 1.81e-20 | 273 |
| GO:00070979 | Esophagus | ESCC | nuclear migration | 15/8552 | 20/18723 | 7.60e-03 | 2.71e-02 | 15 |
| GO:00516478 | Esophagus | ESCC | nucleus localization | 17/8552 | 24/18723 | 1.13e-02 | 3.81e-02 | 17 |
| GO:00070975 | Liver | NAFLD | nuclear migration | 7/1882 | 20/18723 | 2.44e-03 | 2.27e-02 | 7 |
| Page: 1 2 |
| Pathway ID | Tissue | Disease Stage | Description | Gene Ratio | Bg Ratio | pvalue | p.adjust | qvalue | Count |
| Page: 1 |
Top |
Cell-cell communication analysis |
| Identification of potential cell-cell interactions between two cell types and their ligand-receptor pairs for different disease states |
| Ligand | Receptor | LRpair | Pathway | Tissue | Disease Stage |
| Page: 1 |
Top |
Single-cell gene regulatory network inference analysis |
| Find out the significant the regulons (TFs) and the target genes of each regulon across cell types for different disease states |
| TF | Cell Type | Tissue | Disease Stage | Target Gene | RSS | Regulon Activity |
| ∗The dot plots of a searched regulon are shown for all cell subpopulations in each disease state of each tissue based on the regulon specific score inferred using pySCENIC and by calculating the average expression. |
| Page: 1 |
Top |
Somatic mutation of malignant transformation related genes |
| Annotation of somatic variants for genes involved in malignant transformation |
| Hugo Symbol | Variant Class | Variant Classification | dbSNP RS | HGVSc | HGVSp | HGVSp Short | SWISSPROT | BIOTYPE | SIFT | PolyPhen | Tumor Sample Barcode | Tissue | Histology | Sex | Age | Stage | Therapy Types | Drugs | Outcome |
| CLMN | SNV | Missense_Mutation | c.2603N>T | p.Arg868Met | p.R868M | Q96JQ2 | protein_coding | deleterious(0) | possibly_damaging(0.862) | TCGA-A8-A07W-01 | Breast | breast invasive carcinoma | Female | >=65 | III/IV | Hormone Therapy | exemestane | SD | |
| CLMN | SNV | Missense_Mutation | rs747974986 | c.1189N>A | p.Asp397Asn | p.D397N | Q96JQ2 | protein_coding | tolerated(0.28) | benign(0.001) | TCGA-AN-A046-01 | Breast | breast invasive carcinoma | Female | >=65 | I/II | Unknown | Unknown | SD |
| CLMN | SNV | Missense_Mutation | c.304N>G | p.Lys102Glu | p.K102E | Q96JQ2 | protein_coding | deleterious(0.01) | possibly_damaging(0.699) | TCGA-AO-A0J8-01 | Breast | breast invasive carcinoma | Female | <65 | I/II | Chemotherapy | cyclophosphamide | SD | |
| CLMN | SNV | Missense_Mutation | c.1762N>A | p.Glu588Lys | p.E588K | Q96JQ2 | protein_coding | tolerated_low_confidence(0.1) | benign(0.007) | TCGA-BH-A1F8-01 | Breast | breast invasive carcinoma | Female | >=65 | III/IV | Unknown | Unknown | PD | |
| CLMN | SNV | Missense_Mutation | rs754251662 | c.731N>A | p.Arg244Gln | p.R244Q | Q96JQ2 | protein_coding | deleterious(0.05) | probably_damaging(0.965) | TCGA-D8-A1XQ-01 | Breast | breast invasive carcinoma | Female | >=65 | I/II | Unknown | Unknown | SD |
| CLMN | insertion | Frame_Shift_Ins | novel | c.1799_1800insC | p.His601SerfsTer3 | p.H601Sfs*3 | Q96JQ2 | protein_coding | TCGA-A2-A0CP-01 | Breast | breast invasive carcinoma | Female | <65 | I/II | Chemotherapy | cytoxan | SD | ||
| CLMN | insertion | Frame_Shift_Ins | novel | c.1797_1798insGGTCCTGCCTGGGA | p.Asn600GlyfsTer11 | p.N600Gfs*11 | Q96JQ2 | protein_coding | TCGA-A2-A0CP-01 | Breast | breast invasive carcinoma | Female | <65 | I/II | Chemotherapy | cytoxan | SD | ||
| CLMN | insertion | Nonsense_Mutation | novel | c.499_500insGGTTGAGATCCTGGTGAATCATTTACCTTTCCAAGC | p.Ser167delinsTrpLeuArgSerTrpTerIleIleTyrLeuSerLysPro | p.S167delinsWLRSW*IIYLSKP | Q96JQ2 | protein_coding | TCGA-A8-A08S-01 | Breast | breast invasive carcinoma | Female | >=65 | I/II | Hormone Therapy | anastrozole | SD | ||
| CLMN | insertion | Frame_Shift_Ins | novel | c.920_921insGTTTGTCCATCTTAACTTGAGGCTCTGG | p.Ile307MetfsTer23 | p.I307Mfs*23 | Q96JQ2 | protein_coding | TCGA-AO-A128-01 | Breast | breast invasive carcinoma | Female | <65 | I/II | Chemotherapy | doxorubicin | SD | ||
| CLMN | insertion | Frame_Shift_Ins | novel | c.2081_2082insCAGCAAACTACCA | p.Val695SerfsTer43 | p.V695Sfs*43 | Q96JQ2 | protein_coding | TCGA-BH-A0AY-01 | Breast | breast invasive carcinoma | Female | <65 | I/II | Chemotherapy | SD |
| Page: 1 2 3 4 5 6 7 8 9 10 11 12 13 |
Top |
Related drugs of malignant transformation related genes |
| Identification of chemicals and drugs interact with genes involved in malignant transfromation |
| (DGIdb 4.0) |
| Entrez ID | Symbol | Category | Interaction Types | Drug Claim Name | Drug Name | PMIDs |
| Page: 1 |

Copyright 2023-Present -The University of Texas Health Science Center at Houston |