| Tissue | Expression Dynamics | Abbreviation |
| Esophagus | 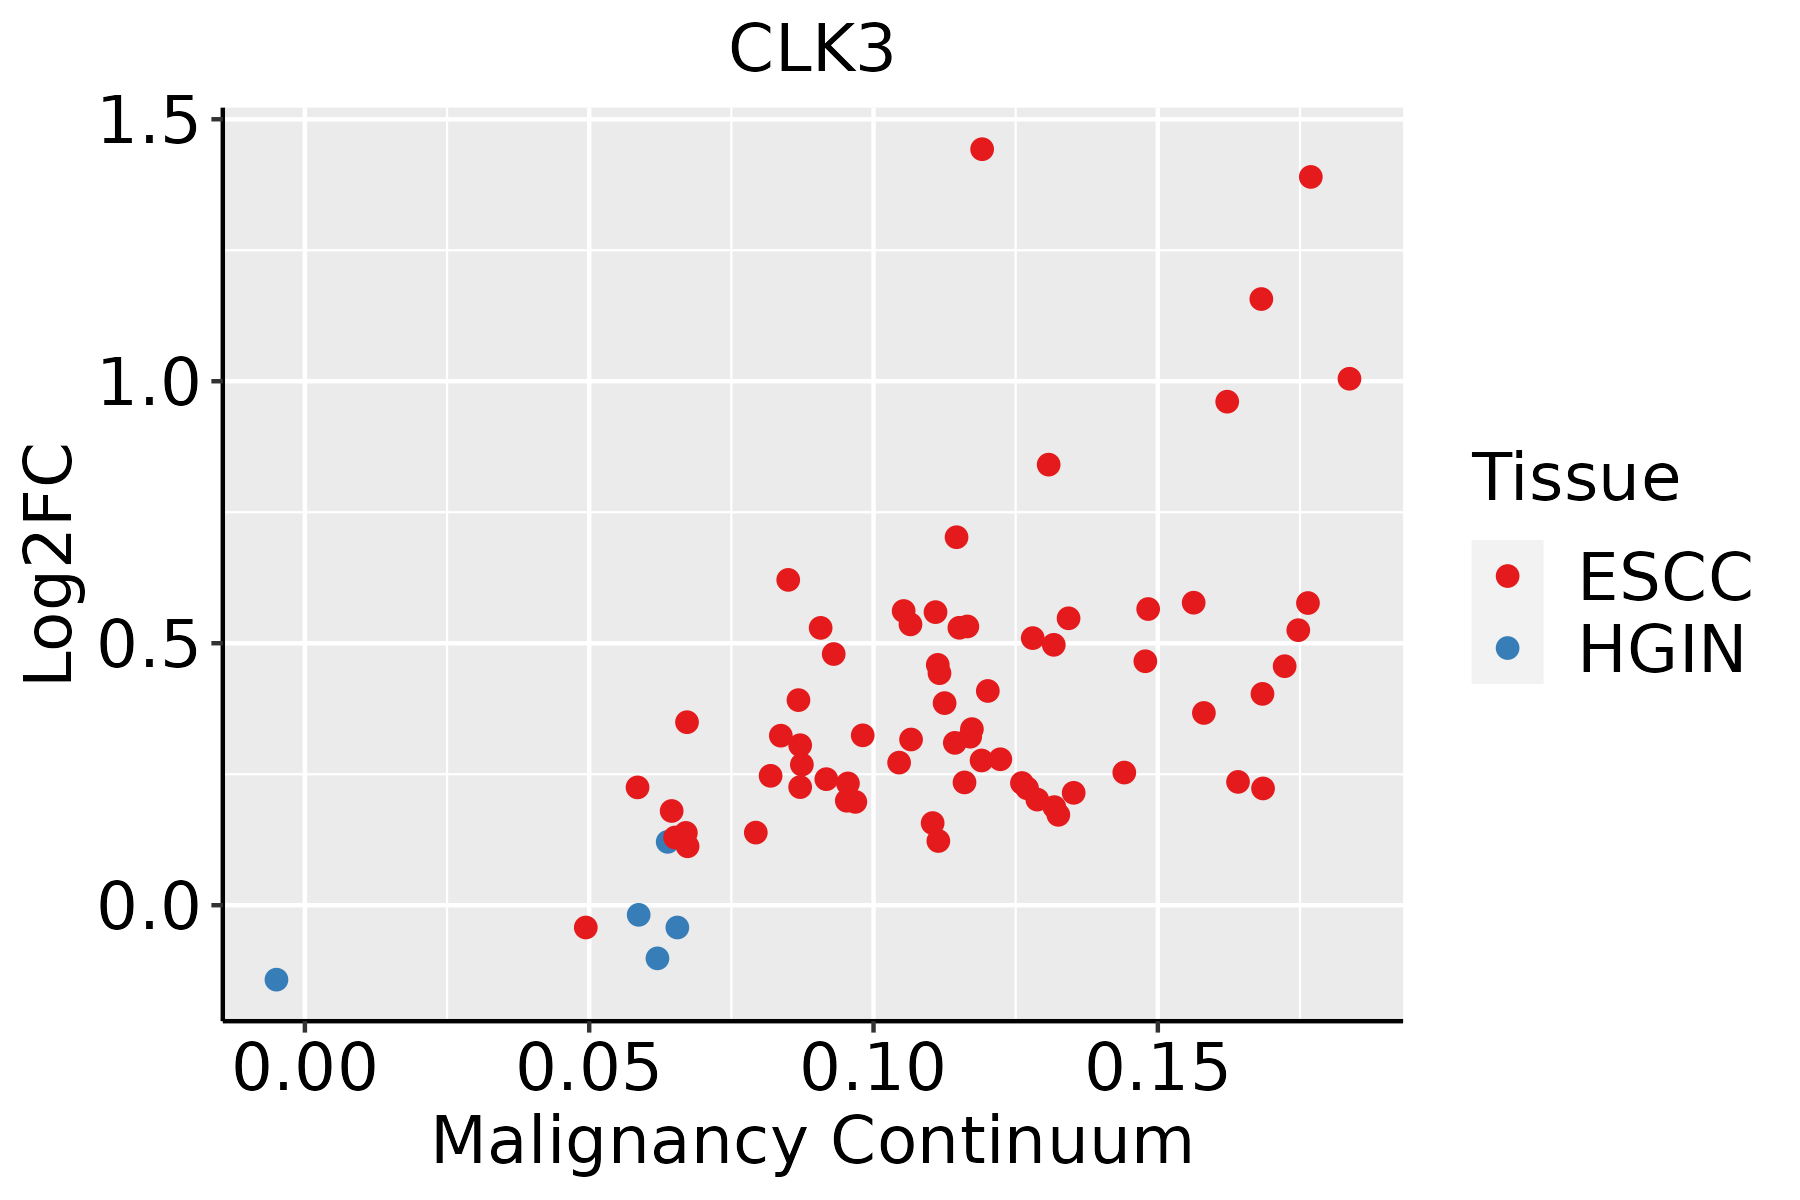 | ESCC: Esophageal squamous cell carcinoma |
| HGIN: High-grade intraepithelial neoplasias |
| LGIN: Low-grade intraepithelial neoplasias |
| Liver | 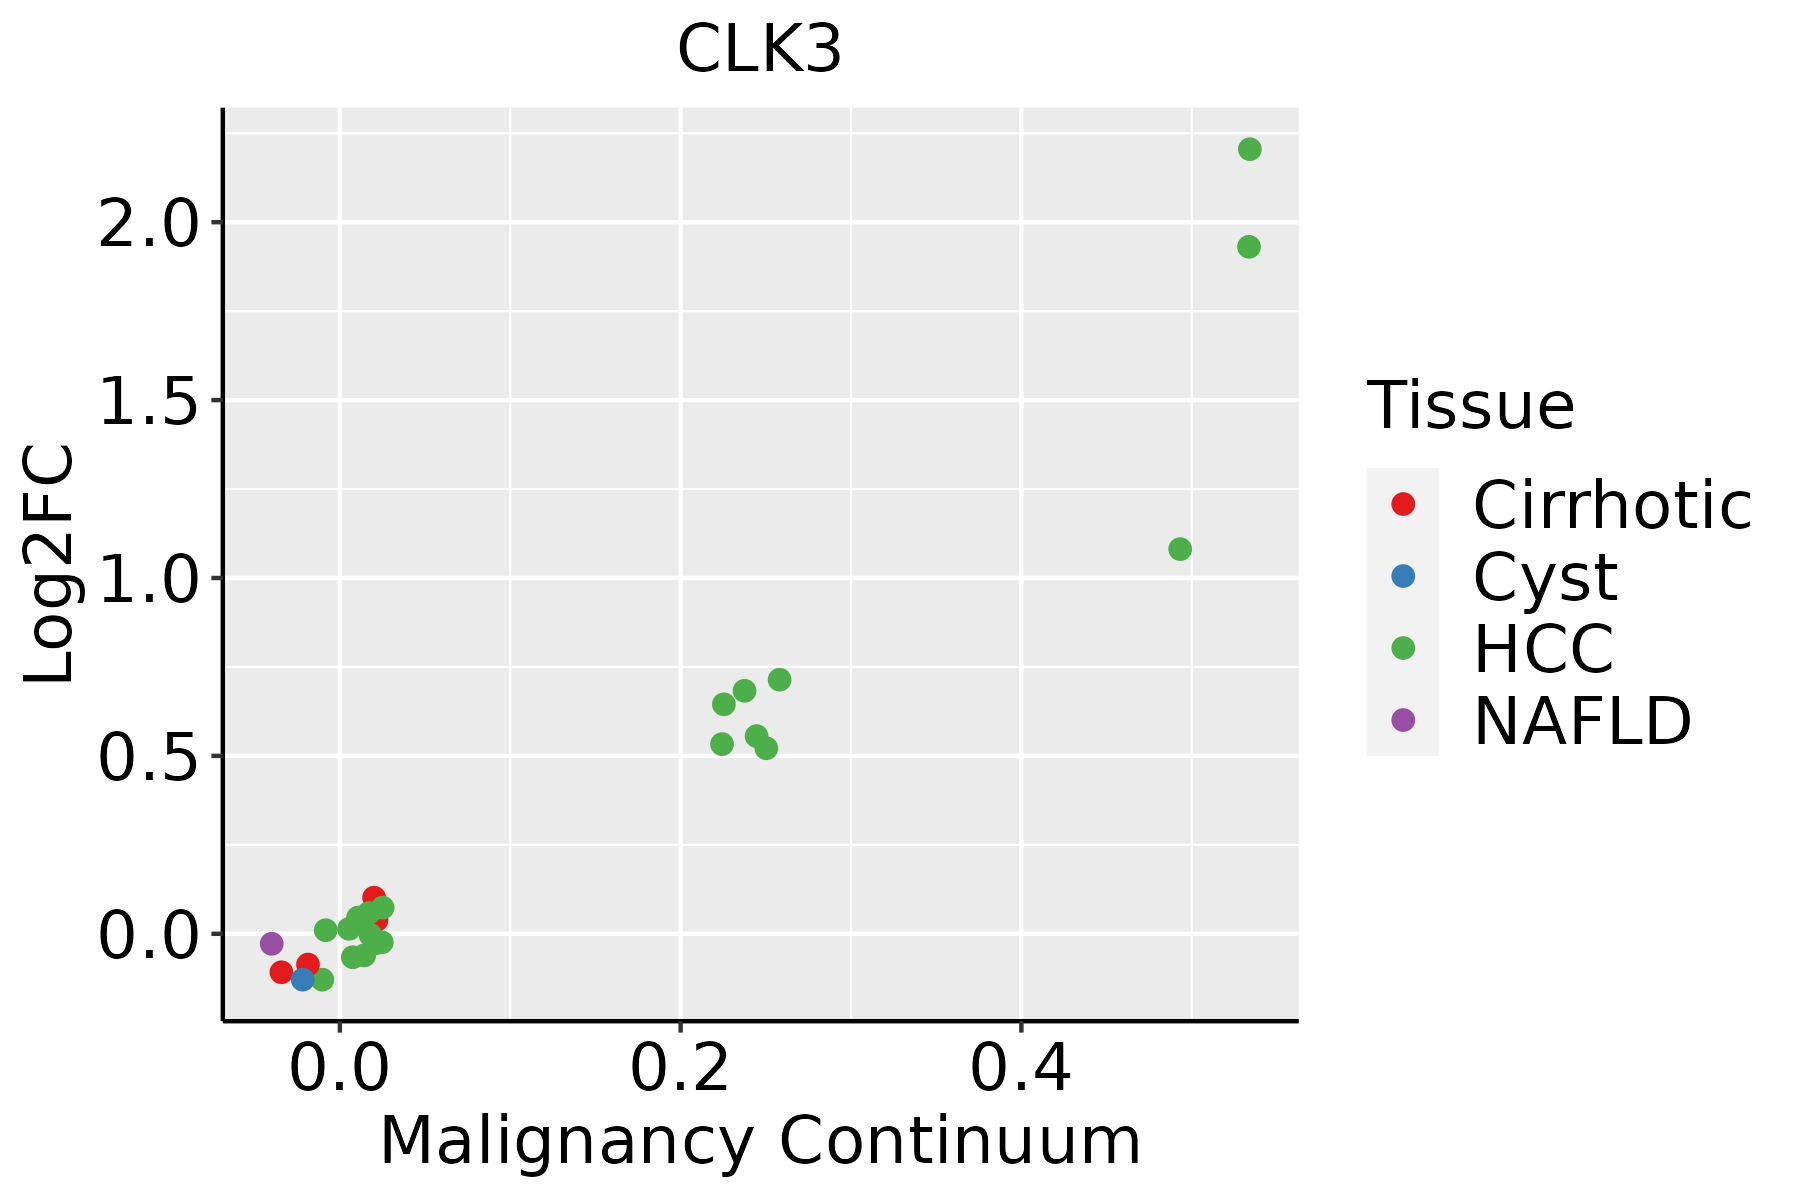 | HCC: Hepatocellular carcinoma |
| NAFLD: Non-alcoholic fatty liver disease |
| Oral Cavity | 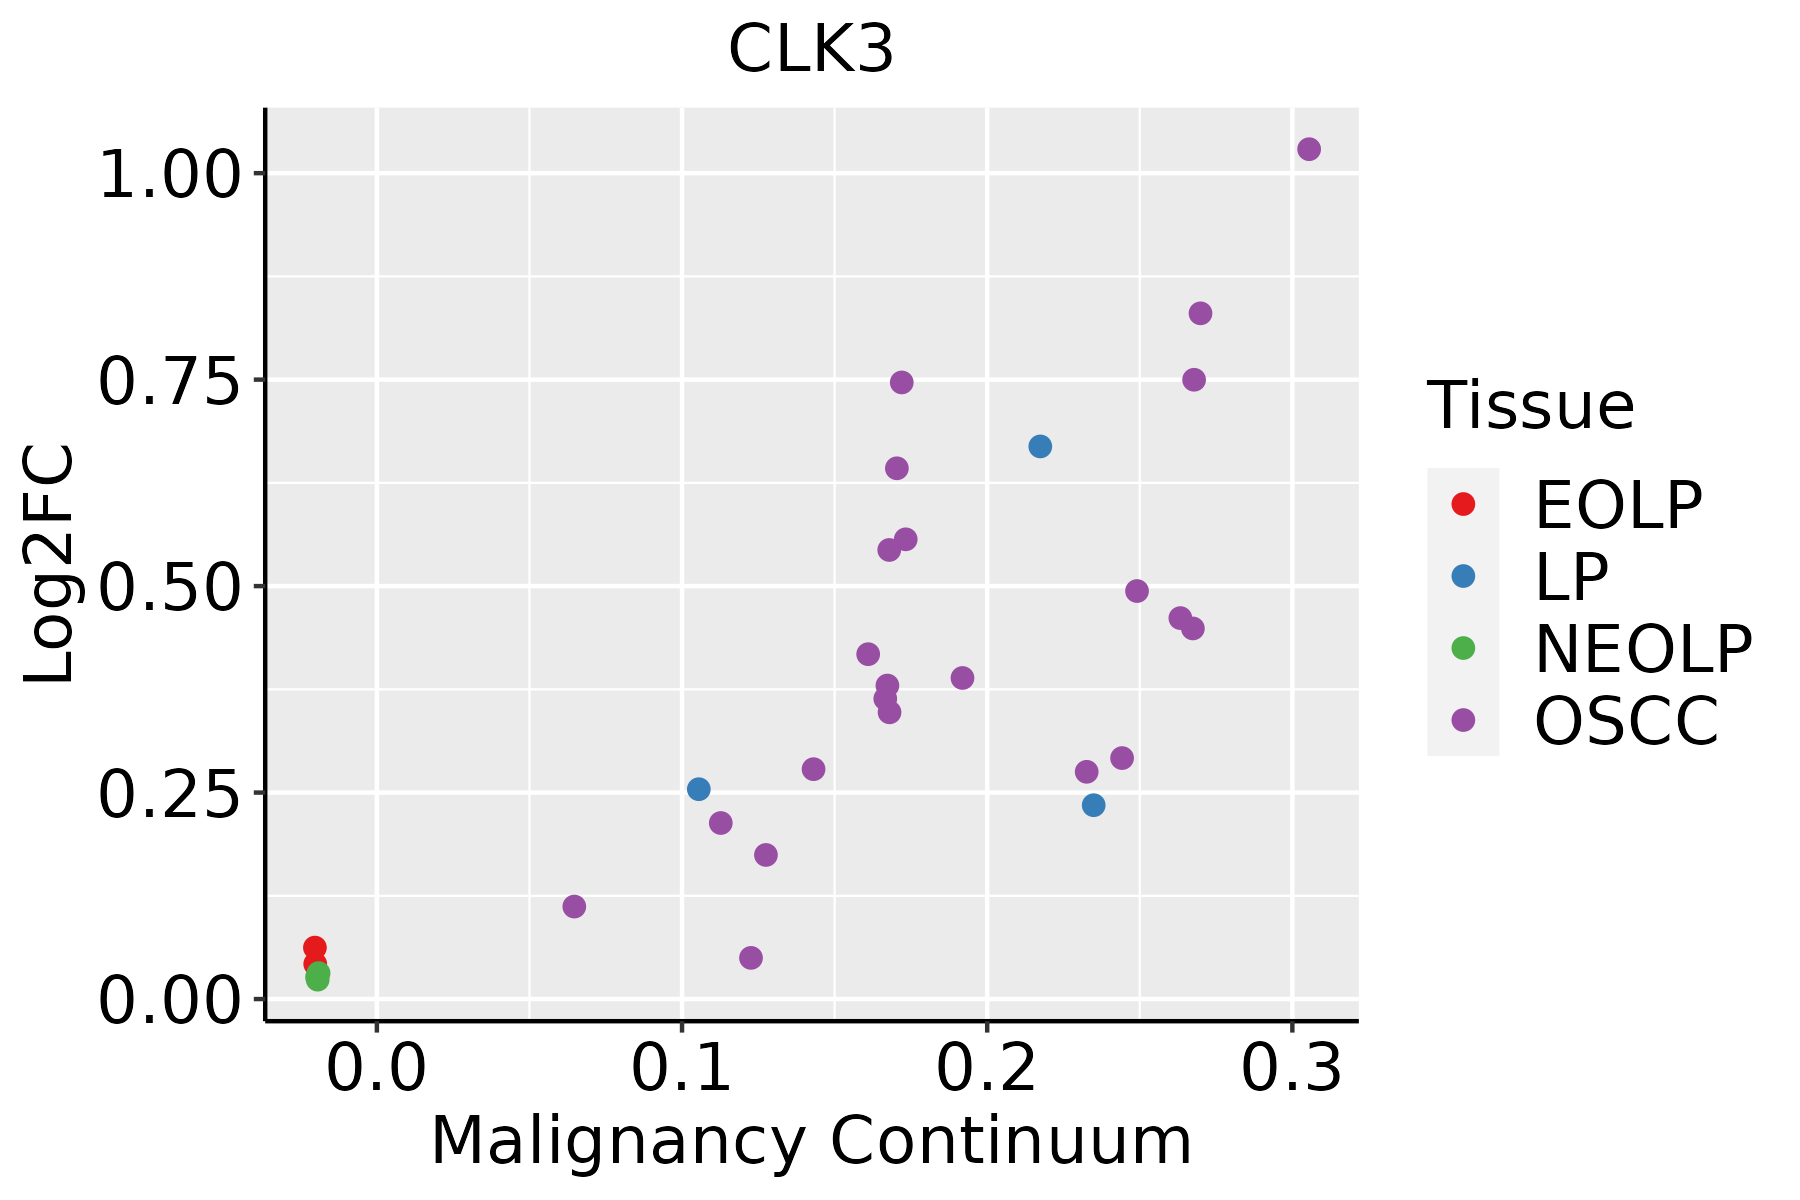 | EOLP: Erosive Oral lichen planus |
| LP: leukoplakia |
| NEOLP: Non-erosive oral lichen planus |
| OSCC: Oral squamous cell carcinoma |
| Skin | 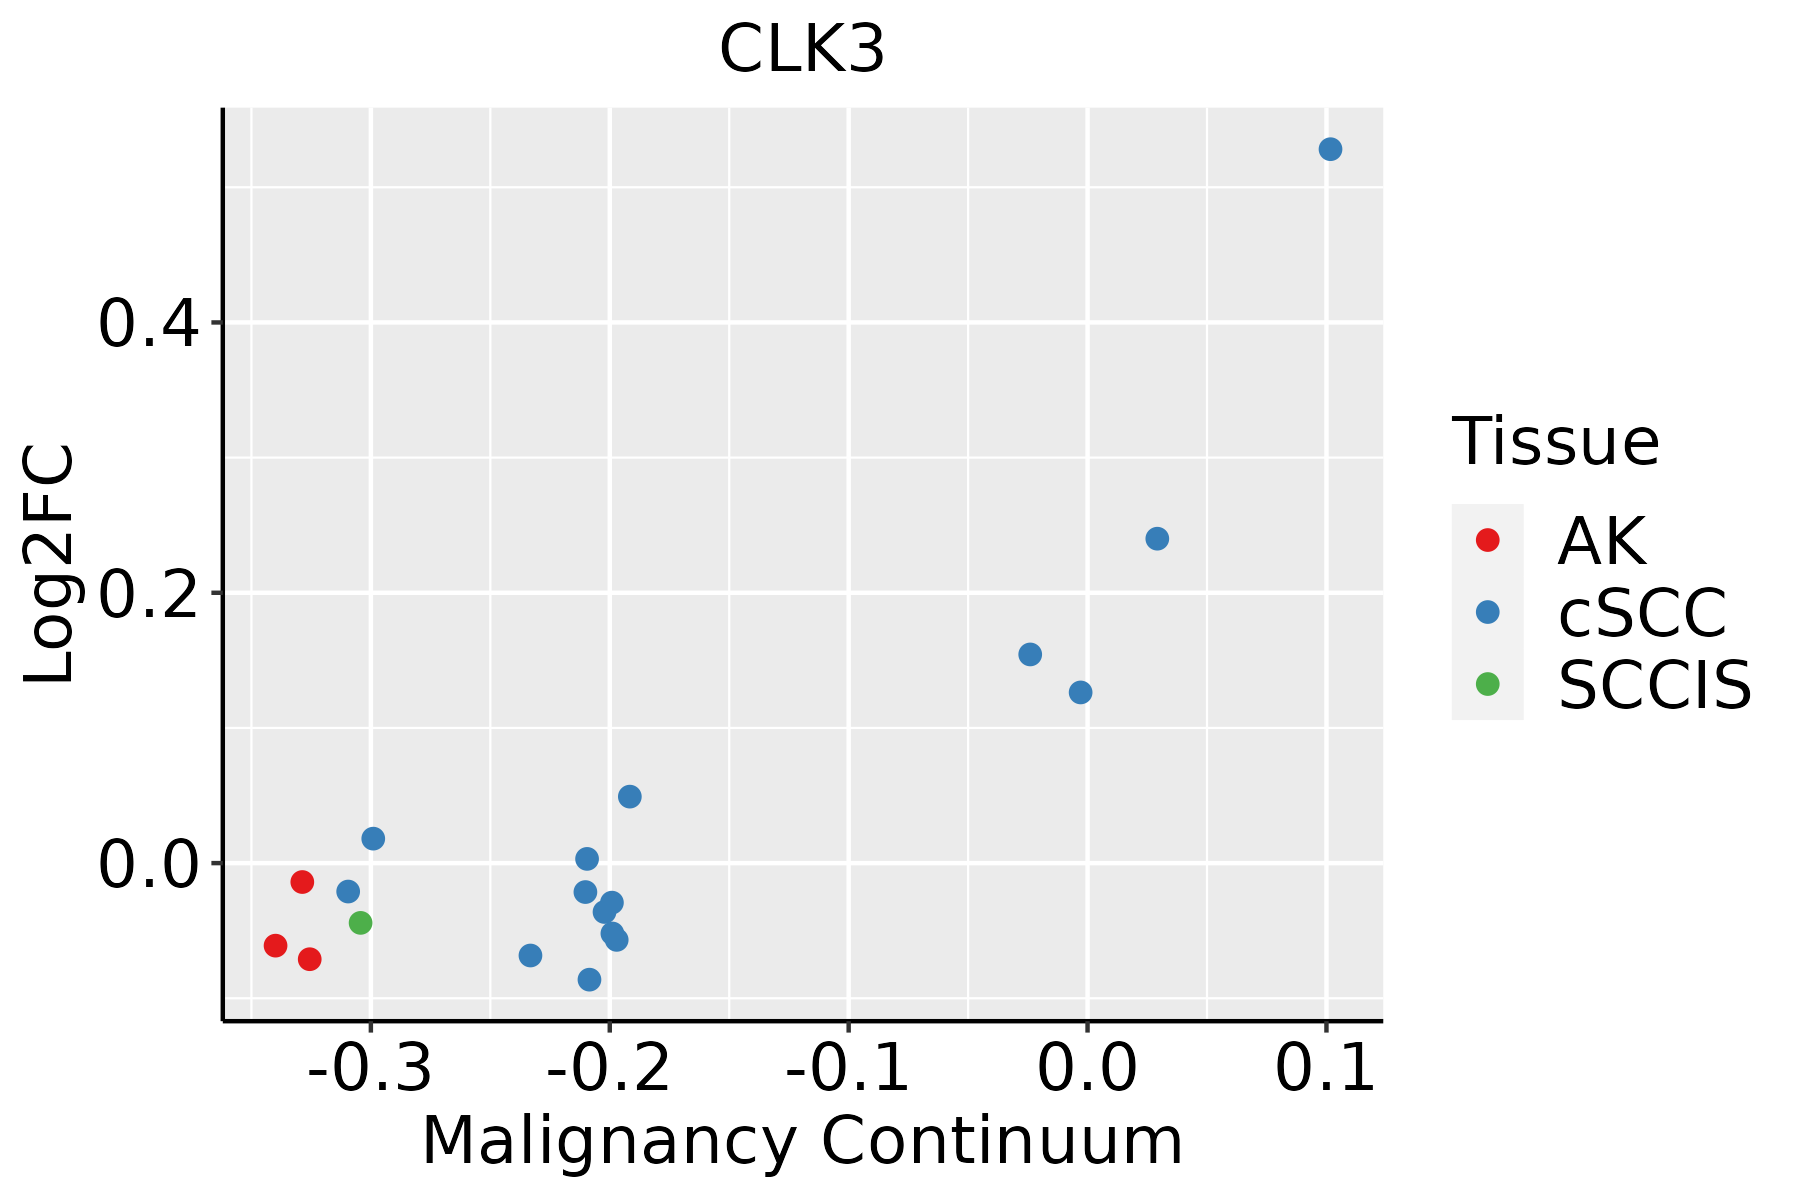 | AK: Actinic keratosis |
| cSCC: Cutaneous squamous cell carcinoma |
| SCCIS:squamous cell carcinoma in situ |
| GO ID | Tissue | Disease Stage | Description | Gene Ratio | Bg Ratio | pvalue | p.adjust | Count |
| GO:0008380111 | Esophagus | ESCC | RNA splicing | 336/8552 | 434/18723 | 1.74e-42 | 3.67e-39 | 336 |
| GO:0043484111 | Esophagus | ESCC | regulation of RNA splicing | 116/8552 | 148/18723 | 3.18e-16 | 2.38e-14 | 116 |
| GO:004677710 | Esophagus | ESCC | protein autophosphorylation | 138/8552 | 227/18723 | 2.98e-06 | 3.38e-05 | 138 |
| GO:00182124 | Esophagus | ESCC | peptidyl-tyrosine modification | 202/8552 | 378/18723 | 1.34e-03 | 6.39e-03 | 202 |
| GO:00181084 | Esophagus | ESCC | peptidyl-tyrosine phosphorylation | 200/8552 | 375/18723 | 1.60e-03 | 7.45e-03 | 200 |
| GO:000838012 | Liver | Cirrhotic | RNA splicing | 229/4634 | 434/18723 | 9.13e-37 | 2.86e-33 | 229 |
| GO:004348412 | Liver | Cirrhotic | regulation of RNA splicing | 85/4634 | 148/18723 | 2.03e-17 | 2.83e-15 | 85 |
| GO:000838022 | Liver | HCC | RNA splicing | 313/7958 | 434/18723 | 1.36e-36 | 1.73e-33 | 313 |
| GO:004348422 | Liver | HCC | regulation of RNA splicing | 113/7958 | 148/18723 | 4.32e-17 | 4.15e-15 | 113 |
| GO:00467775 | Liver | HCC | protein autophosphorylation | 123/7958 | 227/18723 | 2.40e-04 | 1.80e-03 | 123 |
| GO:000838020 | Oral cavity | OSCC | RNA splicing | 308/7305 | 434/18723 | 2.43e-42 | 7.70e-39 | 308 |
| GO:004348420 | Oral cavity | OSCC | regulation of RNA splicing | 108/7305 | 148/18723 | 4.25e-17 | 3.69e-15 | 108 |
| GO:00467779 | Oral cavity | OSCC | protein autophosphorylation | 123/7305 | 227/18723 | 2.31e-06 | 2.93e-05 | 123 |
| GO:00182123 | Oral cavity | OSCC | peptidyl-tyrosine modification | 180/7305 | 378/18723 | 3.63e-04 | 2.22e-03 | 180 |
| GO:00181083 | Oral cavity | OSCC | peptidyl-tyrosine phosphorylation | 177/7305 | 375/18723 | 6.86e-04 | 3.83e-03 | 177 |
| GO:0008380110 | Oral cavity | LP | RNA splicing | 237/4623 | 434/18723 | 1.82e-41 | 3.79e-38 | 237 |
| GO:0043484110 | Oral cavity | LP | regulation of RNA splicing | 81/4623 | 148/18723 | 4.34e-15 | 5.79e-13 | 81 |
| GO:0008380112 | Skin | cSCC | RNA splicing | 263/4864 | 434/18723 | 2.45e-53 | 5.13e-50 | 263 |
| GO:004348429 | Skin | cSCC | regulation of RNA splicing | 97/4864 | 148/18723 | 4.66e-24 | 1.08e-21 | 97 |
| GO:004677715 | Skin | cSCC | protein autophosphorylation | 84/4864 | 227/18723 | 1.53e-04 | 1.35e-03 | 84 |
| Hugo Symbol | Variant Class | Variant Classification | dbSNP RS | HGVSc | HGVSp | HGVSp Short | SWISSPROT | BIOTYPE | SIFT | PolyPhen | Tumor Sample Barcode | Tissue | Histology | Sex | Age | Stage | Therapy Types | Drugs | Outcome |
| CLK3 | SNV | Missense_Mutation | | c.516G>T | p.Arg172Ser | p.R172S | P49761 | protein_coding | deleterious(0.05) | probably_damaging(0.966) | TCGA-AC-A23H-01 | Breast | breast invasive carcinoma | Female | >=65 | I/II | Unknown | Unknown | PD |
| CLK3 | SNV | Missense_Mutation | novel | c.840N>G | p.Ser280Arg | p.S280R | P49761 | protein_coding | tolerated(0.65) | benign(0.074) | TCGA-AO-A03P-01 | Breast | breast invasive carcinoma | Female | <65 | I/II | Hormone Therapy | letrozole | PD |
| CLK3 | SNV | Missense_Mutation | novel | c.1270N>A | p.Glu424Lys | p.E424K | P49761 | protein_coding | tolerated(0.06) | benign(0.04) | TCGA-BH-A0B6-01 | Breast | breast invasive carcinoma | Female | <65 | I/II | Unknown | Unknown | SD |
| CLK3 | SNV | Missense_Mutation | novel | c.535G>A | p.Glu179Lys | p.E179K | P49761 | protein_coding | deleterious(0.02) | benign(0.081) | TCGA-BH-A0BM-01 | Breast | breast invasive carcinoma | Female | <65 | I/II | Chemotherapy | adriamycin | SD |
| CLK3 | SNV | Missense_Mutation | novel | c.464N>G | p.Tyr155Cys | p.Y155C | P49761 | protein_coding | deleterious_low_confidence(0.02) | probably_damaging(0.994) | TCGA-BH-A18G-01 | Breast | breast invasive carcinoma | Female | >=65 | I/II | Unknown | Unknown | SD |
| CLK3 | SNV | Missense_Mutation | novel | c.1810N>C | p.Asp604His | p.D604H | P49761 | protein_coding | deleterious(0) | probably_damaging(0.997) | TCGA-BH-A2L8-01 | Breast | breast invasive carcinoma | Female | <65 | I/II | Chemotherapy | cytoxan | CR |
| CLK3 | SNV | Missense_Mutation | | c.913G>A | p.Glu305Lys | p.E305K | P49761 | protein_coding | tolerated(0.2) | benign(0.303) | TCGA-D8-A13Y-01 | Breast | breast invasive carcinoma | Female | <65 | I/II | Chemotherapy | doxorubicin | SD |
| CLK3 | insertion | Frame_Shift_Ins | novel | c.1335_1336insGGGATCCTTGAGCTGAAAAGTG | p.Thr446GlyfsTer12 | p.T446Gfs*12 | P49761 | protein_coding | | | TCGA-BH-A0GZ-01 | Breast | breast invasive carcinoma | Female | <65 | I/II | Hormone Therapy | arimidex | SD |
| CLK3 | deletion | Frame_Shift_Del | novel | c.1817delN | p.Gln607SerfsTer17 | p.Q607Sfs*17 | P49761 | protein_coding | | | TCGA-D8-A27V-01 | Breast | breast invasive carcinoma | Female | <65 | I/II | Hormone Therapy | tamoxiphen | SD |
| CLK3 | SNV | Missense_Mutation | novel | c.1312N>A | p.Leu438Met | p.L438M | P49761 | protein_coding | deleterious(0) | probably_damaging(1) | TCGA-2W-A8YY-01 | Cervix | cervical & endocervical cancer | Female | <65 | I/II | Chemotherapy | cisplatin | CR |
| Entrez ID | Symbol | Category | Interaction Types | Drug Claim Name | Drug Name | PMIDs |
| 1198 | CLK3 | KINASE, SERINE THREONINE KINASE, ENZYME, DRUGGABLE GENOME, TYROSINE KINASE | | HARMINE | HARMINE | 22998443 |
| 1198 | CLK3 | KINASE, SERINE THREONINE KINASE, ENZYME, DRUGGABLE GENOME, TYROSINE KINASE | | LEUCETTAMINE B | LEUCETTAMINE B | 22998443 |
| 1198 | CLK3 | KINASE, SERINE THREONINE KINASE, ENZYME, DRUGGABLE GENOME, TYROSINE KINASE | inhibitor | 249565735 | | |


