
|
|||||
|
 | |
| |
| |
| |
| |
| |
|
Gene: CLIP4 |
Gene summary for CLIP4 |
| Gene information | Species | Human | Gene symbol | CLIP4 | Gene ID | 79745 |
| Gene name | CAP-Gly domain containing linker protein family member 4 | |
| Gene Alias | RSNL2 | |
| Cytomap | 2p23.2 | |
| Gene Type | protein-coding | GO ID | GO:0000226 | UniProtAcc | B7Z936 |
Top |
Malignant transformation analysis |
| Identification of the aberrant gene expression in precancerous and cancerous lesions by comparing the gene expression of stem-like cells in diseased tissues with normal stem cells |
| Entrez ID | Symbol | Replicates | Species | Organ | Tissue | Adj P-value | Log2FC | Malignancy |
| 79745 | CLIP4 | LZE2T | Human | Esophagus | ESCC | 3.37e-02 | 8.62e-01 | 0.082 |
| 79745 | CLIP4 | LZE4T | Human | Esophagus | ESCC | 1.28e-13 | 6.19e-01 | 0.0811 |
| 79745 | CLIP4 | LZE20T | Human | Esophagus | ESCC | 3.66e-06 | 3.75e-02 | 0.0662 |
| 79745 | CLIP4 | LZE24T | Human | Esophagus | ESCC | 9.77e-09 | 5.26e-01 | 0.0596 |
| 79745 | CLIP4 | P1T-E | Human | Esophagus | ESCC | 2.68e-03 | 4.65e-02 | 0.0875 |
| 79745 | CLIP4 | P2T-E | Human | Esophagus | ESCC | 1.32e-07 | 6.32e-02 | 0.1177 |
| 79745 | CLIP4 | P4T-E | Human | Esophagus | ESCC | 6.25e-12 | 1.41e-01 | 0.1323 |
| 79745 | CLIP4 | P5T-E | Human | Esophagus | ESCC | 2.04e-14 | 3.08e-01 | 0.1327 |
| 79745 | CLIP4 | P8T-E | Human | Esophagus | ESCC | 6.56e-07 | 1.17e-01 | 0.0889 |
| 79745 | CLIP4 | P9T-E | Human | Esophagus | ESCC | 1.91e-21 | 2.92e-01 | 0.1131 |
| 79745 | CLIP4 | P10T-E | Human | Esophagus | ESCC | 7.56e-12 | 2.04e-01 | 0.116 |
| 79745 | CLIP4 | P11T-E | Human | Esophagus | ESCC | 1.67e-03 | 1.56e-01 | 0.1426 |
| 79745 | CLIP4 | P12T-E | Human | Esophagus | ESCC | 1.37e-15 | 4.37e-01 | 0.1122 |
| 79745 | CLIP4 | P15T-E | Human | Esophagus | ESCC | 1.07e-29 | 7.38e-01 | 0.1149 |
| 79745 | CLIP4 | P16T-E | Human | Esophagus | ESCC | 2.06e-07 | -2.10e-02 | 0.1153 |
| 79745 | CLIP4 | P17T-E | Human | Esophagus | ESCC | 4.48e-02 | 1.00e-01 | 0.1278 |
| 79745 | CLIP4 | P20T-E | Human | Esophagus | ESCC | 4.48e-09 | 4.59e-02 | 0.1124 |
| 79745 | CLIP4 | P21T-E | Human | Esophagus | ESCC | 3.12e-08 | 6.90e-02 | 0.1617 |
| 79745 | CLIP4 | P22T-E | Human | Esophagus | ESCC | 4.49e-37 | 8.06e-01 | 0.1236 |
| 79745 | CLIP4 | P23T-E | Human | Esophagus | ESCC | 4.48e-05 | 1.82e-02 | 0.108 |
| Page: 1 2 3 4 5 |
| Tissue | Expression Dynamics | Abbreviation |
| Esophagus | 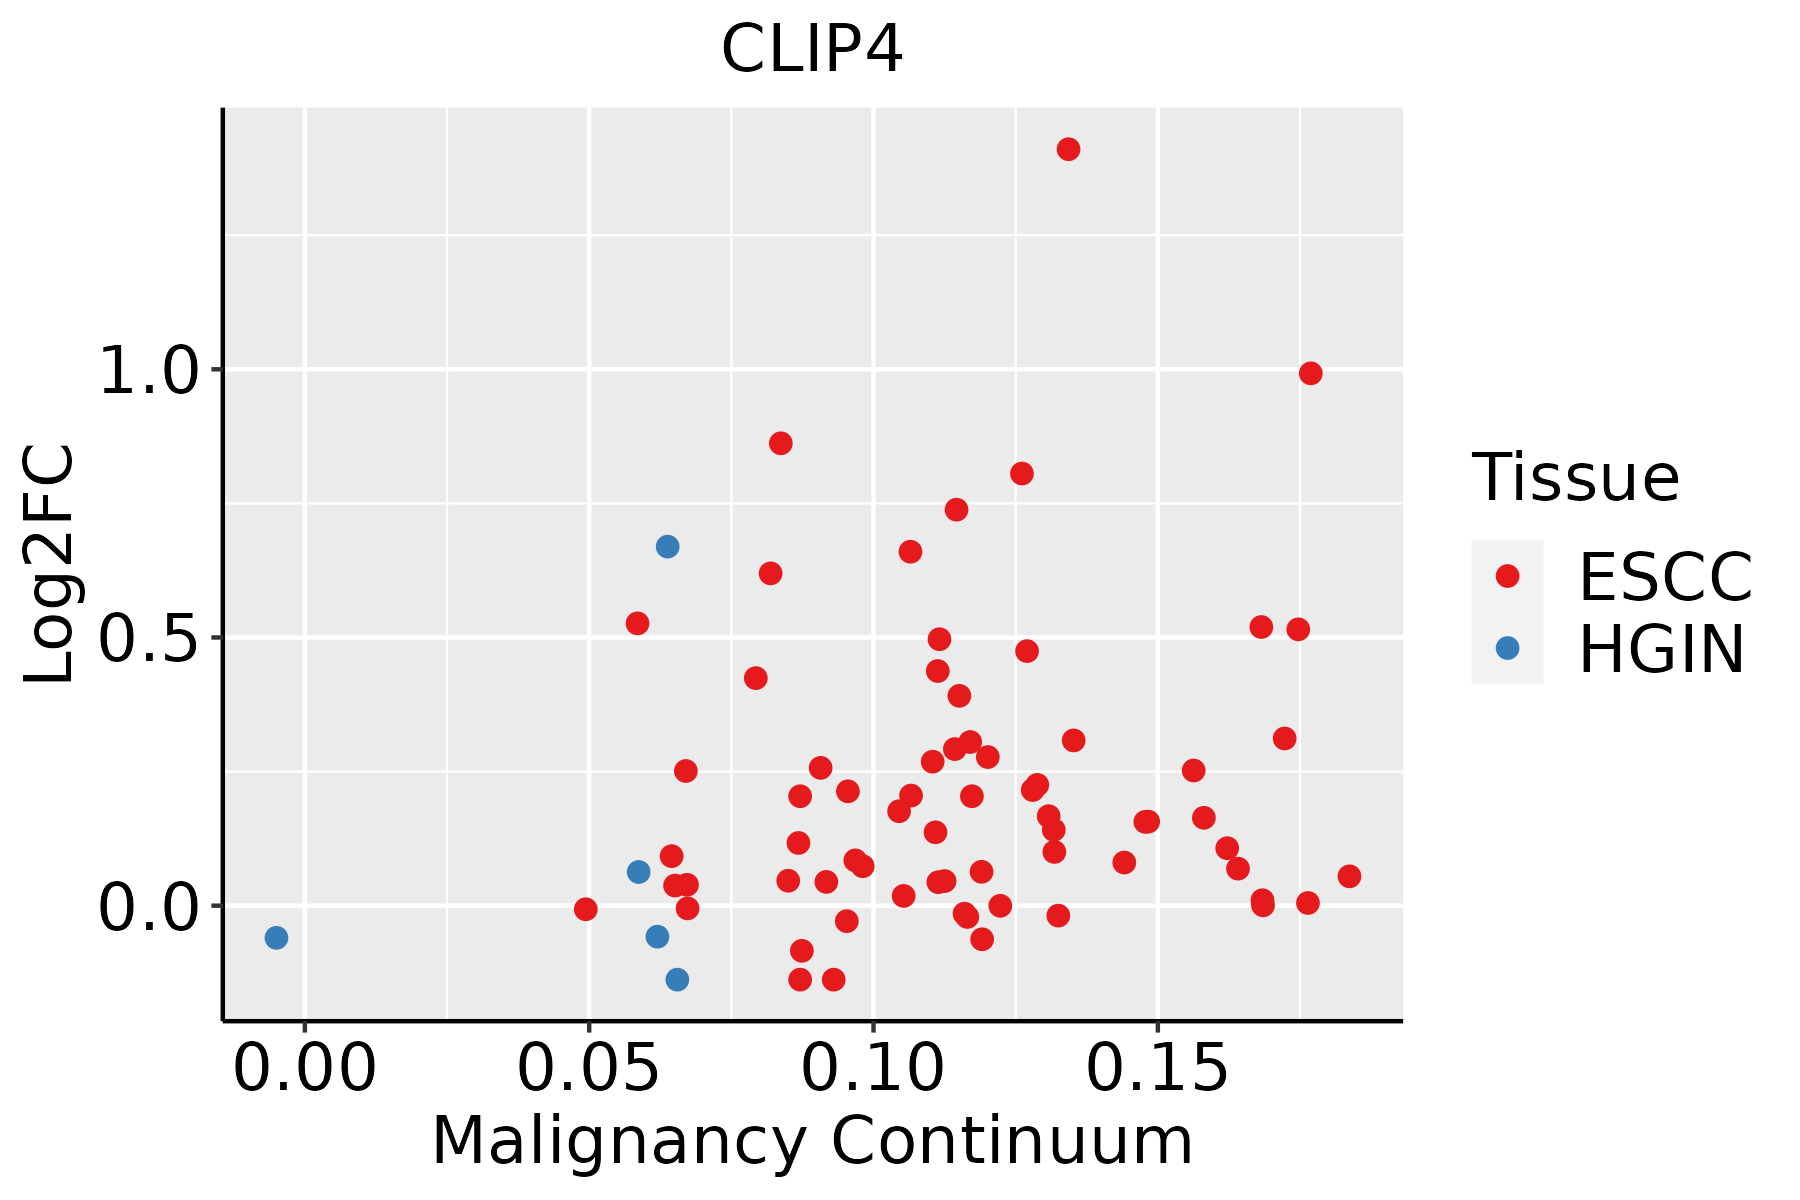 | ESCC: Esophageal squamous cell carcinoma |
| HGIN: High-grade intraepithelial neoplasias | ||
| LGIN: Low-grade intraepithelial neoplasias | ||
| Liver |  | HCC: Hepatocellular carcinoma |
| NAFLD: Non-alcoholic fatty liver disease | ||
| Lung |  | AAH: Atypical adenomatous hyperplasia |
| AIS: Adenocarcinoma in situ | ||
| IAC: Invasive lung adenocarcinoma | ||
| MIA: Minimally invasive adenocarcinoma | ||
| Oral Cavity | 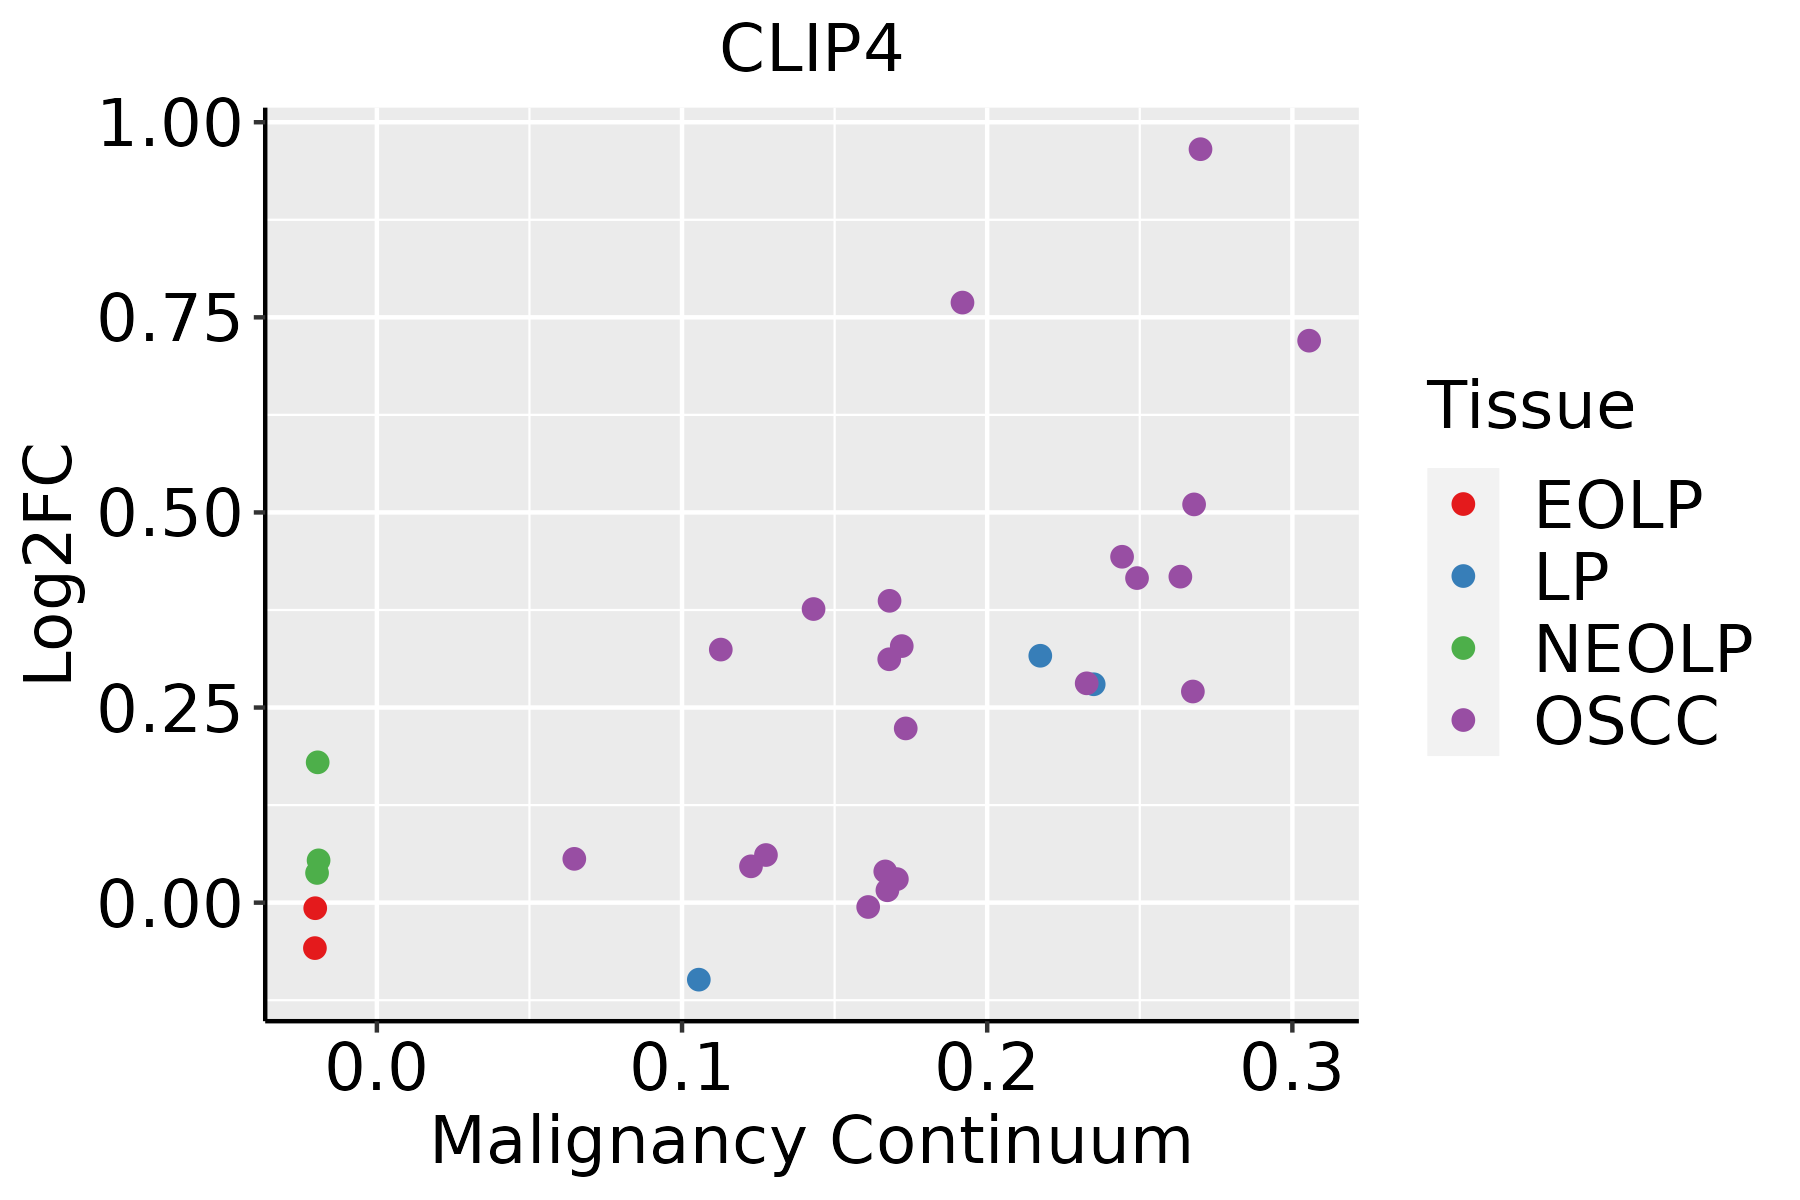 | EOLP: Erosive Oral lichen planus |
| LP: leukoplakia | ||
| NEOLP: Non-erosive oral lichen planus | ||
| OSCC: Oral squamous cell carcinoma | ||
| Thyroid | 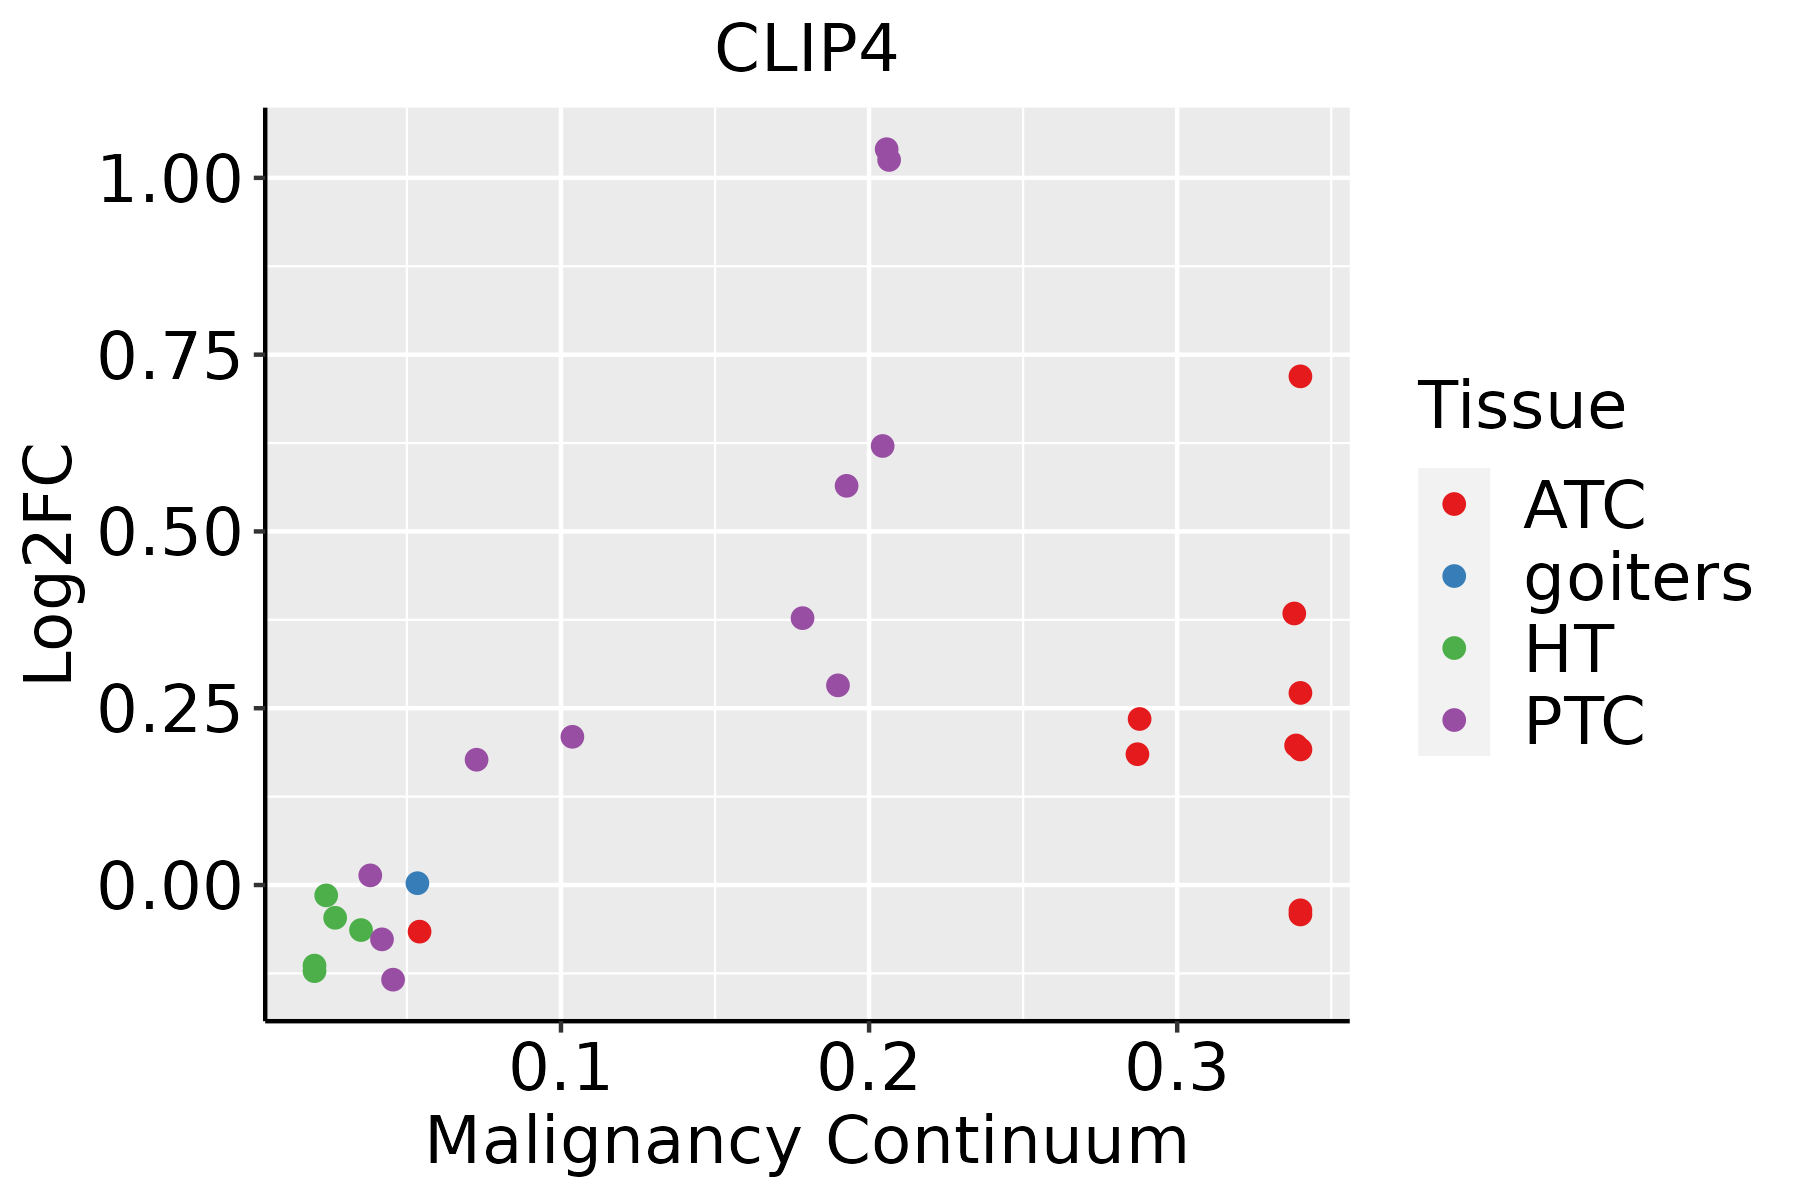 | ATC: Anaplastic thyroid cancer |
| HT: Hashimoto's thyroiditis | ||
| PTC: Papillary thyroid cancer |
| ∗log2FC in expression of this searched gene in stem-like cells from each diseased tissue sample relative to stem-like cells in normal samples in each tissue plotted against the malignancy continuum. Samples are colored based on if they are from different disease stage. |
Top |
Malignant transformation related pathway analysis |
| Find out the enriched GO biological processes and KEGG pathways involved in transition from healthy to precancer to cancer |
| Tissue | Disease Stage | Enriched GO biological Processes |
| Colorectum | AD |  |
| Colorectum | SER |  |
| Colorectum | MSS |  |
| Colorectum | MSI-H |  |
| Colorectum | FAP |  |
| ∗Top 15 enriched GO BP terms are showed in the bar plot of each disease state in each tissue. Each row represents a significant GO biological process which is colored according to the -log10(p.adjust). |
| Page: 1 2 3 4 5 6 7 8 9 |
| GO ID | Tissue | Disease Stage | Description | Gene Ratio | Bg Ratio | pvalue | p.adjust | Count |
| GO:00311227 | Esophagus | ESCC | cytoplasmic microtubule organization | 38/8552 | 56/18723 | 6.60e-04 | 3.50e-03 | 38 |
| GO:00311222 | Liver | HCC | cytoplasmic microtubule organization | 35/7958 | 56/18723 | 2.00e-03 | 1.01e-02 | 35 |
| GO:00311223 | Lung | IAC | cytoplasmic microtubule organization | 14/2061 | 56/18723 | 2.45e-03 | 2.33e-02 | 14 |
| GO:003112211 | Lung | AIS | cytoplasmic microtubule organization | 14/1849 | 56/18723 | 8.61e-04 | 1.17e-02 | 14 |
| GO:00311226 | Oral cavity | OSCC | cytoplasmic microtubule organization | 39/7305 | 56/18723 | 3.29e-06 | 3.93e-05 | 39 |
| GO:00311229 | Thyroid | PTC | cytoplasmic microtubule organization | 34/5968 | 56/18723 | 8.20e-06 | 9.42e-05 | 34 |
| GO:003112215 | Thyroid | ATC | cytoplasmic microtubule organization | 34/6293 | 56/18723 | 2.92e-05 | 2.45e-04 | 34 |
| Page: 1 |
| Pathway ID | Tissue | Disease Stage | Description | Gene Ratio | Bg Ratio | pvalue | p.adjust | qvalue | Count |
| Page: 1 |
Top |
Cell-cell communication analysis |
| Identification of potential cell-cell interactions between two cell types and their ligand-receptor pairs for different disease states |
| Ligand | Receptor | LRpair | Pathway | Tissue | Disease Stage |
| Page: 1 |
Top |
Single-cell gene regulatory network inference analysis |
| Find out the significant the regulons (TFs) and the target genes of each regulon across cell types for different disease states |
| TF | Cell Type | Tissue | Disease Stage | Target Gene | RSS | Regulon Activity |
| ∗The dot plots of a searched regulon are shown for all cell subpopulations in each disease state of each tissue based on the regulon specific score inferred using pySCENIC and by calculating the average expression. |
| Page: 1 |
Top |
Somatic mutation of malignant transformation related genes |
| Annotation of somatic variants for genes involved in malignant transformation |
| Hugo Symbol | Variant Class | Variant Classification | dbSNP RS | HGVSc | HGVSp | HGVSp Short | SWISSPROT | BIOTYPE | SIFT | PolyPhen | Tumor Sample Barcode | Tissue | Histology | Sex | Age | Stage | Therapy Types | Drugs | Outcome |
| CLIP4 | SNV | Missense_Mutation | c.1859N>A | p.Ser620Asn | p.S620N | Q8N3C7 | protein_coding | tolerated(0.17) | benign(0.01) | TCGA-A8-A09Z-01 | Breast | breast invasive carcinoma | Female | >=65 | I/II | Unknown | Unknown | SD | |
| CLIP4 | insertion | Frame_Shift_Ins | novel | c.971dupA | p.Asn324LysfsTer2 | p.N324Kfs*2 | Q8N3C7 | protein_coding | TCGA-OL-A5RZ-01 | Breast | breast invasive carcinoma | Female | <65 | I/II | Chemotherapy | doxorubicin | CR | ||
| CLIP4 | SNV | Missense_Mutation | novel | c.1057A>C | p.Lys353Gln | p.K353Q | Q8N3C7 | protein_coding | tolerated(0.57) | benign(0.265) | TCGA-2W-A8YY-01 | Cervix | cervical & endocervical cancer | Female | <65 | I/II | Chemotherapy | cisplatin | CR |
| CLIP4 | SNV | Missense_Mutation | novel | c.1826G>A | p.Ser609Asn | p.S609N | Q8N3C7 | protein_coding | deleterious(0.03) | probably_damaging(0.986) | TCGA-2W-A8YY-01 | Cervix | cervical & endocervical cancer | Female | <65 | I/II | Chemotherapy | cisplatin | CR |
| CLIP4 | SNV | Missense_Mutation | novel | c.2069T>C | p.Val690Ala | p.V690A | Q8N3C7 | protein_coding | deleterious(0) | probably_damaging(0.994) | TCGA-2W-A8YY-01 | Cervix | cervical & endocervical cancer | Female | <65 | I/II | Chemotherapy | cisplatin | CR |
| CLIP4 | SNV | Missense_Mutation | novel | c.22N>T | p.Asp8Tyr | p.D8Y | Q8N3C7 | protein_coding | deleterious(0) | benign(0.44) | TCGA-A6-6653-01 | Colorectum | colon adenocarcinoma | Male | >=65 | I/II | Unknown | Unknown | SD |
| CLIP4 | SNV | Missense_Mutation | c.922G>A | p.Ala308Thr | p.A308T | Q8N3C7 | protein_coding | deleterious(0) | probably_damaging(0.971) | TCGA-AA-3510-01 | Colorectum | colon adenocarcinoma | Male | >=65 | I/II | Unknown | Unknown | SD | |
| CLIP4 | SNV | Missense_Mutation | c.307G>T | p.Asp103Tyr | p.D103Y | Q8N3C7 | protein_coding | deleterious(0) | possibly_damaging(0.7) | TCGA-AA-3977-01 | Colorectum | colon adenocarcinoma | Male | >=65 | I/II | Unknown | Unknown | SD | |
| CLIP4 | SNV | Missense_Mutation | c.1353G>T | p.Lys451Asn | p.K451N | Q8N3C7 | protein_coding | tolerated(0.14) | benign(0.052) | TCGA-AA-3977-01 | Colorectum | colon adenocarcinoma | Male | >=65 | I/II | Unknown | Unknown | SD | |
| CLIP4 | SNV | Missense_Mutation | novel | c.296T>C | p.Val99Ala | p.V99A | Q8N3C7 | protein_coding | deleterious(0.02) | probably_damaging(0.994) | TCGA-AA-3984-01 | Colorectum | colon adenocarcinoma | Female | <65 | I/II | Unknown | Unknown | SD |
| Page: 1 2 3 4 5 6 7 8 9 |
Top |
Related drugs of malignant transformation related genes |
| Identification of chemicals and drugs interact with genes involved in malignant transfromation |
| (DGIdb 4.0) |
| Entrez ID | Symbol | Category | Interaction Types | Drug Claim Name | Drug Name | PMIDs |
| Page: 1 |

Copyright 2023-Present -The University of Texas Health Science Center at Houston |