
|
|||||
|
 | |
| |
| |
| |
| |
| |
|
Gene: CLIP2 |
Gene summary for CLIP2 |
| Gene information | Species | Human | Gene symbol | CLIP2 | Gene ID | 7461 |
| Gene name | CAP-Gly domain containing linker protein 2 | |
| Gene Alias | CLIP | |
| Cytomap | 7q11.23 | |
| Gene Type | protein-coding | GO ID | GO:0000226 | UniProtAcc | A0A140VJG6 |
Top |
Malignant transformation analysis |
| Identification of the aberrant gene expression in precancerous and cancerous lesions by comparing the gene expression of stem-like cells in diseased tissues with normal stem cells |
| Entrez ID | Symbol | Replicates | Species | Organ | Tissue | Adj P-value | Log2FC | Malignancy |
| 7461 | CLIP2 | HTA11_2487_2000001011 | Human | Colorectum | SER | 3.42e-02 | 5.29e-01 | -0.1808 |
| 7461 | CLIP2 | HTA11_347_2000001011 | Human | Colorectum | AD | 3.82e-08 | 5.67e-01 | -0.1954 |
| 7461 | CLIP2 | HTA11_411_2000001011 | Human | Colorectum | SER | 4.92e-02 | 7.78e-01 | -0.2602 |
| 7461 | CLIP2 | HTA11_2112_2000001011 | Human | Colorectum | SER | 2.26e-07 | 1.09e+00 | -0.2196 |
| 7461 | CLIP2 | HTA11_3361_2000001011 | Human | Colorectum | AD | 1.58e-04 | 6.28e-01 | -0.1207 |
| 7461 | CLIP2 | HTA11_83_2000001011 | Human | Colorectum | SER | 4.16e-07 | 7.59e-01 | -0.1526 |
| 7461 | CLIP2 | HTA11_696_2000001011 | Human | Colorectum | AD | 5.95e-17 | 8.66e-01 | -0.1464 |
| 7461 | CLIP2 | HTA11_866_2000001011 | Human | Colorectum | AD | 2.77e-02 | 4.35e-01 | -0.1001 |
| 7461 | CLIP2 | HTA11_1391_2000001011 | Human | Colorectum | AD | 3.67e-04 | 5.78e-01 | -0.059 |
| 7461 | CLIP2 | HTA11_99999970781_79442 | Human | Colorectum | MSS | 2.18e-04 | -2.82e-01 | 0.294 |
| 7461 | CLIP2 | A002-C-010 | Human | Colorectum | FAP | 1.11e-02 | -9.17e-02 | 0.242 |
| 7461 | CLIP2 | A015-C-203 | Human | Colorectum | FAP | 2.52e-23 | -4.48e-02 | -0.1294 |
| 7461 | CLIP2 | A002-C-201 | Human | Colorectum | FAP | 9.48e-07 | -1.36e-01 | 0.0324 |
| 7461 | CLIP2 | A002-C-203 | Human | Colorectum | FAP | 1.43e-04 | -1.36e-01 | 0.2786 |
| 7461 | CLIP2 | A001-C-108 | Human | Colorectum | FAP | 1.09e-15 | -2.06e-02 | -0.0272 |
| 7461 | CLIP2 | A002-C-205 | Human | Colorectum | FAP | 3.75e-14 | -4.34e-02 | -0.1236 |
| 7461 | CLIP2 | A001-C-104 | Human | Colorectum | FAP | 3.23e-03 | -5.74e-02 | 0.0184 |
| 7461 | CLIP2 | A015-C-005 | Human | Colorectum | FAP | 2.84e-05 | -3.29e-01 | -0.0336 |
| 7461 | CLIP2 | A015-C-006 | Human | Colorectum | FAP | 1.61e-08 | 1.78e-02 | -0.0994 |
| 7461 | CLIP2 | A015-C-106 | Human | Colorectum | FAP | 3.12e-10 | -8.65e-02 | -0.0511 |
| Page: 1 2 3 4 5 |
| Tissue | Expression Dynamics | Abbreviation |
| Colorectum (GSE201348) |  | FAP: Familial adenomatous polyposis |
| CRC: Colorectal cancer | ||
| Colorectum (HTA11) |  | AD: Adenomas |
| SER: Sessile serrated lesions | ||
| MSI-H: Microsatellite-high colorectal cancer | ||
| MSS: Microsatellite stable colorectal cancer | ||
| Endometrium |  | AEH: Atypical endometrial hyperplasia |
| EEC: Endometrioid Cancer | ||
| Esophagus |  | ESCC: Esophageal squamous cell carcinoma |
| HGIN: High-grade intraepithelial neoplasias | ||
| LGIN: Low-grade intraepithelial neoplasias | ||
| Liver | 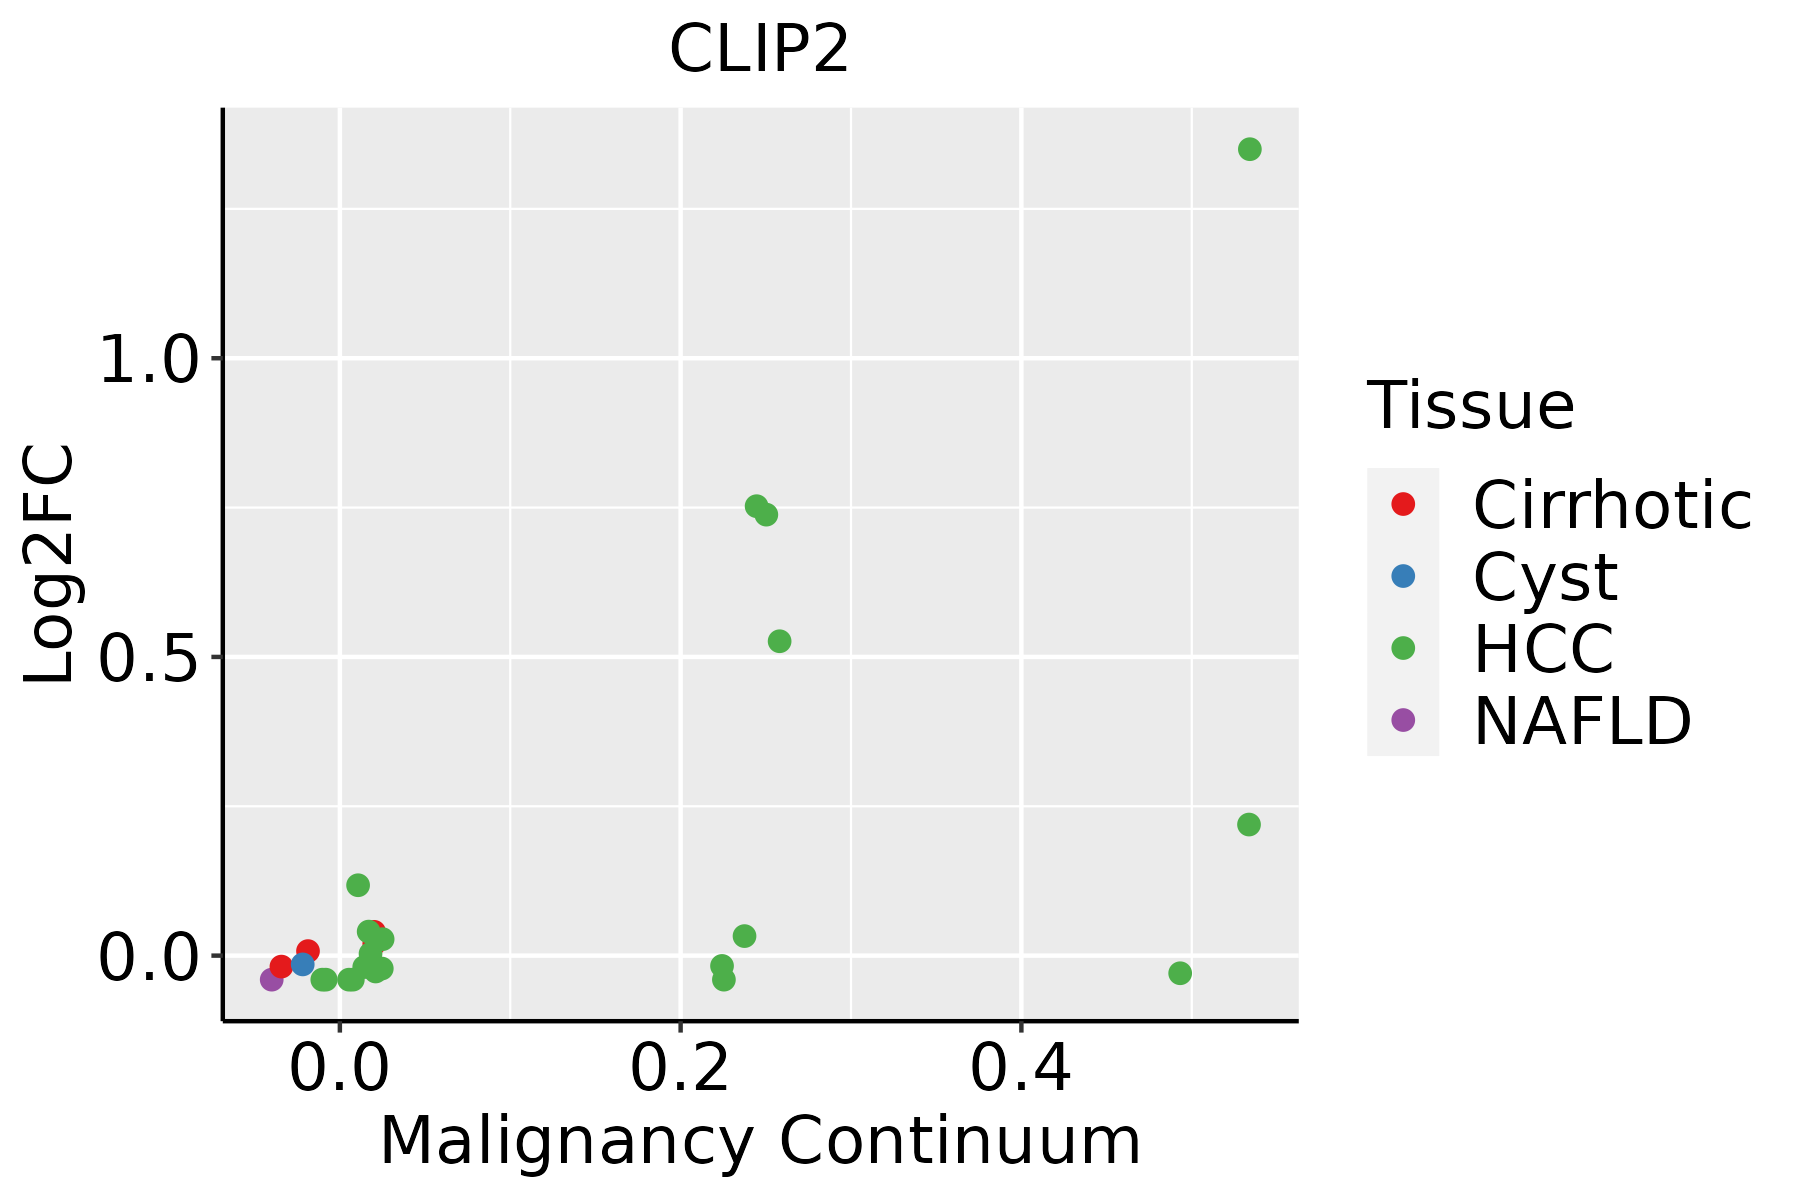 | HCC: Hepatocellular carcinoma |
| NAFLD: Non-alcoholic fatty liver disease | ||
| Prostate | 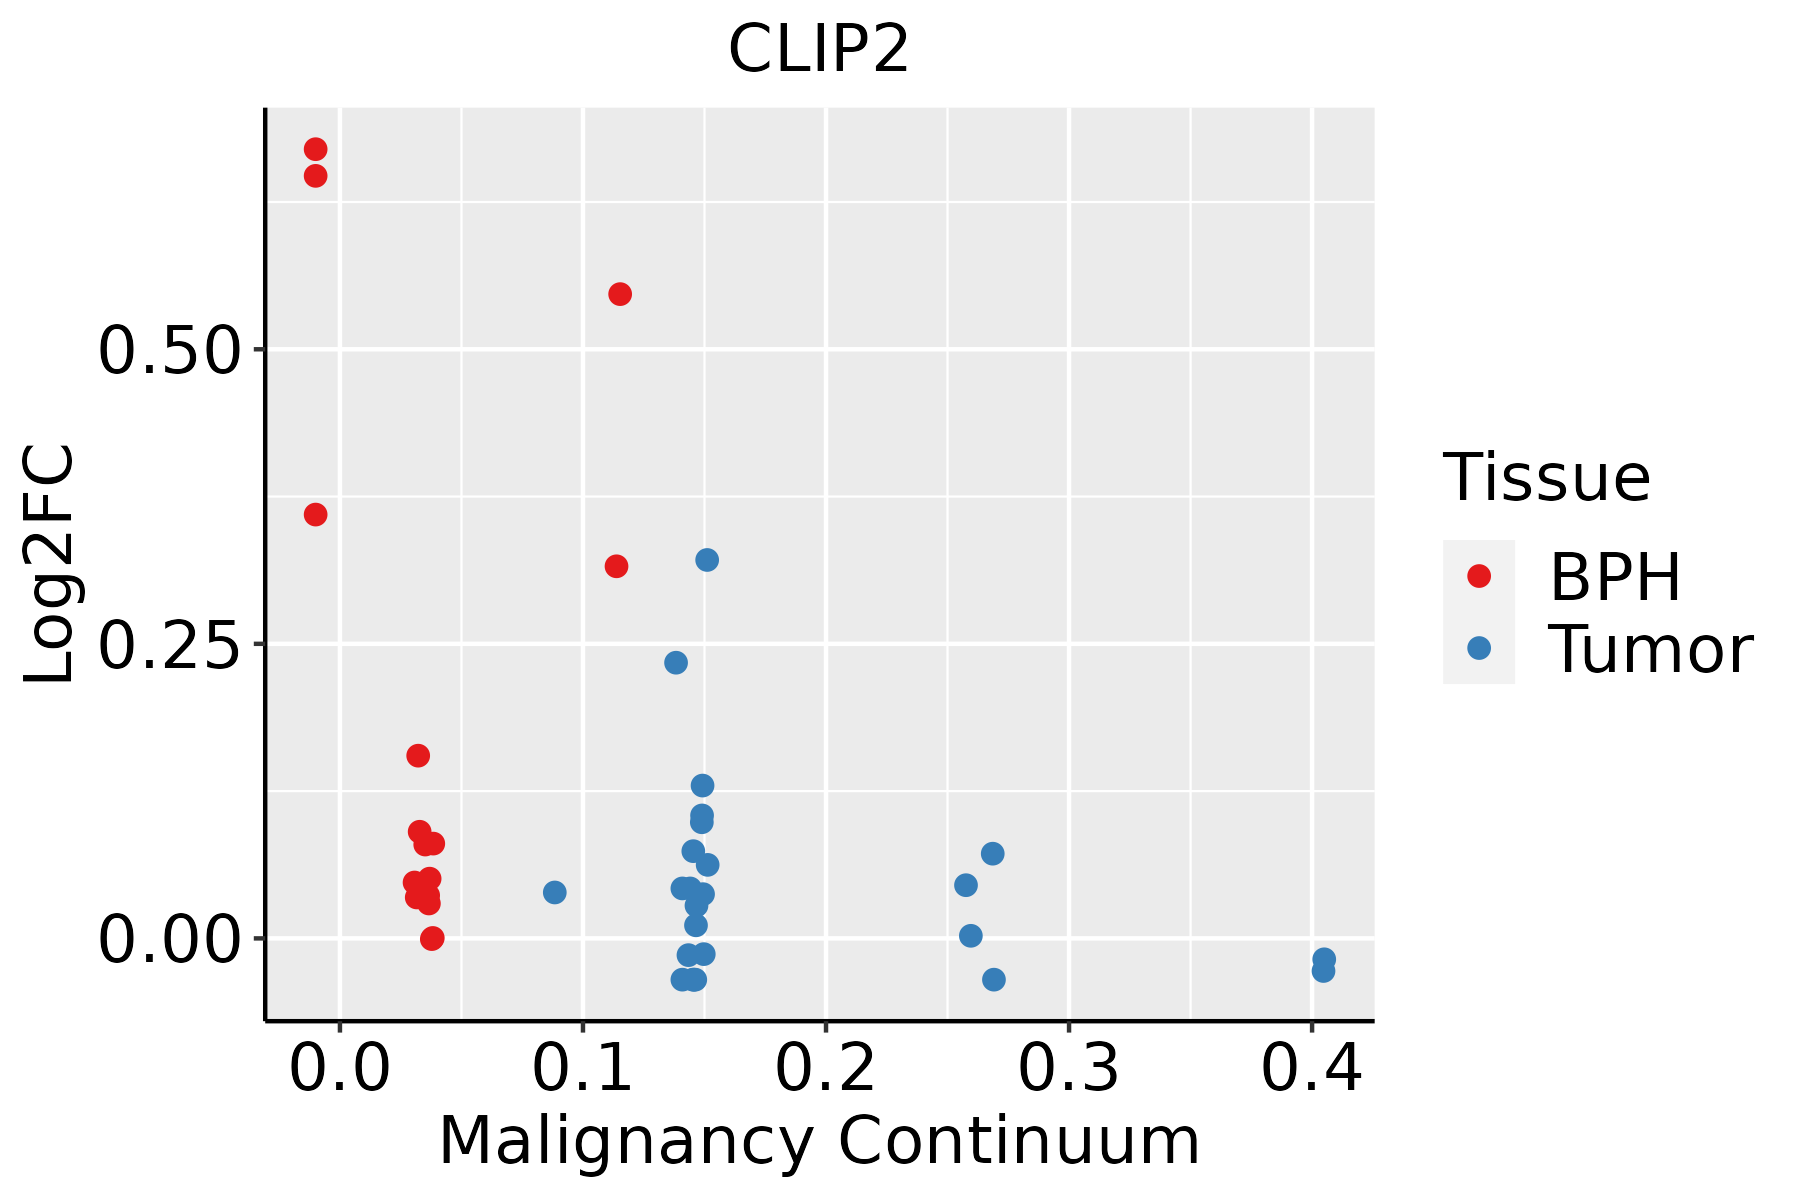 | BPH: Benign Prostatic Hyperplasia |
| Thyroid |  | ATC: Anaplastic thyroid cancer |
| HT: Hashimoto's thyroiditis | ||
| PTC: Papillary thyroid cancer |
| ∗log2FC in expression of this searched gene in stem-like cells from each diseased tissue sample relative to stem-like cells in normal samples in each tissue plotted against the malignancy continuum. Samples are colored based on if they are from different disease stage. |
Top |
Malignant transformation related pathway analysis |
| Find out the enriched GO biological processes and KEGG pathways involved in transition from healthy to precancer to cancer |
| Tissue | Disease Stage | Enriched GO biological Processes |
| Colorectum | AD |  |
| Colorectum | SER |  |
| Colorectum | MSS |  |
| Colorectum | MSI-H |  |
| Colorectum | FAP |  |
| ∗Top 15 enriched GO BP terms are showed in the bar plot of each disease state in each tissue. Each row represents a significant GO biological process which is colored according to the -log10(p.adjust). |
| Page: 1 2 3 4 5 6 7 8 9 |
| GO ID | Tissue | Disease Stage | Description | Gene Ratio | Bg Ratio | pvalue | p.adjust | Count |
| GO:0031122 | Colorectum | FAP | cytoplasmic microtubule organization | 17/2622 | 56/18723 | 1.24e-03 | 1.16e-02 | 17 |
| GO:00311221 | Colorectum | CRC | cytoplasmic microtubule organization | 16/2078 | 56/18723 | 2.72e-04 | 4.37e-03 | 16 |
| GO:00311227 | Esophagus | ESCC | cytoplasmic microtubule organization | 38/8552 | 56/18723 | 6.60e-04 | 3.50e-03 | 38 |
| GO:00311222 | Liver | HCC | cytoplasmic microtubule organization | 35/7958 | 56/18723 | 2.00e-03 | 1.01e-02 | 35 |
| GO:00311225 | Prostate | BPH | cytoplasmic microtubule organization | 22/3107 | 56/18723 | 4.21e-05 | 4.48e-04 | 22 |
| GO:00311229 | Thyroid | PTC | cytoplasmic microtubule organization | 34/5968 | 56/18723 | 8.20e-06 | 9.42e-05 | 34 |
| GO:003112215 | Thyroid | ATC | cytoplasmic microtubule organization | 34/6293 | 56/18723 | 2.92e-05 | 2.45e-04 | 34 |
| Page: 1 |
| Pathway ID | Tissue | Disease Stage | Description | Gene Ratio | Bg Ratio | pvalue | p.adjust | qvalue | Count |
| Page: 1 |
Top |
Cell-cell communication analysis |
| Identification of potential cell-cell interactions between two cell types and their ligand-receptor pairs for different disease states |
| Ligand | Receptor | LRpair | Pathway | Tissue | Disease Stage |
| Page: 1 |
Top |
Single-cell gene regulatory network inference analysis |
| Find out the significant the regulons (TFs) and the target genes of each regulon across cell types for different disease states |
| TF | Cell Type | Tissue | Disease Stage | Target Gene | RSS | Regulon Activity |
| ∗The dot plots of a searched regulon are shown for all cell subpopulations in each disease state of each tissue based on the regulon specific score inferred using pySCENIC and by calculating the average expression. |
| Page: 1 |
Top |
Somatic mutation of malignant transformation related genes |
| Annotation of somatic variants for genes involved in malignant transformation |
| Hugo Symbol | Variant Class | Variant Classification | dbSNP RS | HGVSc | HGVSp | HGVSp Short | SWISSPROT | BIOTYPE | SIFT | PolyPhen | Tumor Sample Barcode | Tissue | Histology | Sex | Age | Stage | Therapy Types | Drugs | Outcome |
| CLIP2 | SNV | Missense_Mutation | rs150588666 | c.1727N>T | p.Ala576Val | p.A576V | Q9UDT6 | protein_coding | deleterious(0.03) | benign(0.014) | TCGA-3C-AAAU-01 | Breast | breast invasive carcinoma | Female | <65 | I/II | Chemotherapy | zoladex | SD |
| CLIP2 | SNV | Missense_Mutation | rs782223327 | c.2299N>A | p.Glu767Lys | p.E767K | Q9UDT6 | protein_coding | tolerated(0.12) | benign(0) | TCGA-A8-A07R-01 | Breast | breast invasive carcinoma | Female | >=65 | III/IV | Ancillary | zoledronic | SD |
| CLIP2 | SNV | Missense_Mutation | c.1925N>G | p.Gln642Arg | p.Q642R | Q9UDT6 | protein_coding | deleterious(0) | possibly_damaging(0.574) | TCGA-AO-A128-01 | Breast | breast invasive carcinoma | Female | <65 | I/II | Chemotherapy | doxorubicin | SD | |
| CLIP2 | SNV | Missense_Mutation | rs782280647 | c.2539N>A | p.Glu847Lys | p.E847K | Q9UDT6 | protein_coding | deleterious(0.03) | benign(0.086) | TCGA-BH-A0B6-01 | Breast | breast invasive carcinoma | Female | <65 | I/II | Unknown | Unknown | SD |
| CLIP2 | SNV | Missense_Mutation | c.2221G>C | p.Glu741Gln | p.E741Q | Q9UDT6 | protein_coding | tolerated(0.09) | benign(0.399) | TCGA-BH-A18F-01 | Breast | breast invasive carcinoma | Female | <65 | I/II | Chemotherapy | taxotere | CR | |
| CLIP2 | SNV | Missense_Mutation | c.1124G>A | p.Arg375Gln | p.R375Q | Q9UDT6 | protein_coding | deleterious(0.02) | probably_damaging(0.992) | TCGA-EW-A1J5-01 | Breast | breast invasive carcinoma | Female | <65 | I/II | Chemotherapy | adriamycin | SD | |
| CLIP2 | SNV | Missense_Mutation | rs553860682 | c.77G>T | p.Gly26Val | p.G26V | Q9UDT6 | protein_coding | deleterious(0.03) | probably_damaging(0.999) | TCGA-EW-A3U0-01 | Breast | breast invasive carcinoma | Female | <65 | III/IV | Chemotherapy | cisplatin | CR |
| CLIP2 | insertion | In_Frame_Ins | novel | c.913_914insTAGGAAAAAAAAATTTCTGGAAAGGAAAAGTAACTA | p.Ala305delinsValGlyLysLysAsnPheTrpLysGlyLysValThrThr | p.A305delinsVGKKNFWKGKVTT | Q9UDT6 | protein_coding | TCGA-AN-A0FS-01 | Breast | breast invasive carcinoma | Female | <65 | I/II | Unknown | Unknown | SD | ||
| CLIP2 | SNV | Missense_Mutation | rs199904386 | c.419C>T | p.Thr140Met | p.T140M | Q9UDT6 | protein_coding | deleterious(0) | probably_damaging(0.999) | TCGA-2W-A8YY-01 | Cervix | cervical & endocervical cancer | Female | <65 | I/II | Chemotherapy | cisplatin | CR |
| CLIP2 | SNV | Missense_Mutation | rs368779286 | c.2762G>A | p.Arg921His | p.R921H | Q9UDT6 | protein_coding | deleterious(0) | probably_damaging(0.996) | TCGA-2W-A8YY-01 | Cervix | cervical & endocervical cancer | Female | <65 | I/II | Chemotherapy | cisplatin | CR |
| Page: 1 2 3 4 5 6 7 8 9 10 11 12 13 |
Top |
Related drugs of malignant transformation related genes |
| Identification of chemicals and drugs interact with genes involved in malignant transfromation |
| (DGIdb 4.0) |
| Entrez ID | Symbol | Category | Interaction Types | Drug Claim Name | Drug Name | PMIDs |
| Page: 1 |

Copyright 2023-Present -The University of Texas Health Science Center at Houston |