
|
|||||
|
 | |
| |
| |
| |
| |
| |
|
Gene: CLIC6 |
Gene summary for CLIC6 |
| Gene information | Species | Human | Gene symbol | CLIC6 | Gene ID | 54102 |
| Gene name | chloride intracellular channel 6 | |
| Gene Alias | CLIC1L | |
| Cytomap | 21q22.12 | |
| Gene Type | protein-coding | GO ID | GO:0006810 | UniProtAcc | Q96NY7 |
Top |
Malignant transformation analysis |
| Identification of the aberrant gene expression in precancerous and cancerous lesions by comparing the gene expression of stem-like cells in diseased tissues with normal stem cells |
| Entrez ID | Symbol | Replicates | Species | Organ | Tissue | Adj P-value | Log2FC | Malignancy |
| 54102 | CLIC6 | GSM4909301 | Human | Breast | IDC | 4.73e-03 | 2.78e-01 | 0.1577 |
| 54102 | CLIC6 | GSM4909302 | Human | Breast | IDC | 1.94e-59 | 1.12e+00 | 0.1545 |
| 54102 | CLIC6 | GSM4909303 | Human | Breast | IDC | 2.57e-05 | 4.03e-01 | 0.0438 |
| 54102 | CLIC6 | GSM4909304 | Human | Breast | IDC | 5.05e-61 | 9.85e-01 | 0.1636 |
| 54102 | CLIC6 | NCCBC11 | Human | Breast | DCIS | 4.45e-13 | 8.50e-01 | 0.1232 |
| 54102 | CLIC6 | NCCBC3 | Human | Breast | DCIS | 1.91e-04 | 2.87e-01 | 0.1198 |
| 54102 | CLIC6 | HTA11_7663_2000001011 | Human | Colorectum | SER | 4.68e-03 | 6.76e-01 | 0.0131 |
| 54102 | CLIC6 | HTA11_7696_3000711011 | Human | Colorectum | AD | 8.12e-03 | 1.97e-01 | 0.0674 |
| 54102 | CLIC6 | A015-C-202 | Human | Colorectum | FAP | 1.34e-05 | 2.79e-01 | -0.0849 |
| 54102 | CLIC6 | RNA-P17T-P17T-2 | Human | Lung | IAC | 1.46e-12 | 1.15e+00 | 0.3371 |
| 54102 | CLIC6 | RNA-P17T-P17T-4 | Human | Lung | IAC | 1.01e-07 | 9.67e-01 | 0.343 |
| 54102 | CLIC6 | RNA-P17T-P17T-6 | Human | Lung | IAC | 4.07e-06 | 9.93e-01 | 0.3385 |
| 54102 | CLIC6 | RNA-P17T-P17T-8 | Human | Lung | IAC | 4.38e-09 | 8.29e-01 | 0.3329 |
| 54102 | CLIC6 | RNA-P6T1-P6T1-2 | Human | Lung | MIAC | 5.50e-04 | 7.85e-01 | -0.0186 |
| 54102 | CLIC6 | RNA-P6T1-P6T1-3 | Human | Lung | MIAC | 4.57e-02 | 5.20e-01 | -0.0296 |
| 54102 | CLIC6 | RNA-P6T1-P6T1-4 | Human | Lung | MIAC | 1.64e-04 | 8.41e-01 | -0.0263 |
| 54102 | CLIC6 | RNA-P6T2-P6T2-1 | Human | Lung | IAC | 2.41e-07 | 3.33e-01 | -0.0166 |
| 54102 | CLIC6 | RNA-P6T2-P6T2-2 | Human | Lung | IAC | 1.19e-12 | 3.70e-01 | -0.0132 |
| 54102 | CLIC6 | RNA-P6T2-P6T2-3 | Human | Lung | IAC | 5.20e-14 | 4.19e-01 | -0.013 |
| 54102 | CLIC6 | RNA-P6T2-P6T2-4 | Human | Lung | IAC | 1.75e-12 | 4.40e-01 | -0.0121 |
| Page: 1 2 |
| Tissue | Expression Dynamics | Abbreviation |
| Breast | 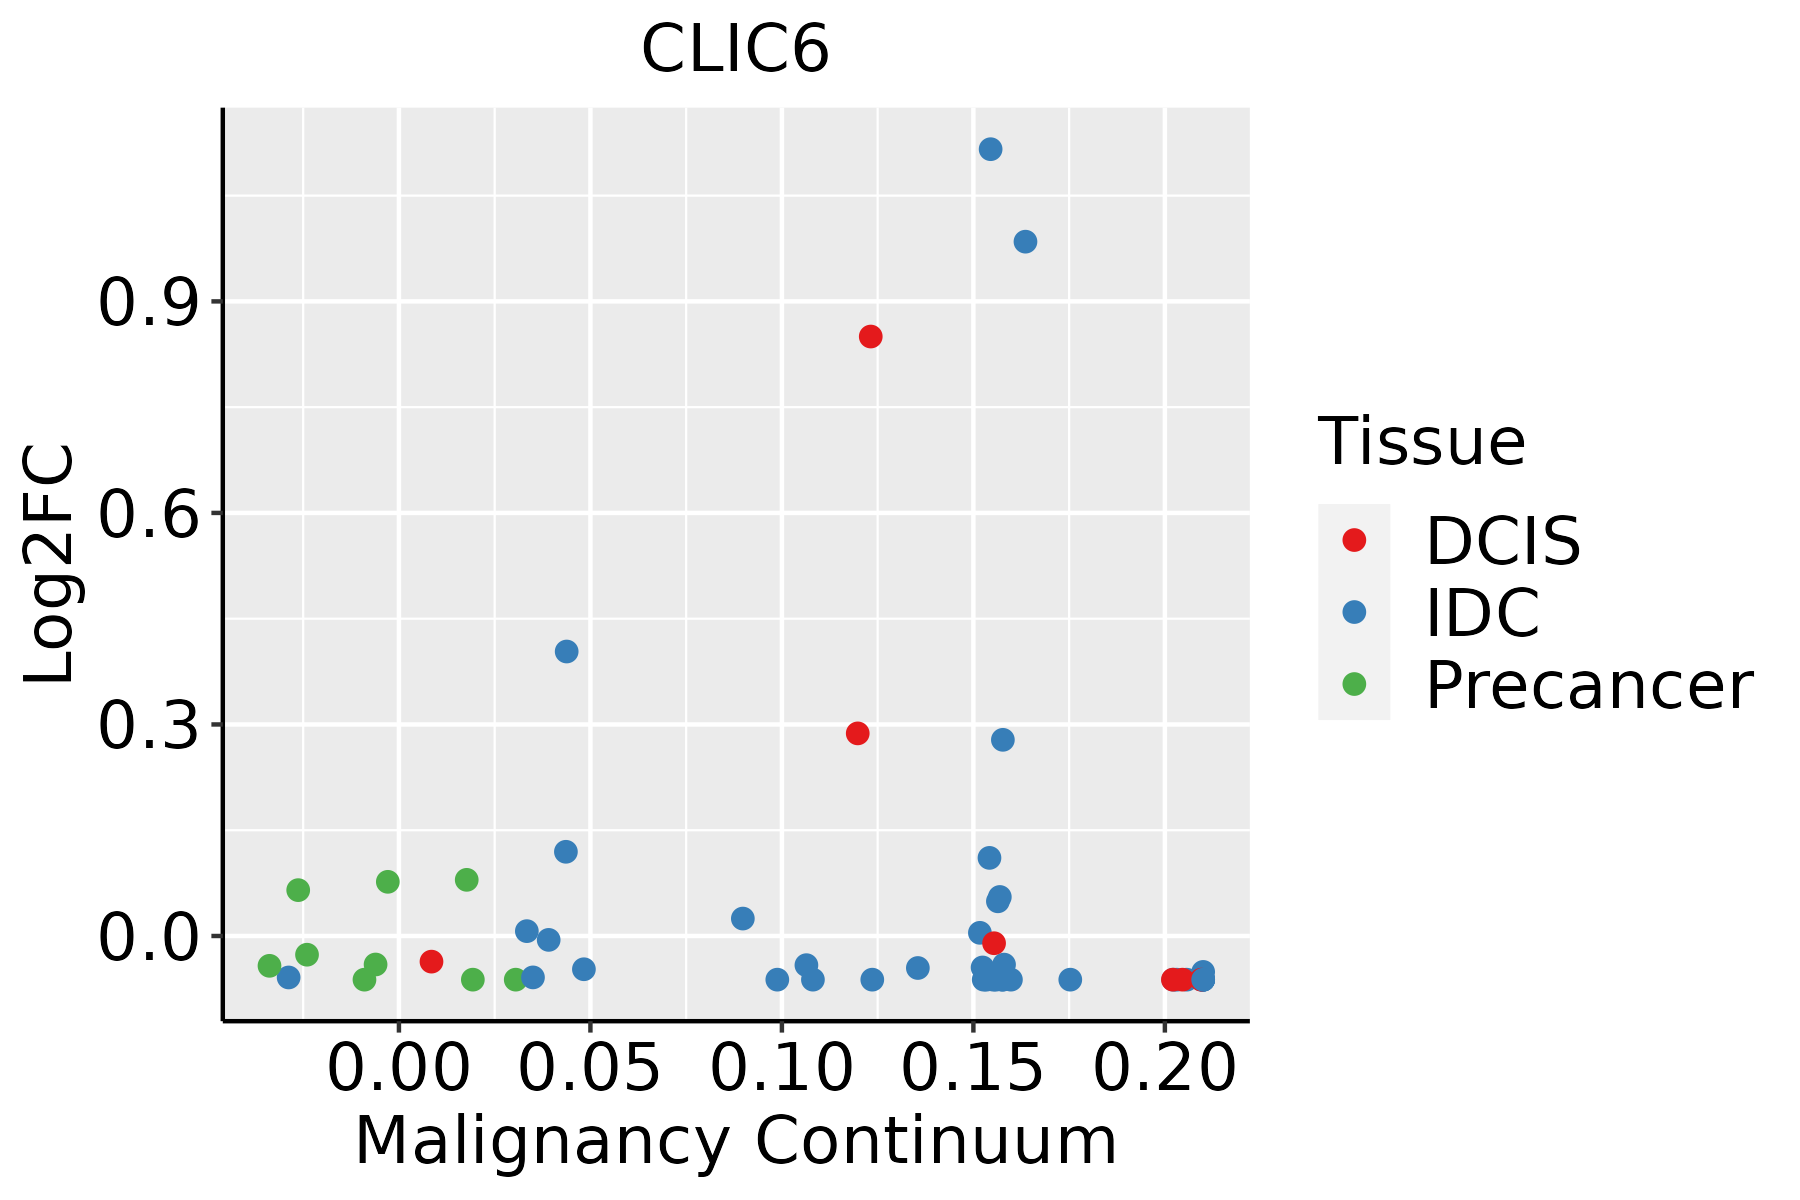 | IDC: Invasive ductal carcinoma |
| DCIS: Ductal carcinoma in situ | ||
| Precancer(BRCA1-mut): Precancerous lesion from BRCA1 mutation carriers | ||
| Colorectum (GSE201348) |  | FAP: Familial adenomatous polyposis |
| CRC: Colorectal cancer | ||
| Colorectum (HTA11) |  | AD: Adenomas |
| SER: Sessile serrated lesions | ||
| MSI-H: Microsatellite-high colorectal cancer | ||
| MSS: Microsatellite stable colorectal cancer | ||
| Lung | 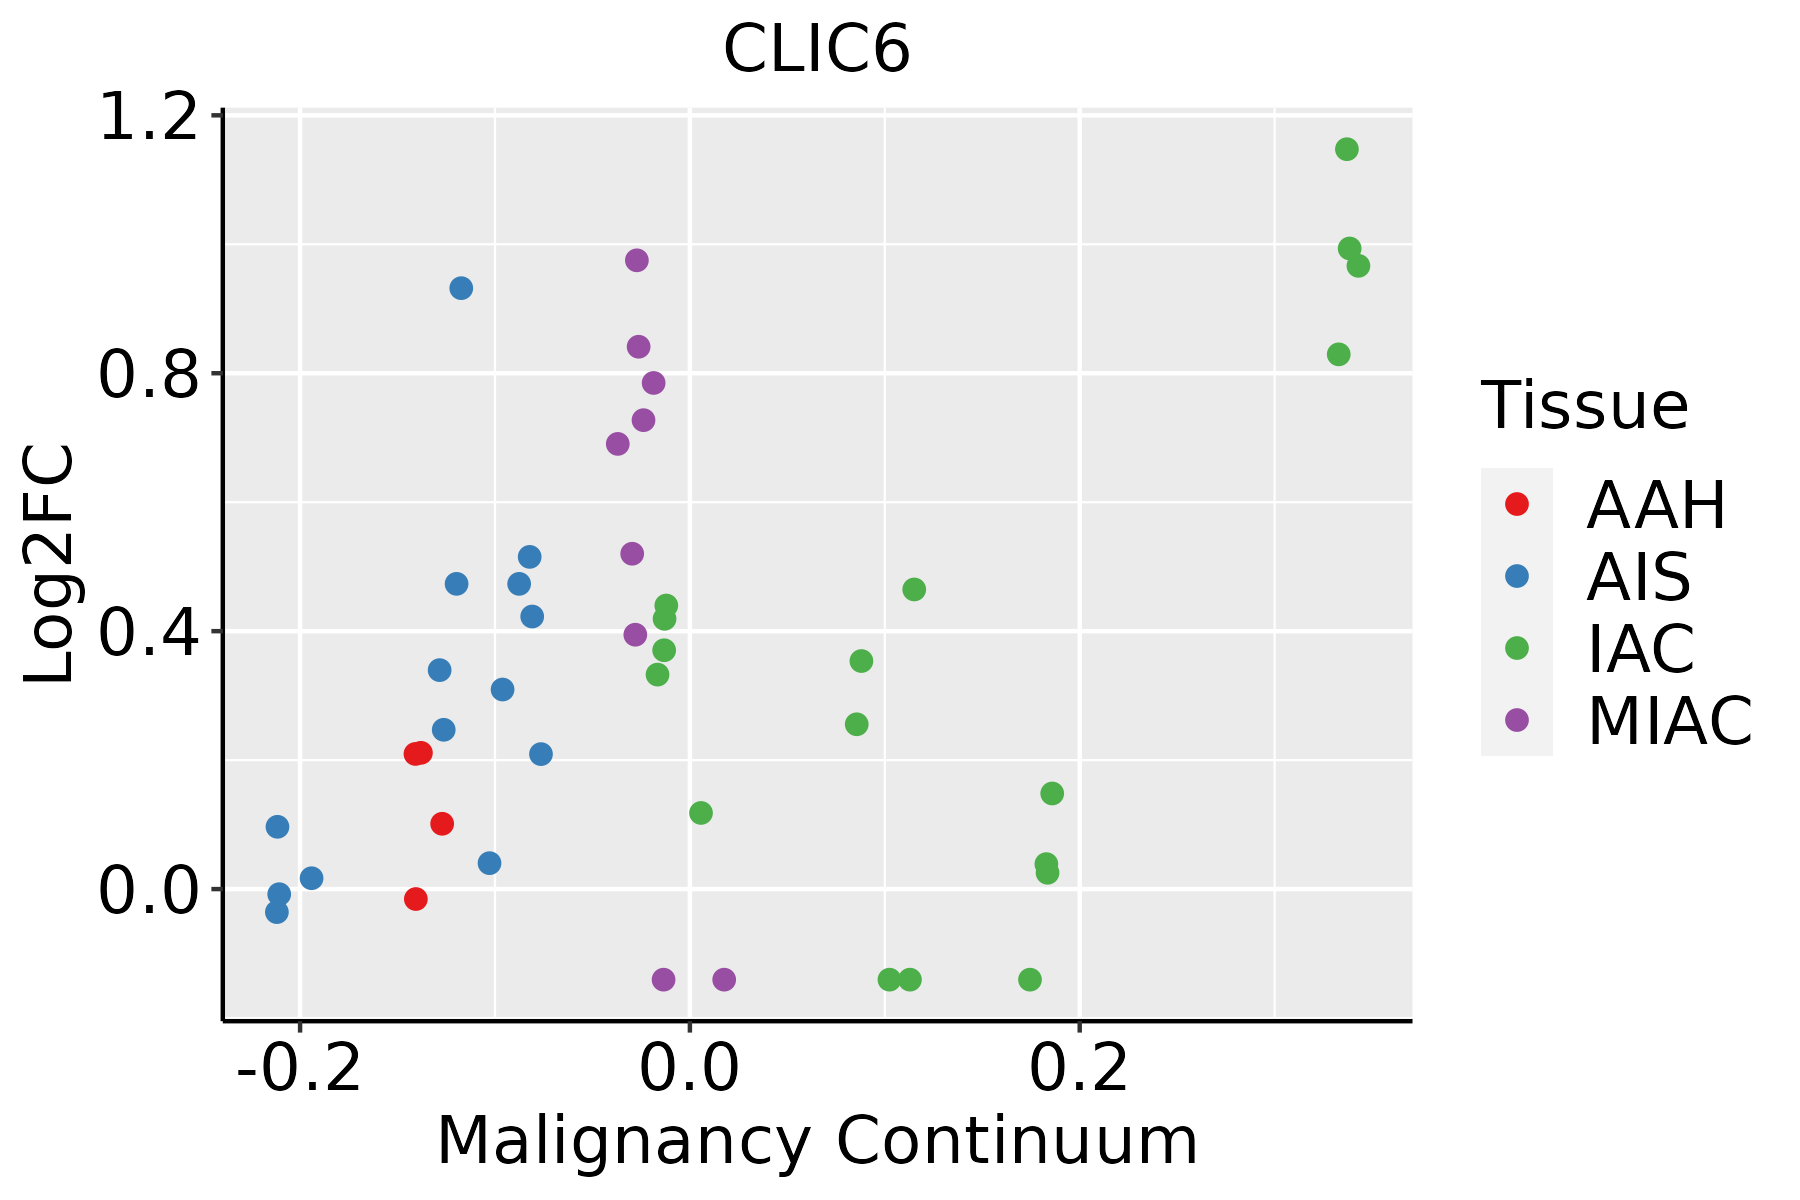 | AAH: Atypical adenomatous hyperplasia |
| AIS: Adenocarcinoma in situ | ||
| IAC: Invasive lung adenocarcinoma | ||
| MIA: Minimally invasive adenocarcinoma |
| ∗log2FC in expression of this searched gene in stem-like cells from each diseased tissue sample relative to stem-like cells in normal samples in each tissue plotted against the malignancy continuum. Samples are colored based on if they are from different disease stage. |
Top |
Malignant transformation related pathway analysis |
| Find out the enriched GO biological processes and KEGG pathways involved in transition from healthy to precancer to cancer |
| Tissue | Disease Stage | Enriched GO biological Processes |
| Colorectum | AD |  |
| Colorectum | SER |  |
| Colorectum | MSS |  |
| Colorectum | MSI-H |  |
| Colorectum | FAP |  |
| ∗Top 15 enriched GO BP terms are showed in the bar plot of each disease state in each tissue. Each row represents a significant GO biological process which is colored according to the -log10(p.adjust). |
| Page: 1 2 3 4 5 6 7 8 9 |
| GO ID | Tissue | Disease Stage | Description | Gene Ratio | Bg Ratio | pvalue | p.adjust | Count |
| GO:0015698 | Colorectum | AD | inorganic anion transport | 52/3918 | 180/18723 | 6.83e-03 | 4.22e-02 | 52 |
| GO:00156981 | Colorectum | FAP | inorganic anion transport | 38/2622 | 180/18723 | 5.73e-03 | 3.67e-02 | 38 |
| Page: 1 |
| Pathway ID | Tissue | Disease Stage | Description | Gene Ratio | Bg Ratio | pvalue | p.adjust | qvalue | Count |
| Page: 1 |
Top |
Cell-cell communication analysis |
| Identification of potential cell-cell interactions between two cell types and their ligand-receptor pairs for different disease states |
| Ligand | Receptor | LRpair | Pathway | Tissue | Disease Stage |
| Page: 1 |
Top |
Single-cell gene regulatory network inference analysis |
| Find out the significant the regulons (TFs) and the target genes of each regulon across cell types for different disease states |
| TF | Cell Type | Tissue | Disease Stage | Target Gene | RSS | Regulon Activity |
| ∗The dot plots of a searched regulon are shown for all cell subpopulations in each disease state of each tissue based on the regulon specific score inferred using pySCENIC and by calculating the average expression. |
| Page: 1 |
Top |
Somatic mutation of malignant transformation related genes |
| Annotation of somatic variants for genes involved in malignant transformation |
| Hugo Symbol | Variant Class | Variant Classification | dbSNP RS | HGVSc | HGVSp | HGVSp Short | SWISSPROT | BIOTYPE | SIFT | PolyPhen | Tumor Sample Barcode | Tissue | Histology | Sex | Age | Stage | Therapy Types | Drugs | Outcome |
| CLIC6 | SNV | Missense_Mutation | novel | c.1252N>T | p.Ala418Ser | p.A418S | Q96NY7 | protein_coding | deleterious(0.03) | benign(0.062) | TCGA-AC-A8OR-01 | Breast | breast invasive carcinoma | Female | >=65 | I/II | Unknown | Unknown | SD |
| CLIC6 | SNV | Missense_Mutation | c.2036N>A | p.Arg679Lys | p.R679K | Q96NY7 | protein_coding | deleterious(0.02) | probably_damaging(0.928) | TCGA-D8-A1J8-01 | Breast | breast invasive carcinoma | Female | >=65 | I/II | Hormone Therapy | nolvadex | SD | |
| CLIC6 | SNV | Missense_Mutation | c.2046N>A | p.Phe682Leu | p.F682L | Q96NY7 | protein_coding | deleterious(0) | probably_damaging(0.963) | TCGA-D8-A27G-01 | Breast | breast invasive carcinoma | Female | >=65 | I/II | Unknown | Unknown | SD | |
| CLIC6 | SNV | Missense_Mutation | rs141470374 | c.1910C>T | p.Thr637Met | p.T637M | Q96NY7 | protein_coding | deleterious(0) | probably_damaging(0.997) | TCGA-A6-6781-01 | Colorectum | colon adenocarcinoma | Male | <65 | III/IV | Chemotherapy | oxaliplatin | SD |
| CLIC6 | SNV | Missense_Mutation | rs148002160 | c.1546N>A | p.Ala516Thr | p.A516T | Q96NY7 | protein_coding | deleterious(0.03) | benign(0.026) | TCGA-AA-3510-01 | Colorectum | colon adenocarcinoma | Male | >=65 | I/II | Unknown | Unknown | SD |
| CLIC6 | SNV | Missense_Mutation | rs772153839 | c.2027N>T | p.Ala676Val | p.A676V | Q96NY7 | protein_coding | deleterious(0.01) | benign(0.273) | TCGA-AA-3510-01 | Colorectum | colon adenocarcinoma | Male | >=65 | I/II | Unknown | Unknown | SD |
| CLIC6 | SNV | Missense_Mutation | c.2109G>T | p.Met703Ile | p.M703I | Q96NY7 | protein_coding | deleterious(0.02) | benign(0.066) | TCGA-AA-3955-01 | Colorectum | colon adenocarcinoma | Male | <65 | III/IV | Chemotherapy | capecitabine | CR | |
| CLIC6 | SNV | Missense_Mutation | c.1378A>C | p.Lys460Gln | p.K460Q | Q96NY7 | protein_coding | tolerated_low_confidence(0.11) | benign(0.02) | TCGA-AA-3977-01 | Colorectum | colon adenocarcinoma | Male | >=65 | I/II | Unknown | Unknown | SD | |
| CLIC6 | SNV | Missense_Mutation | c.1489C>A | p.Leu497Ile | p.L497I | Q96NY7 | protein_coding | deleterious(0) | probably_damaging(1) | TCGA-AA-3977-01 | Colorectum | colon adenocarcinoma | Male | >=65 | I/II | Unknown | Unknown | SD | |
| CLIC6 | SNV | Missense_Mutation | rs145427334 | c.1705G>A | p.Ala569Thr | p.A569T | Q96NY7 | protein_coding | deleterious(0) | probably_damaging(0.995) | TCGA-CM-6171-01 | Colorectum | colon adenocarcinoma | Female | >=65 | I/II | Unknown | Unknown | SD |
| Page: 1 2 3 4 |
Top |
Related drugs of malignant transformation related genes |
| Identification of chemicals and drugs interact with genes involved in malignant transfromation |
| (DGIdb 4.0) |
| Entrez ID | Symbol | Category | Interaction Types | Drug Claim Name | Drug Name | PMIDs |
| Page: 1 |

Copyright 2023-Present -The University of Texas Health Science Center at Houston |