
|
|||||
|
 | |
| |
| |
| |
| |
| |
|
Gene: CLIC3 |
Gene summary for CLIC3 |
| Gene information | Species | Human | Gene symbol | CLIC3 | Gene ID | 9022 |
| Gene name | chloride intracellular channel 3 | |
| Gene Alias | CLIC3 | |
| Cytomap | 9q34.3 | |
| Gene Type | protein-coding | GO ID | GO:0006518 | UniProtAcc | O95833 |
Top |
Malignant transformation analysis |
| Identification of the aberrant gene expression in precancerous and cancerous lesions by comparing the gene expression of stem-like cells in diseased tissues with normal stem cells |
| Entrez ID | Symbol | Replicates | Species | Organ | Tissue | Adj P-value | Log2FC | Malignancy |
| 9022 | CLIC3 | GSM4909281 | Human | Breast | IDC | 1.45e-04 | 1.66e-01 | 0.21 |
| 9022 | CLIC3 | GSM4909285 | Human | Breast | IDC | 8.52e-04 | 1.21e-01 | 0.21 |
| 9022 | CLIC3 | GSM4909295 | Human | Breast | IDC | 4.06e-04 | 3.21e-01 | 0.0898 |
| 9022 | CLIC3 | GSM4909315 | Human | Breast | IDC | 2.60e-69 | 1.30e+00 | 0.21 |
| 9022 | CLIC3 | GSM4909316 | Human | Breast | IDC | 9.93e-39 | 1.42e+00 | 0.21 |
| 9022 | CLIC3 | GSM4909317 | Human | Breast | IDC | 1.40e-36 | 8.49e-01 | 0.1355 |
| 9022 | CLIC3 | GSM4909318 | Human | Breast | IDC | 5.63e-05 | 5.77e-01 | 0.2031 |
| 9022 | CLIC3 | LZE5T | Human | Esophagus | ESCC | 1.60e-05 | 8.30e-01 | 0.0514 |
| 9022 | CLIC3 | LZE20T | Human | Esophagus | ESCC | 8.21e-06 | 4.65e-01 | 0.0662 |
| 9022 | CLIC3 | LZE22T | Human | Esophagus | ESCC | 1.45e-04 | 4.89e-01 | 0.068 |
| 9022 | CLIC3 | P2T-E | Human | Esophagus | ESCC | 6.10e-07 | 2.52e-01 | 0.1177 |
| 9022 | CLIC3 | P8T-E | Human | Esophagus | ESCC | 1.18e-26 | 7.31e-01 | 0.0889 |
| 9022 | CLIC3 | P11T-E | Human | Esophagus | ESCC | 5.32e-11 | 7.32e-01 | 0.1426 |
| 9022 | CLIC3 | P17T-E | Human | Esophagus | ESCC | 1.19e-05 | 4.30e-01 | 0.1278 |
| 9022 | CLIC3 | P21T-E | Human | Esophagus | ESCC | 6.22e-09 | 3.35e-01 | 0.1617 |
| 9022 | CLIC3 | P24T-E | Human | Esophagus | ESCC | 2.82e-02 | 2.16e-01 | 0.1287 |
| 9022 | CLIC3 | P31T-E | Human | Esophagus | ESCC | 6.46e-03 | 4.36e-01 | 0.1251 |
| 9022 | CLIC3 | P37T-E | Human | Esophagus | ESCC | 2.91e-04 | 2.02e-01 | 0.1371 |
| 9022 | CLIC3 | P38T-E | Human | Esophagus | ESCC | 3.14e-08 | 3.59e-01 | 0.127 |
| 9022 | CLIC3 | P39T-E | Human | Esophagus | ESCC | 3.41e-05 | 4.69e-01 | 0.0894 |
| Page: 1 2 3 4 |
| Tissue | Expression Dynamics | Abbreviation |
| Breast | 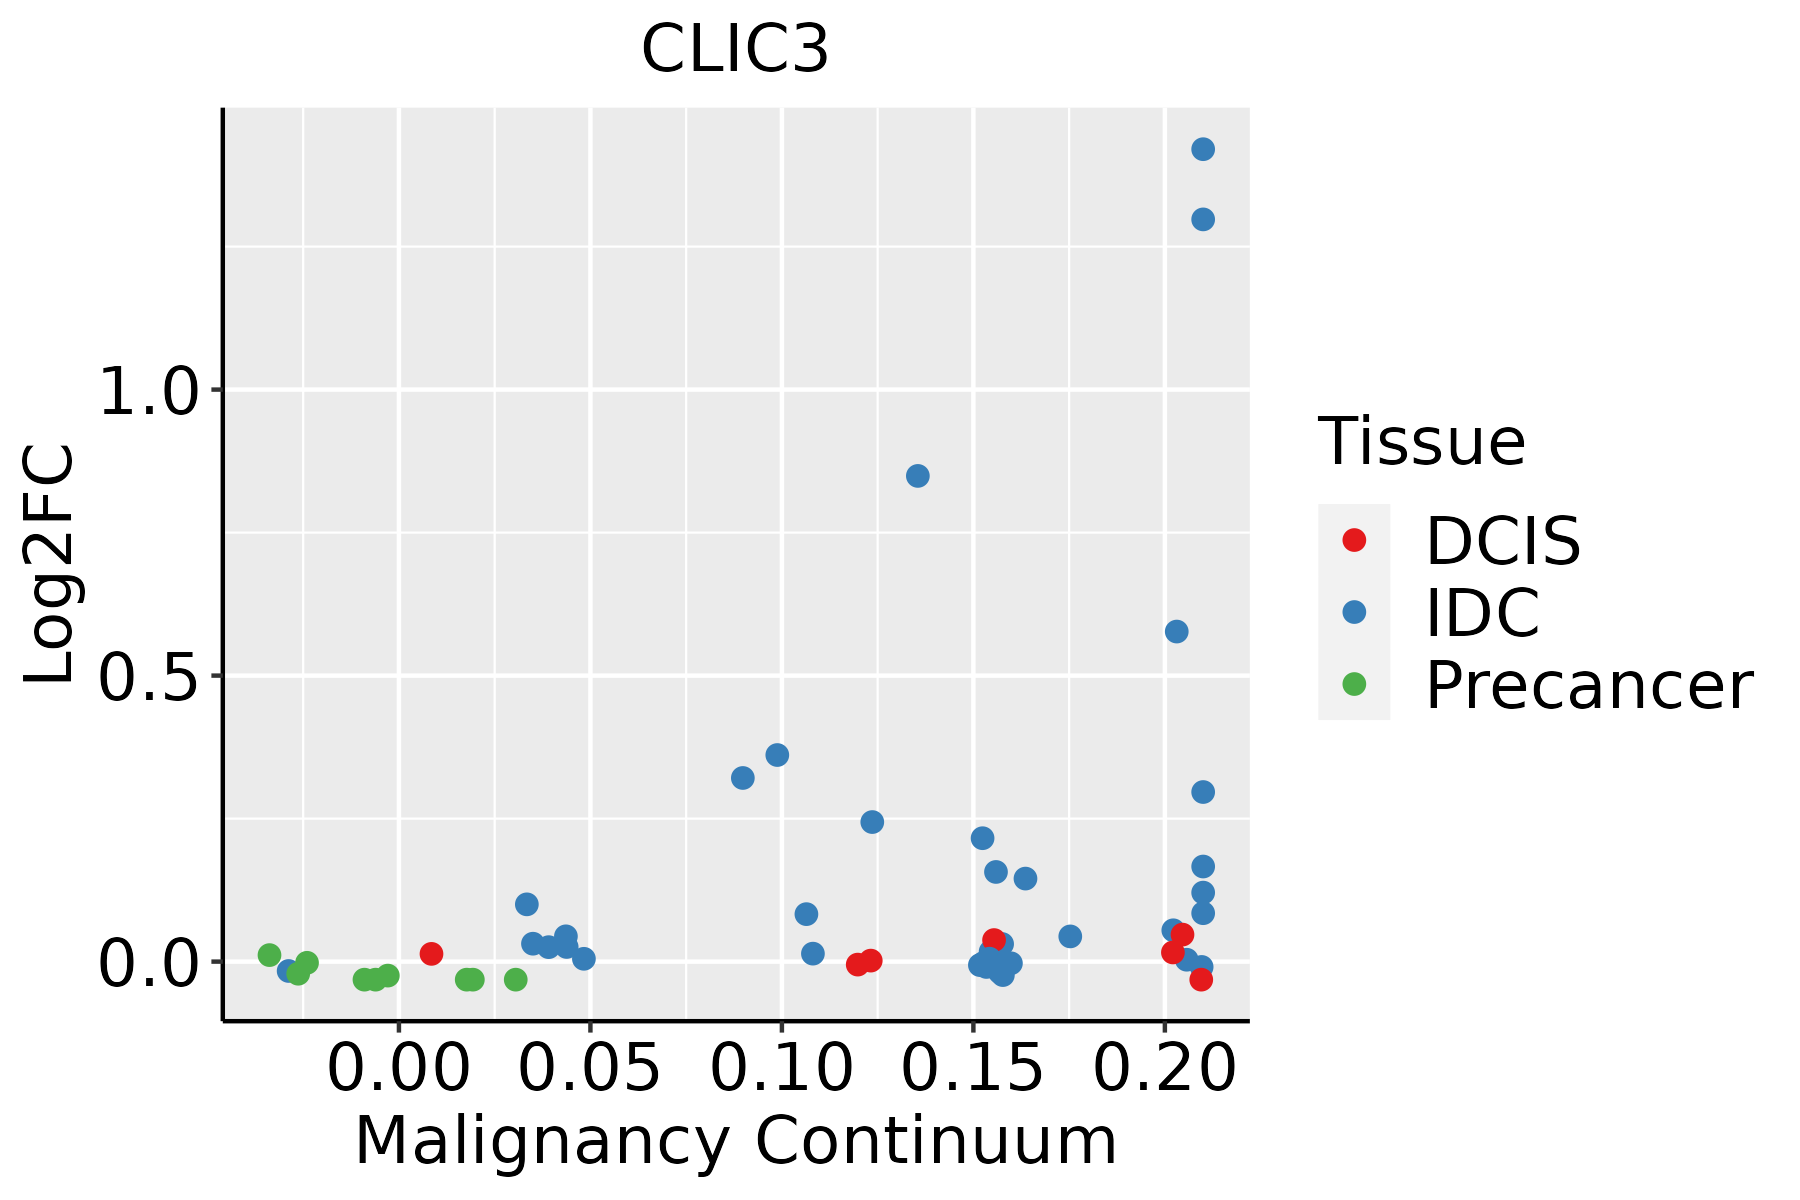 | IDC: Invasive ductal carcinoma |
| DCIS: Ductal carcinoma in situ | ||
| Precancer(BRCA1-mut): Precancerous lesion from BRCA1 mutation carriers | ||
| Esophagus | 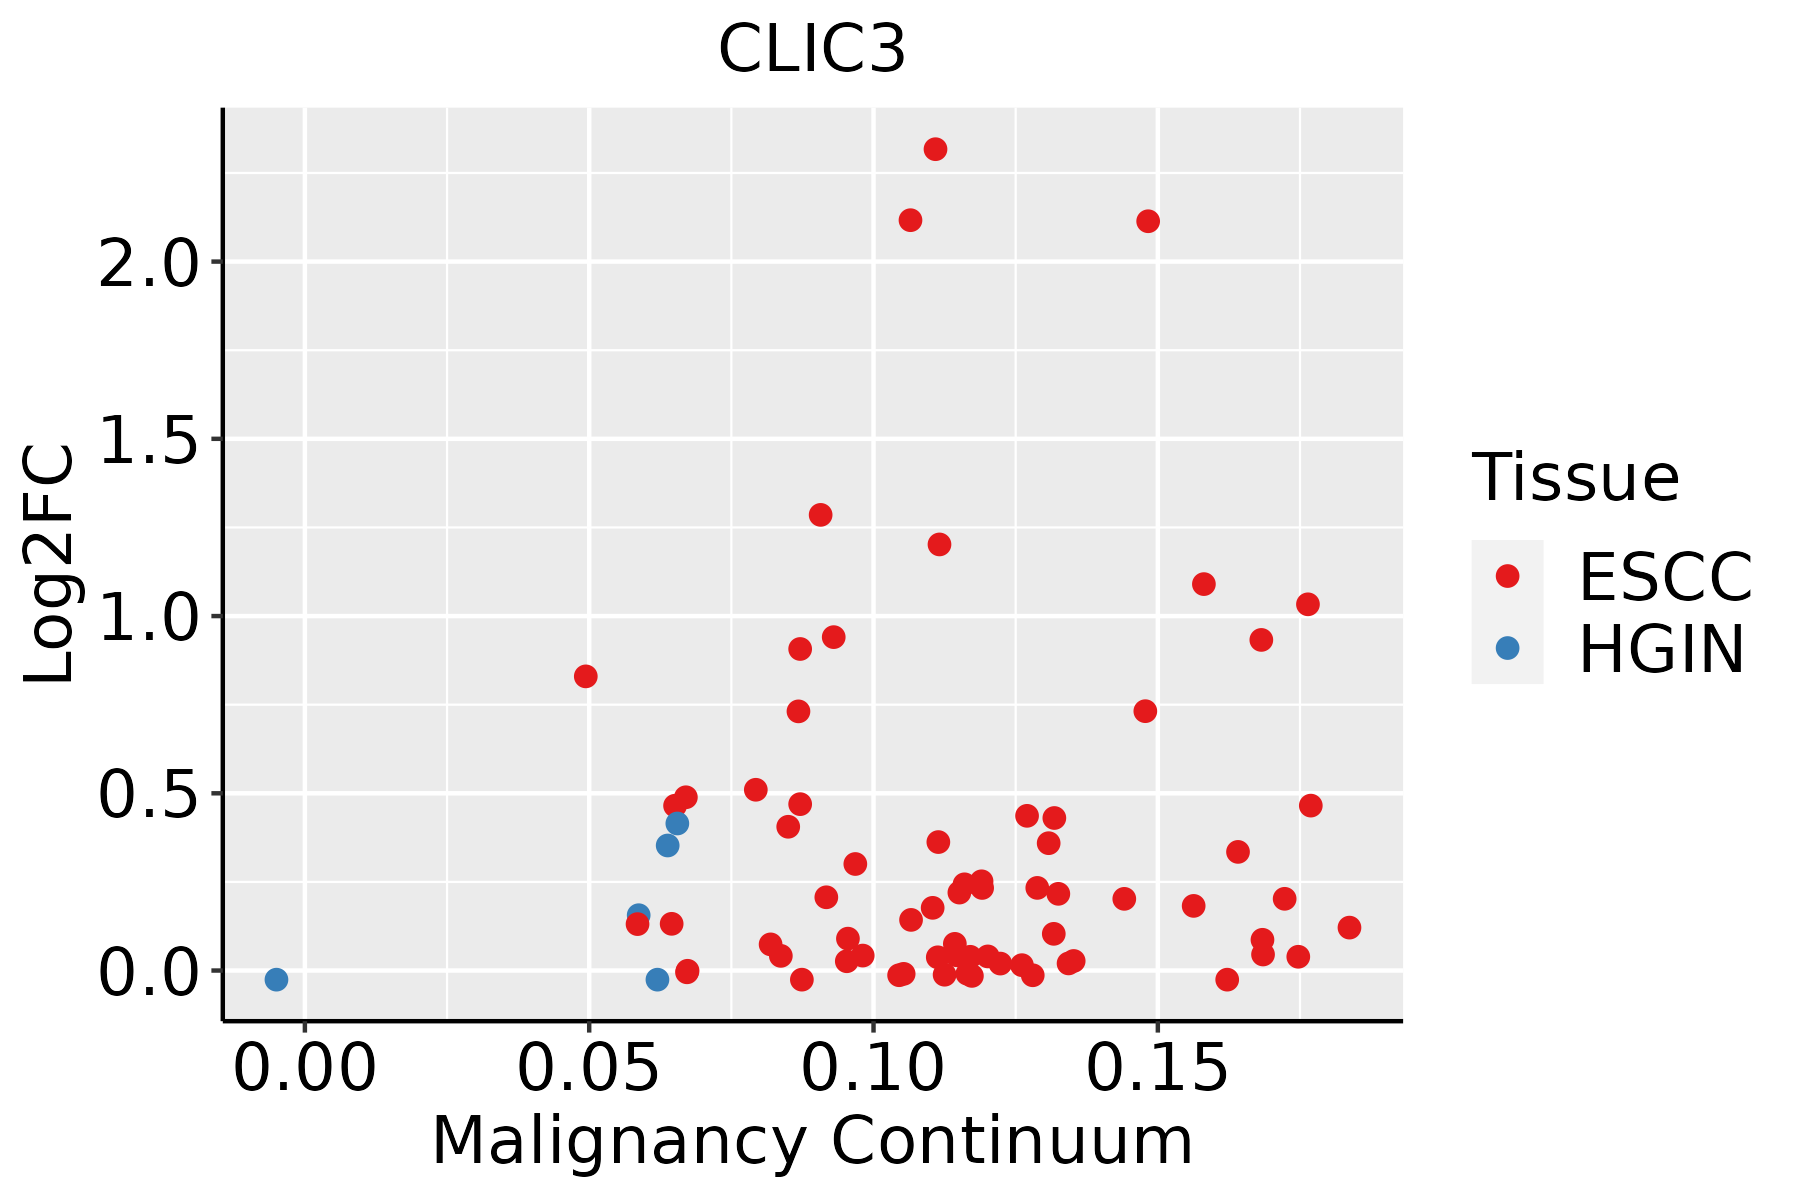 | ESCC: Esophageal squamous cell carcinoma |
| HGIN: High-grade intraepithelial neoplasias | ||
| LGIN: Low-grade intraepithelial neoplasias | ||
| GC |  | CAG: Chronic atrophic gastritis |
| CAG with IM: Chronic atrophic gastritis with intestinal metaplasia | ||
| CSG: Chronic superficial gastritis | ||
| GC: Gastric cancer | ||
| SIM: Severe intestinal metaplasia | ||
| WIM: Wild intestinal metaplasia | ||
| Oral Cavity | 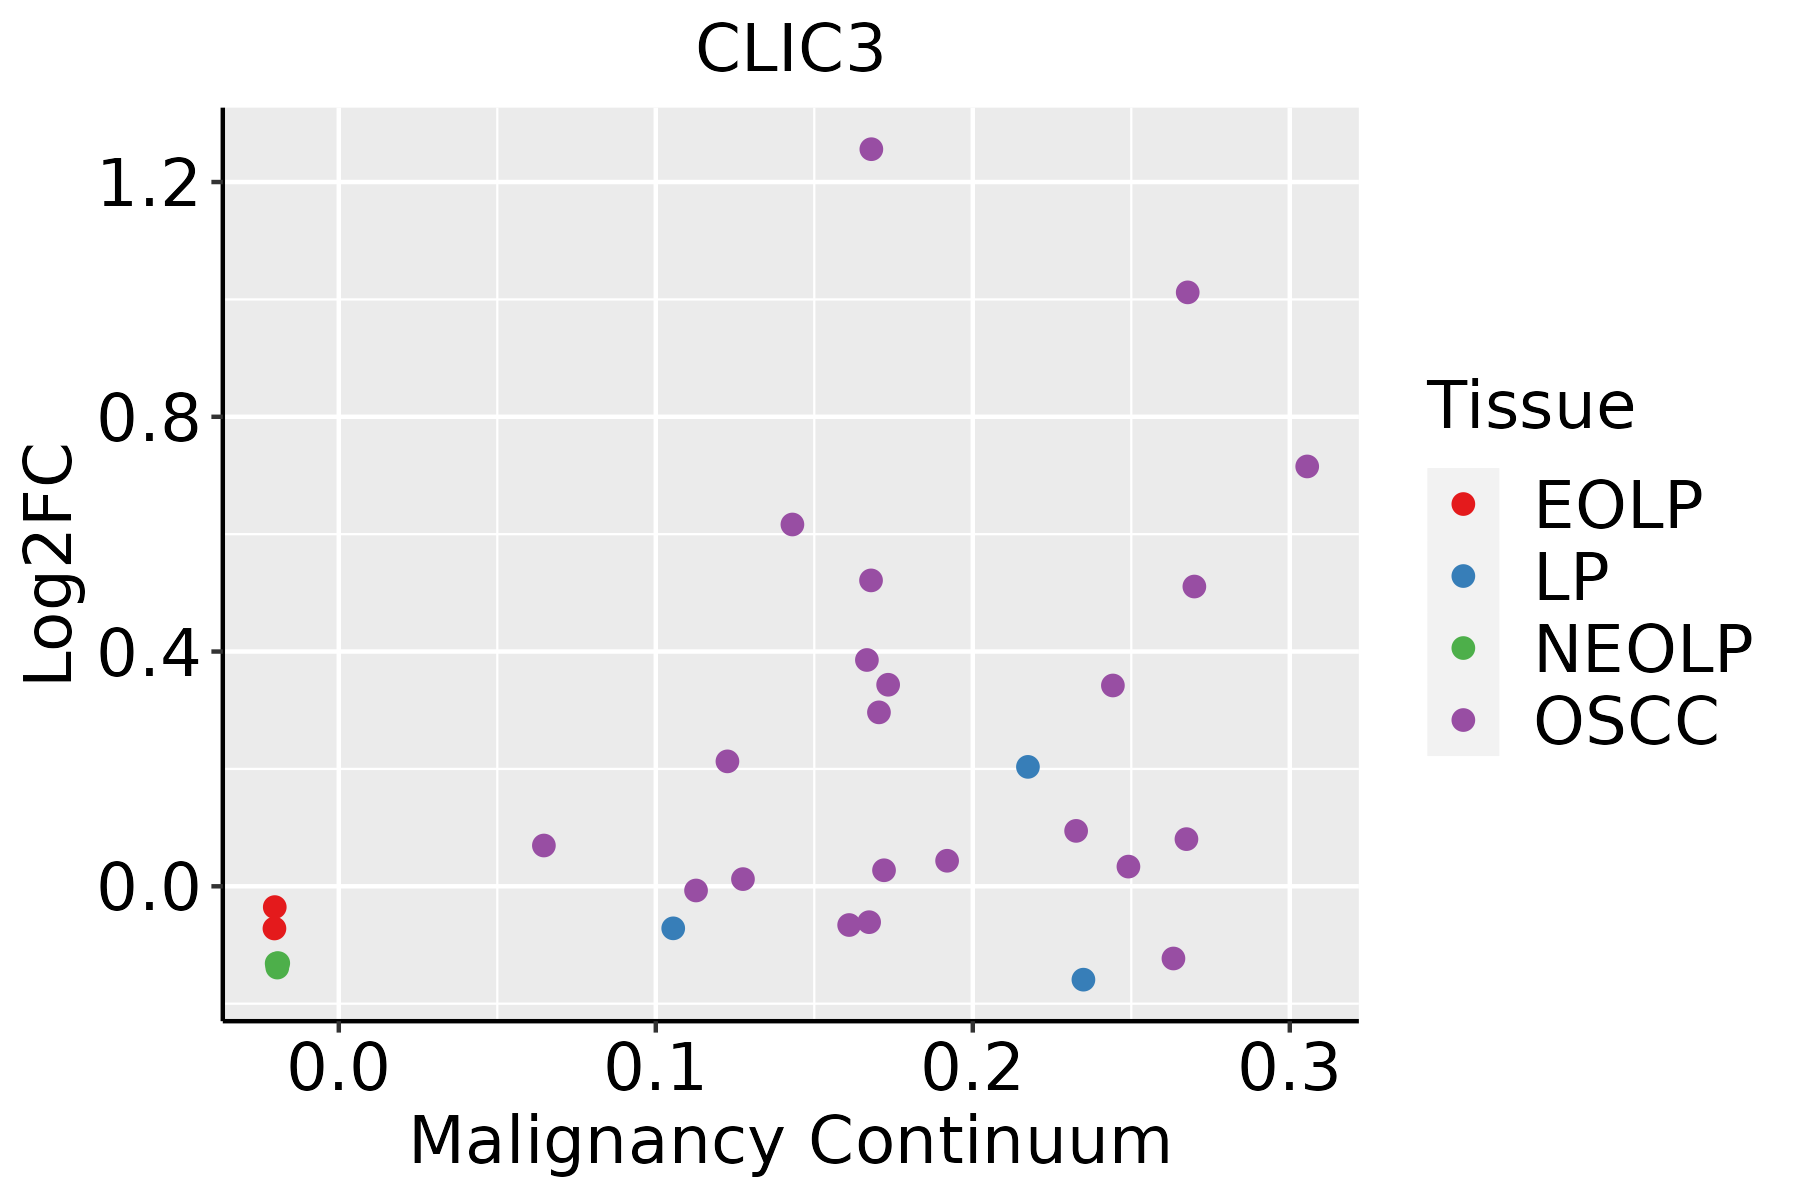 | EOLP: Erosive Oral lichen planus |
| LP: leukoplakia | ||
| NEOLP: Non-erosive oral lichen planus | ||
| OSCC: Oral squamous cell carcinoma | ||
| Thyroid |  | ATC: Anaplastic thyroid cancer |
| HT: Hashimoto's thyroiditis | ||
| PTC: Papillary thyroid cancer |
| ∗log2FC in expression of this searched gene in stem-like cells from each diseased tissue sample relative to stem-like cells in normal samples in each tissue plotted against the malignancy continuum. Samples are colored based on if they are from different disease stage. |
Top |
Malignant transformation related pathway analysis |
| Find out the enriched GO biological processes and KEGG pathways involved in transition from healthy to precancer to cancer |
| Tissue | Disease Stage | Enriched GO biological Processes |
| Colorectum | AD |  |
| Colorectum | SER |  |
| Colorectum | MSS |  |
| Colorectum | MSI-H |  |
| Colorectum | FAP |  |
| ∗Top 15 enriched GO BP terms are showed in the bar plot of each disease state in each tissue. Each row represents a significant GO biological process which is colored according to the -log10(p.adjust). |
| Page: 1 2 3 4 5 6 7 8 9 |
| GO ID | Tissue | Disease Stage | Description | Gene Ratio | Bg Ratio | pvalue | p.adjust | Count |
| GO:00067906 | Esophagus | ESCC | sulfur compound metabolic process | 201/8552 | 339/18723 | 2.64e-07 | 3.94e-06 | 201 |
| GO:00065757 | Esophagus | ESCC | cellular modified amino acid metabolic process | 112/8552 | 188/18723 | 8.31e-05 | 6.06e-04 | 112 |
| GO:000674912 | Esophagus | ESCC | glutathione metabolic process | 42/8552 | 64/18723 | 1.01e-03 | 5.12e-03 | 42 |
| GO:00067905 | Oral cavity | OSCC | sulfur compound metabolic process | 168/7305 | 339/18723 | 4.50e-05 | 3.84e-04 | 168 |
| GO:00065756 | Oral cavity | OSCC | cellular modified amino acid metabolic process | 91/7305 | 188/18723 | 5.33e-03 | 2.07e-02 | 91 |
| GO:0006749 | Stomach | GC | glutathione metabolic process | 13/1159 | 64/18723 | 1.25e-04 | 2.36e-03 | 13 |
| GO:00067903 | Stomach | GC | sulfur compound metabolic process | 35/1159 | 339/18723 | 2.10e-03 | 2.10e-02 | 35 |
| GO:00067491 | Stomach | CAG with IM | glutathione metabolic process | 12/1050 | 64/18723 | 1.99e-04 | 3.74e-03 | 12 |
| GO:00067492 | Stomach | CSG | glutathione metabolic process | 12/1034 | 64/18723 | 1.73e-04 | 3.37e-03 | 12 |
| GO:00065759 | Thyroid | HT | cellular modified amino acid metabolic process | 28/1272 | 188/18723 | 7.21e-05 | 1.31e-03 | 28 |
| GO:00067499 | Thyroid | HT | glutathione metabolic process | 11/1272 | 64/18723 | 3.62e-03 | 2.74e-02 | 11 |
| GO:000657513 | Thyroid | PTC | cellular modified amino acid metabolic process | 85/5968 | 188/18723 | 8.29e-05 | 7.01e-04 | 85 |
| GO:000657522 | Thyroid | ATC | cellular modified amino acid metabolic process | 82/6293 | 188/18723 | 2.60e-03 | 1.20e-02 | 82 |
| Page: 1 |
| Pathway ID | Tissue | Disease Stage | Description | Gene Ratio | Bg Ratio | pvalue | p.adjust | qvalue | Count |
| Page: 1 |
Top |
Cell-cell communication analysis |
| Identification of potential cell-cell interactions between two cell types and their ligand-receptor pairs for different disease states |
| Ligand | Receptor | LRpair | Pathway | Tissue | Disease Stage |
| Page: 1 |
Top |
Single-cell gene regulatory network inference analysis |
| Find out the significant the regulons (TFs) and the target genes of each regulon across cell types for different disease states |
| TF | Cell Type | Tissue | Disease Stage | Target Gene | RSS | Regulon Activity |
| ∗The dot plots of a searched regulon are shown for all cell subpopulations in each disease state of each tissue based on the regulon specific score inferred using pySCENIC and by calculating the average expression. |
| Page: 1 |
Top |
Somatic mutation of malignant transformation related genes |
| Annotation of somatic variants for genes involved in malignant transformation |
| Hugo Symbol | Variant Class | Variant Classification | dbSNP RS | HGVSc | HGVSp | HGVSp Short | SWISSPROT | BIOTYPE | SIFT | PolyPhen | Tumor Sample Barcode | Tissue | Histology | Sex | Age | Stage | Therapy Types | Drugs | Outcome |
| CLIC3 | SNV | Missense_Mutation | novel | c.215N>C | p.Lys72Thr | p.K72T | O95833 | protein_coding | deleterious(0) | probably_damaging(0.933) | TCGA-2W-A8YY-01 | Cervix | cervical & endocervical cancer | Female | <65 | I/II | Chemotherapy | cisplatin | CR |
| CLIC3 | SNV | Missense_Mutation | c.235N>A | p.Glu79Lys | p.E79K | O95833 | protein_coding | deleterious(0) | probably_damaging(0.999) | TCGA-EA-A410-01 | Cervix | cervical & endocervical cancer | Female | <65 | I/II | Unknown | Unknown | SD | |
| CLIC3 | SNV | Missense_Mutation | novel | c.90N>A | p.Met30Ile | p.M30I | O95833 | protein_coding | deleterious(0.02) | benign(0.005) | TCGA-VS-A9UZ-01 | Cervix | cervical & endocervical cancer | Female | <65 | I/II | Unknown | Unknown | SD |
| CLIC3 | SNV | Missense_Mutation | c.176N>A | p.Gly59Asp | p.G59D | O95833 | protein_coding | deleterious(0) | probably_damaging(1) | TCGA-CM-5861-01 | Colorectum | colon adenocarcinoma | Female | <65 | I/II | Unknown | Unknown | PD | |
| CLIC3 | SNV | Missense_Mutation | c.254N>T | p.Thr85Met | p.T85M | O95833 | protein_coding | tolerated(0.11) | benign(0.036) | TCGA-D5-6928-01 | Colorectum | colon adenocarcinoma | Male | >=65 | I/II | Unknown | Unknown | SD | |
| CLIC3 | SNV | Missense_Mutation | c.275N>T | p.Pro92Leu | p.P92L | O95833 | protein_coding | tolerated(0.13) | probably_damaging(0.956) | TCGA-F4-6461-01 | Colorectum | colon adenocarcinoma | Female | <65 | III/IV | Unknown | Unknown | PD | |
| CLIC3 | SNV | Missense_Mutation | c.431C>T | p.Ala144Val | p.A144V | O95833 | protein_coding | deleterious(0.02) | benign(0.003) | TCGA-WS-AB45-01 | Colorectum | colon adenocarcinoma | Female | <65 | I/II | Unknown | Unknown | SD | |
| CLIC3 | SNV | Missense_Mutation | novel | c.109N>A | p.Val37Ile | p.V37I | O95833 | protein_coding | deleterious(0.04) | benign(0.075) | TCGA-AJ-A8CT-01 | Endometrium | uterine corpus endometrioid carcinoma | Female | <65 | I/II | Unknown | Unknown | SD |
| CLIC3 | SNV | Missense_Mutation | c.341N>T | p.Ala114Val | p.A114V | O95833 | protein_coding | deleterious(0.02) | benign(0.007) | TCGA-AP-A059-01 | Endometrium | uterine corpus endometrioid carcinoma | Female | >=65 | I/II | Unknown | Unknown | SD | |
| CLIC3 | SNV | Missense_Mutation | novel | c.578N>T | p.Ala193Val | p.A193V | O95833 | protein_coding | deleterious(0.01) | benign(0) | TCGA-AX-A2HD-01 | Endometrium | uterine corpus endometrioid carcinoma | Female | >=65 | III/IV | Unknown | Unknown | SD |
| Page: 1 2 |
Top |
Related drugs of malignant transformation related genes |
| Identification of chemicals and drugs interact with genes involved in malignant transfromation |
| (DGIdb 4.0) |
| Entrez ID | Symbol | Category | Interaction Types | Drug Claim Name | Drug Name | PMIDs |
| Page: 1 |

Copyright 2023-Present -The University of Texas Health Science Center at Houston |