
|
|||||
|
 | |
| |
| |
| |
| |
| |
|
Gene: CLIC2 |
Gene summary for CLIC2 |
| Gene information | Species | Human | Gene symbol | CLIC2 | Gene ID | 1193 |
| Gene name | chloride intracellular channel 2 | |
| Gene Alias | CLCNL2 | |
| Cytomap | Xq28 | |
| Gene Type | protein-coding | GO ID | GO:0003008 | UniProtAcc | O15247 |
Top |
Malignant transformation analysis |
| Identification of the aberrant gene expression in precancerous and cancerous lesions by comparing the gene expression of stem-like cells in diseased tissues with normal stem cells |
| Entrez ID | Symbol | Replicates | Species | Organ | Tissue | Adj P-value | Log2FC | Malignancy |
| 1193 | CLIC2 | HCC1_Meng | Human | Liver | HCC | 4.07e-28 | 6.92e-02 | 0.0246 |
| 1193 | CLIC2 | HCC2 | Human | Liver | HCC | 9.68e-04 | 2.36e+00 | 0.5341 |
| 1193 | CLIC2 | S016 | Human | Liver | HCC | 2.32e-02 | 1.26e-01 | 0.2243 |
| 1193 | CLIC2 | S027 | Human | Liver | HCC | 6.12e-13 | 1.24e+00 | 0.2446 |
| 1193 | CLIC2 | S028 | Human | Liver | HCC | 1.73e-26 | 1.07e+00 | 0.2503 |
| 1193 | CLIC2 | S029 | Human | Liver | HCC | 3.48e-29 | 1.36e+00 | 0.2581 |
| 1193 | CLIC2 | Adj_PTCwithHT_6 | Human | Thyroid | HT | 3.49e-10 | -5.12e-01 | 0.02 |
| 1193 | CLIC2 | Adj_PTCwithHT_8 | Human | Thyroid | HT | 2.61e-03 | -4.27e-01 | 0.0267 |
| 1193 | CLIC2 | PTCwithHT_6 | Human | Thyroid | HT | 8.77e-03 | -4.49e-01 | 0.02 |
| 1193 | CLIC2 | PTCwithHT_8 | Human | Thyroid | HT | 4.33e-07 | -4.56e-01 | 0.0351 |
| 1193 | CLIC2 | PTCwithoutHT_2 | Human | Thyroid | PTC | 8.51e-07 | -4.69e-01 | 0.0419 |
| 1193 | CLIC2 | male-WTA | Human | Thyroid | PTC | 8.84e-32 | -3.53e-01 | 0.1037 |
| 1193 | CLIC2 | PTC01 | Human | Thyroid | PTC | 9.97e-24 | -3.63e-01 | 0.1899 |
| 1193 | CLIC2 | PTC03 | Human | Thyroid | PTC | 1.23e-04 | -3.10e-01 | 0.1784 |
| 1193 | CLIC2 | PTC04 | Human | Thyroid | PTC | 3.54e-18 | -3.26e-01 | 0.1927 |
| 1193 | CLIC2 | PTC05 | Human | Thyroid | PTC | 2.57e-06 | -1.22e-01 | 0.2065 |
| 1193 | CLIC2 | PTC06 | Human | Thyroid | PTC | 3.14e-17 | -2.67e-01 | 0.2057 |
| 1193 | CLIC2 | PTC07 | Human | Thyroid | PTC | 4.56e-16 | -1.91e-01 | 0.2044 |
| 1193 | CLIC2 | ATC08 | Human | Thyroid | ATC | 3.74e-02 | -4.90e-01 | 0.0541 |
| 1193 | CLIC2 | ATC09 | Human | Thyroid | ATC | 1.31e-02 | -5.09e-01 | 0.2871 |
| Page: 1 2 |
| Tissue | Expression Dynamics | Abbreviation |
| Liver | 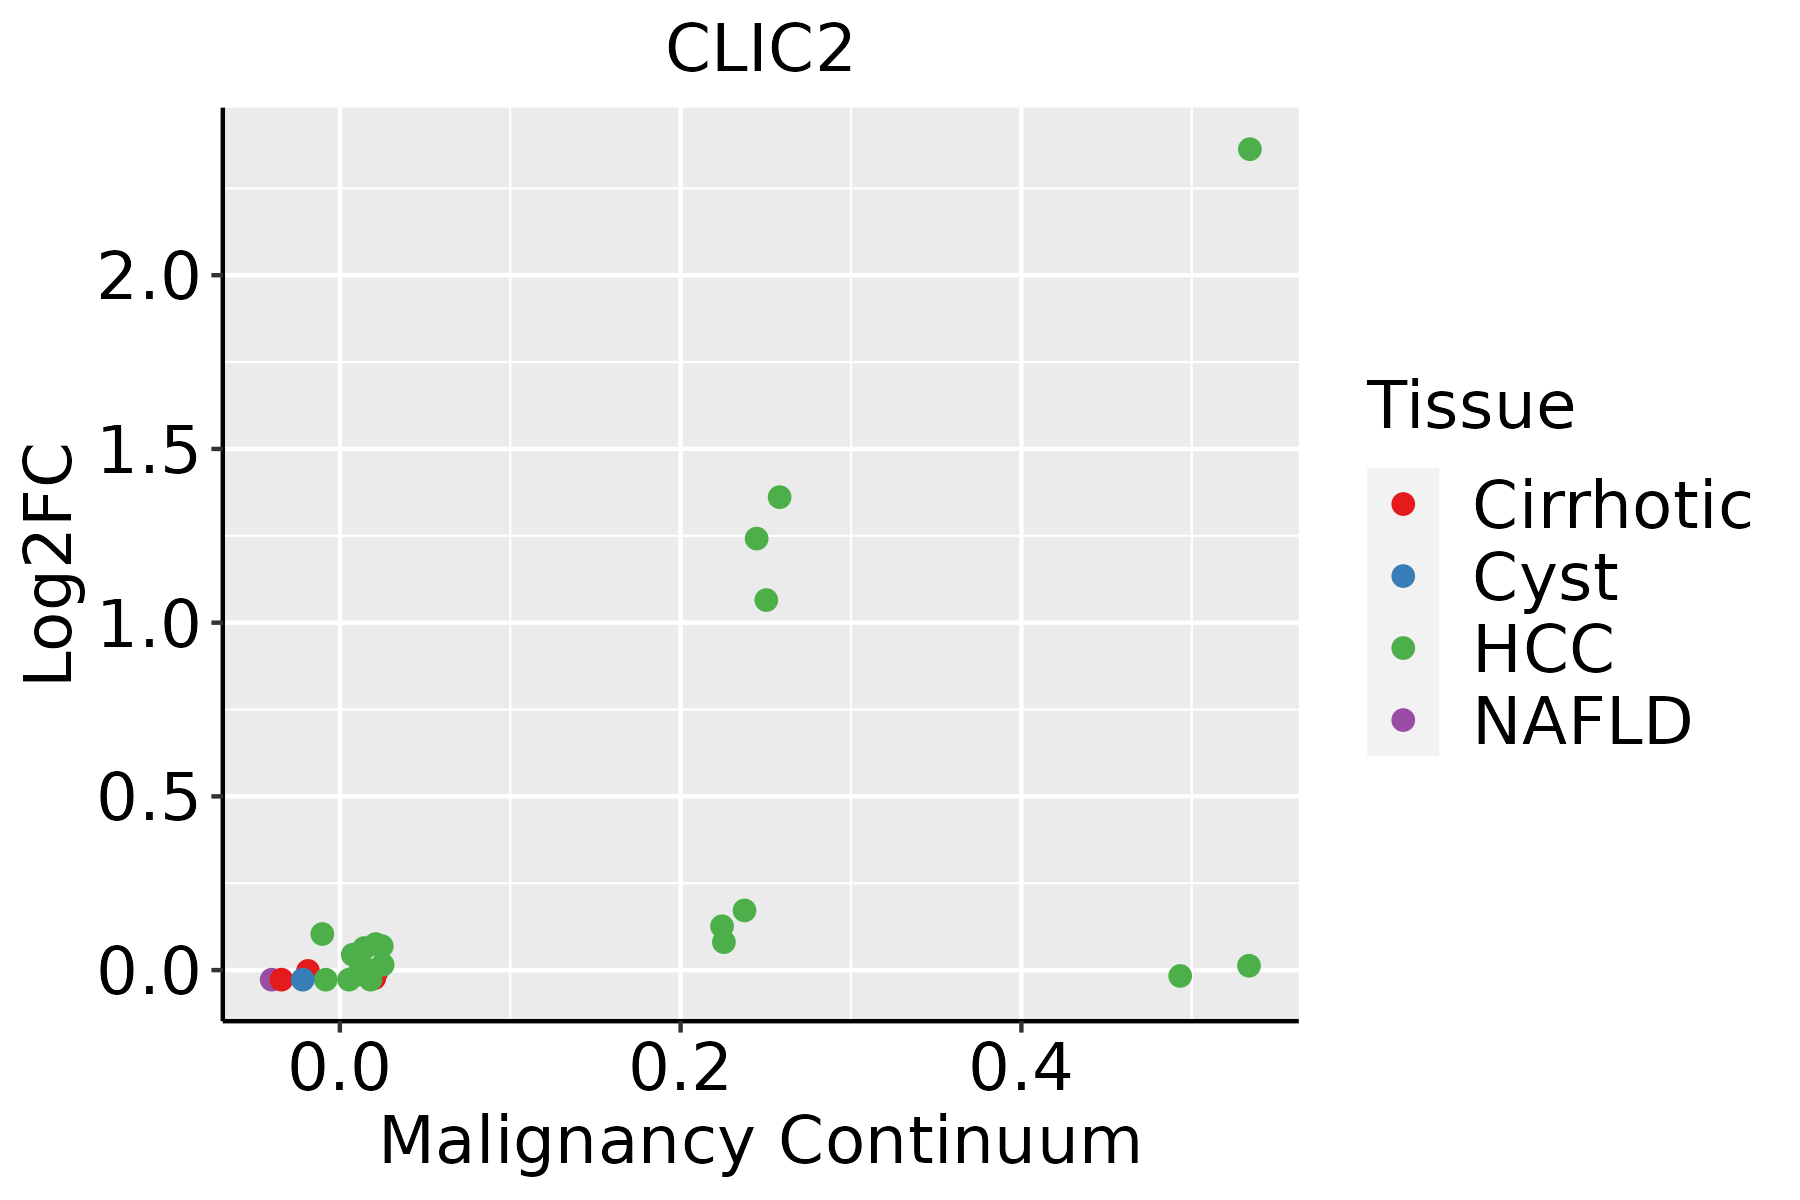 | HCC: Hepatocellular carcinoma |
| NAFLD: Non-alcoholic fatty liver disease | ||
| Thyroid |  | ATC: Anaplastic thyroid cancer |
| HT: Hashimoto's thyroiditis | ||
| PTC: Papillary thyroid cancer |
| ∗log2FC in expression of this searched gene in stem-like cells from each diseased tissue sample relative to stem-like cells in normal samples in each tissue plotted against the malignancy continuum. Samples are colored based on if they are from different disease stage. |
Top |
Malignant transformation related pathway analysis |
| Find out the enriched GO biological processes and KEGG pathways involved in transition from healthy to precancer to cancer |
| Tissue | Disease Stage | Enriched GO biological Processes |
| Colorectum | AD |  |
| Colorectum | SER |  |
| Colorectum | MSS |  |
| Colorectum | MSI-H |  |
| Colorectum | FAP |  |
| ∗Top 15 enriched GO BP terms are showed in the bar plot of each disease state in each tissue. Each row represents a significant GO biological process which is colored according to the -log10(p.adjust). |
| Page: 1 2 3 4 5 6 7 8 9 |
| GO ID | Tissue | Disease Stage | Description | Gene Ratio | Bg Ratio | pvalue | p.adjust | Count |
| GO:005109822 | Liver | HCC | regulation of binding | 225/7958 | 363/18723 | 3.78e-14 | 2.37e-12 | 225 |
| GO:000679021 | Liver | HCC | sulfur compound metabolic process | 212/7958 | 339/18723 | 5.60e-14 | 3.39e-12 | 212 |
| GO:000657521 | Liver | HCC | cellular modified amino acid metabolic process | 119/7958 | 188/18723 | 6.47e-09 | 1.67e-07 | 119 |
| GO:005109922 | Liver | HCC | positive regulation of binding | 108/7958 | 173/18723 | 9.22e-08 | 1.83e-06 | 108 |
| GO:000963622 | Liver | HCC | response to toxic substance | 153/7958 | 262/18723 | 1.37e-07 | 2.58e-06 | 153 |
| GO:005123521 | Liver | HCC | maintenance of location | 185/7958 | 327/18723 | 1.70e-07 | 3.12e-06 | 185 |
| GO:000674911 | Liver | HCC | glutathione metabolic process | 44/7958 | 64/18723 | 1.95e-05 | 2.09e-04 | 44 |
| GO:005165112 | Liver | HCC | maintenance of location in cell | 119/7958 | 214/18723 | 7.11e-05 | 6.39e-04 | 119 |
| GO:199074812 | Liver | HCC | cellular detoxification | 70/7958 | 116/18723 | 7.87e-05 | 7.02e-04 | 70 |
| GO:009723712 | Liver | HCC | cellular response to toxic substance | 74/7958 | 124/18723 | 8.36e-05 | 7.36e-04 | 74 |
| GO:009875412 | Liver | HCC | detoxification | 87/7958 | 152/18723 | 1.70e-04 | 1.35e-03 | 87 |
| GO:009886912 | Liver | HCC | cellular oxidant detoxification | 59/7958 | 101/18723 | 9.00e-04 | 5.31e-03 | 59 |
| GO:0060315 | Liver | HCC | negative regulation of ryanodine-sensitive calcium-release channel activity | 9/7958 | 11/18723 | 9.51e-03 | 3.60e-02 | 9 |
| GO:0010882 | Liver | HCC | regulation of cardiac muscle contraction by calcium ion signaling | 18/7958 | 27/18723 | 9.75e-03 | 3.66e-02 | 18 |
| GO:0010881 | Liver | HCC | regulation of cardiac muscle contraction by regulation of the release of sequestered calcium ion | 15/7958 | 22/18723 | 1.35e-02 | 4.80e-02 | 15 |
| GO:000963627 | Thyroid | HT | response to toxic substance | 50/1272 | 262/18723 | 2.25e-11 | 3.75e-09 | 50 |
| GO:199074827 | Thyroid | HT | cellular detoxification | 31/1272 | 116/18723 | 2.29e-11 | 3.75e-09 | 31 |
| GO:009875420 | Thyroid | HT | detoxification | 36/1272 | 152/18723 | 2.63e-11 | 4.07e-09 | 36 |
| GO:009723727 | Thyroid | HT | cellular response to toxic substance | 32/1272 | 124/18723 | 3.00e-11 | 4.51e-09 | 32 |
| GO:009886926 | Thyroid | HT | cellular oxidant detoxification | 26/1272 | 101/18723 | 2.23e-09 | 2.26e-07 | 26 |
| Page: 1 2 3 |
| Pathway ID | Tissue | Disease Stage | Description | Gene Ratio | Bg Ratio | pvalue | p.adjust | qvalue | Count |
| Page: 1 |
Top |
Cell-cell communication analysis |
| Identification of potential cell-cell interactions between two cell types and their ligand-receptor pairs for different disease states |
| Ligand | Receptor | LRpair | Pathway | Tissue | Disease Stage |
| Page: 1 |
Top |
Single-cell gene regulatory network inference analysis |
| Find out the significant the regulons (TFs) and the target genes of each regulon across cell types for different disease states |
| TF | Cell Type | Tissue | Disease Stage | Target Gene | RSS | Regulon Activity |
| ∗The dot plots of a searched regulon are shown for all cell subpopulations in each disease state of each tissue based on the regulon specific score inferred using pySCENIC and by calculating the average expression. |
| Page: 1 |
Top |
Somatic mutation of malignant transformation related genes |
| Annotation of somatic variants for genes involved in malignant transformation |
| Hugo Symbol | Variant Class | Variant Classification | dbSNP RS | HGVSc | HGVSp | HGVSp Short | SWISSPROT | BIOTYPE | SIFT | PolyPhen | Tumor Sample Barcode | Tissue | Histology | Sex | Age | Stage | Therapy Types | Drugs | Outcome |
| CLIC2 | SNV | Missense_Mutation | c.58G>A | p.Ala20Thr | p.A20T | O15247 | protein_coding | deleterious(0) | probably_damaging(0.997) | TCGA-AO-A03T-01 | Breast | breast invasive carcinoma | Female | <65 | I/II | Chemotherapy | cyclophosphamide | SD | |
| CLIC2 | SNV | Missense_Mutation | rs782061657 | c.19N>A | p.Gly7Ser | p.G7S | O15247 | protein_coding | tolerated(0.27) | benign(0) | TCGA-D8-A1J8-01 | Breast | breast invasive carcinoma | Female | >=65 | I/II | Hormone Therapy | nolvadex | SD |
| CLIC2 | SNV | Missense_Mutation | c.418N>T | p.Leu140Phe | p.L140F | O15247 | protein_coding | deleterious(0.01) | probably_damaging(0.998) | TCGA-AA-3510-01 | Colorectum | colon adenocarcinoma | Male | >=65 | I/II | Unknown | Unknown | SD | |
| CLIC2 | SNV | Missense_Mutation | rs782270791 | c.212C>T | p.Pro71Leu | p.P71L | O15247 | protein_coding | deleterious(0) | probably_damaging(1) | TCGA-F4-6570-01 | Colorectum | colon adenocarcinoma | Female | >=65 | I/II | Unknown | Unknown | SD |
| CLIC2 | SNV | Missense_Mutation | c.278N>G | p.Thr93Ser | p.T93S | O15247 | protein_coding | tolerated(0.12) | benign(0.035) | TCGA-AG-A036-01 | Colorectum | rectum adenocarcinoma | Male | >=65 | III/IV | Chemotherapy | 5-fluorouracil | CR | |
| CLIC2 | SNV | Missense_Mutation | rs781997025 | c.519C>A | p.Phe173Leu | p.F173L | O15247 | protein_coding | deleterious(0) | possibly_damaging(0.495) | TCGA-EI-6917-01 | Colorectum | rectum adenocarcinoma | Male | <65 | III/IV | Chemotherapy | 5fluorouracil+oxaciplatina+l-folinian | SD |
| CLIC2 | SNV | Missense_Mutation | rs191446056 | c.13C>T | p.Arg5Trp | p.R5W | O15247 | protein_coding | deleterious(0) | benign(0.185) | TCGA-EI-6917-01 | Colorectum | rectum adenocarcinoma | Male | <65 | III/IV | Chemotherapy | 5fluorouracil+oxaciplatina+l-folinian | SD |
| CLIC2 | SNV | Missense_Mutation | novel | c.51N>G | p.Phe17Leu | p.F17L | O15247 | protein_coding | deleterious(0.05) | benign(0.027) | TCGA-F5-6814-01 | Colorectum | rectum adenocarcinoma | Male | <65 | I/II | Unknown | Unknown | SD |
| CLIC2 | SNV | Missense_Mutation | novel | c.86N>G | p.Asn29Ser | p.N29S | O15247 | protein_coding | deleterious(0.03) | benign(0.006) | TCGA-A5-A0GG-01 | Endometrium | uterine corpus endometrioid carcinoma | Female | >=65 | I/II | Unknown | Unknown | SD |
| CLIC2 | SNV | Missense_Mutation | rs781997025 | c.519N>A | p.Phe173Leu | p.F173L | O15247 | protein_coding | deleterious(0) | possibly_damaging(0.495) | TCGA-A5-A2K5-01 | Endometrium | uterine corpus endometrioid carcinoma | Female | >=65 | I/II | Unknown | Unknown | SD |
| Page: 1 2 3 4 |
Top |
Related drugs of malignant transformation related genes |
| Identification of chemicals and drugs interact with genes involved in malignant transfromation |
| (DGIdb 4.0) |
| Entrez ID | Symbol | Category | Interaction Types | Drug Claim Name | Drug Name | PMIDs |
| Page: 1 |

Copyright 2023-Present -The University of Texas Health Science Center at Houston |