| Tissue | Expression Dynamics | Abbreviation |
| Breast | 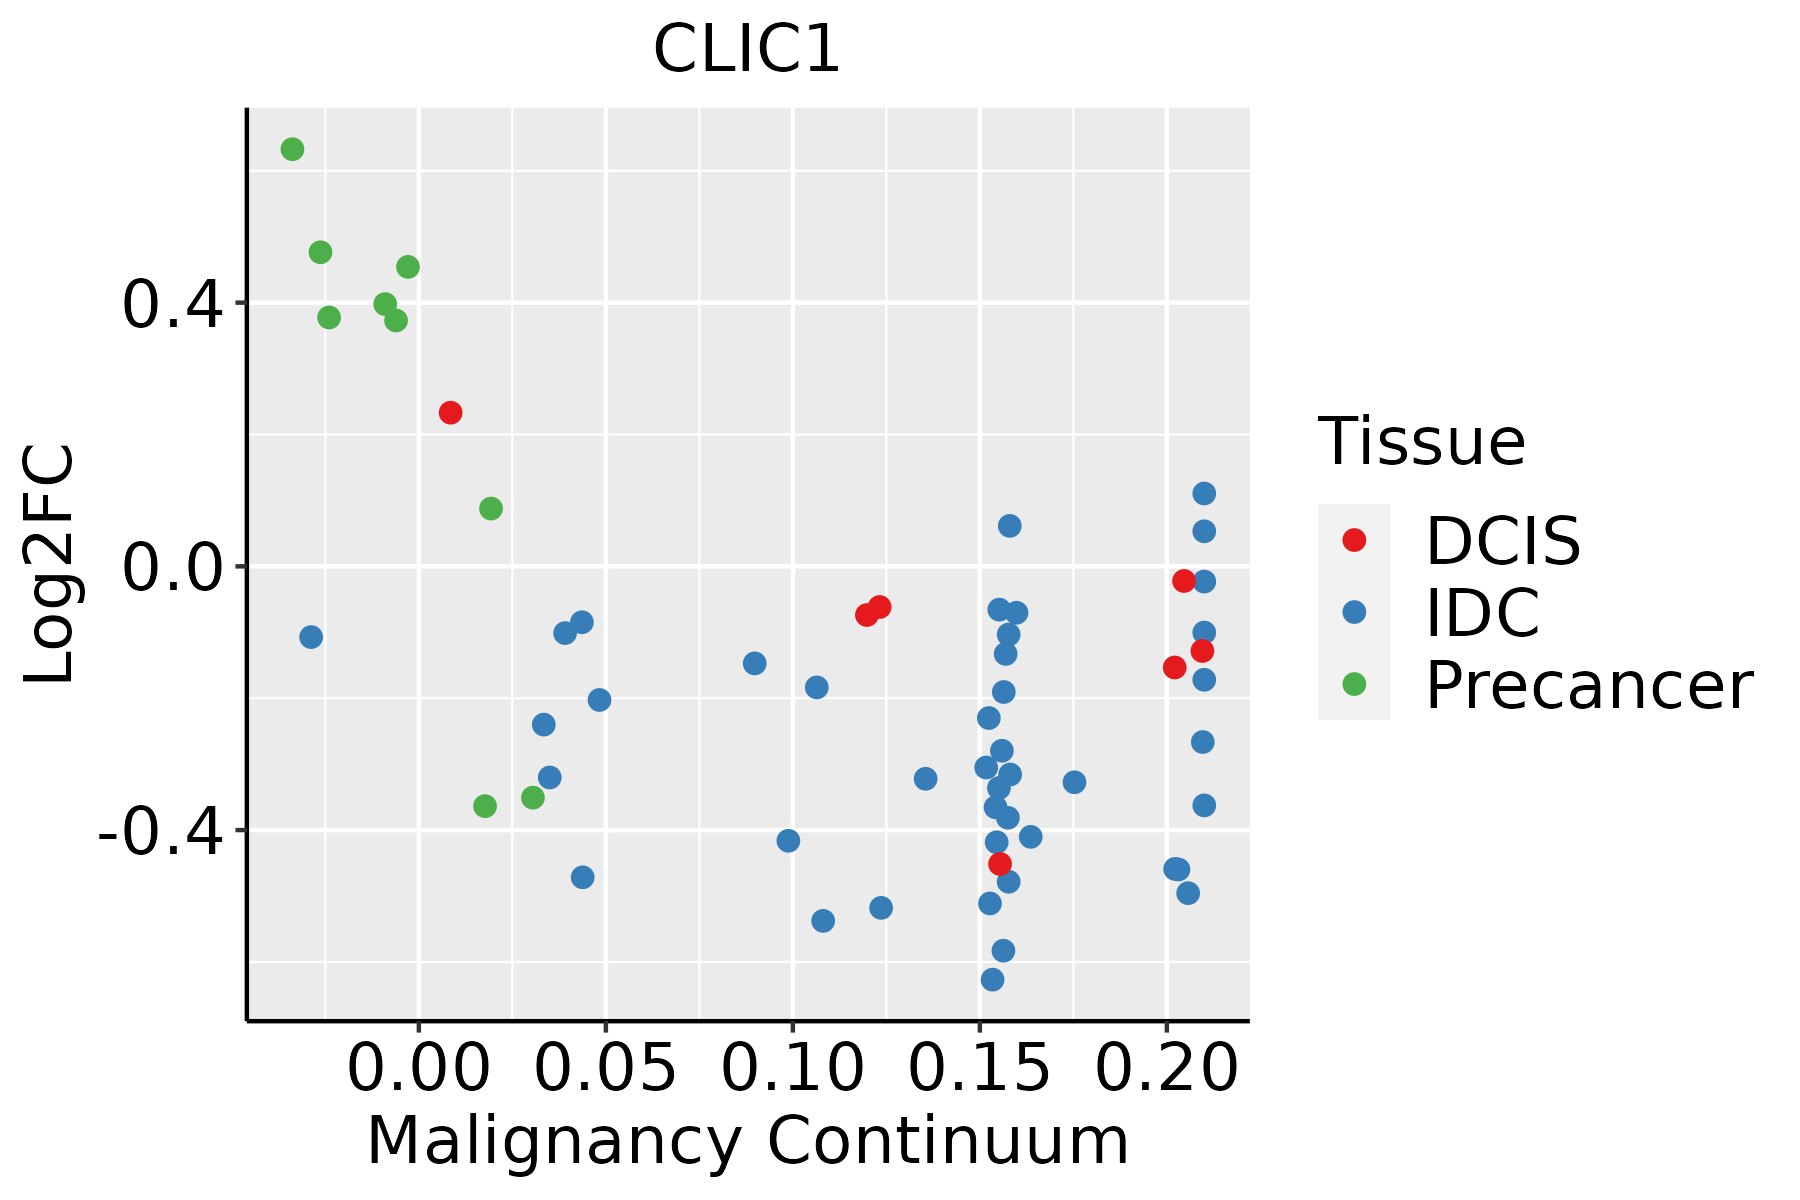 | IDC: Invasive ductal carcinoma |
| DCIS: Ductal carcinoma in situ |
| Precancer(BRCA1-mut): Precancerous lesion from BRCA1 mutation carriers |
| Cervix | 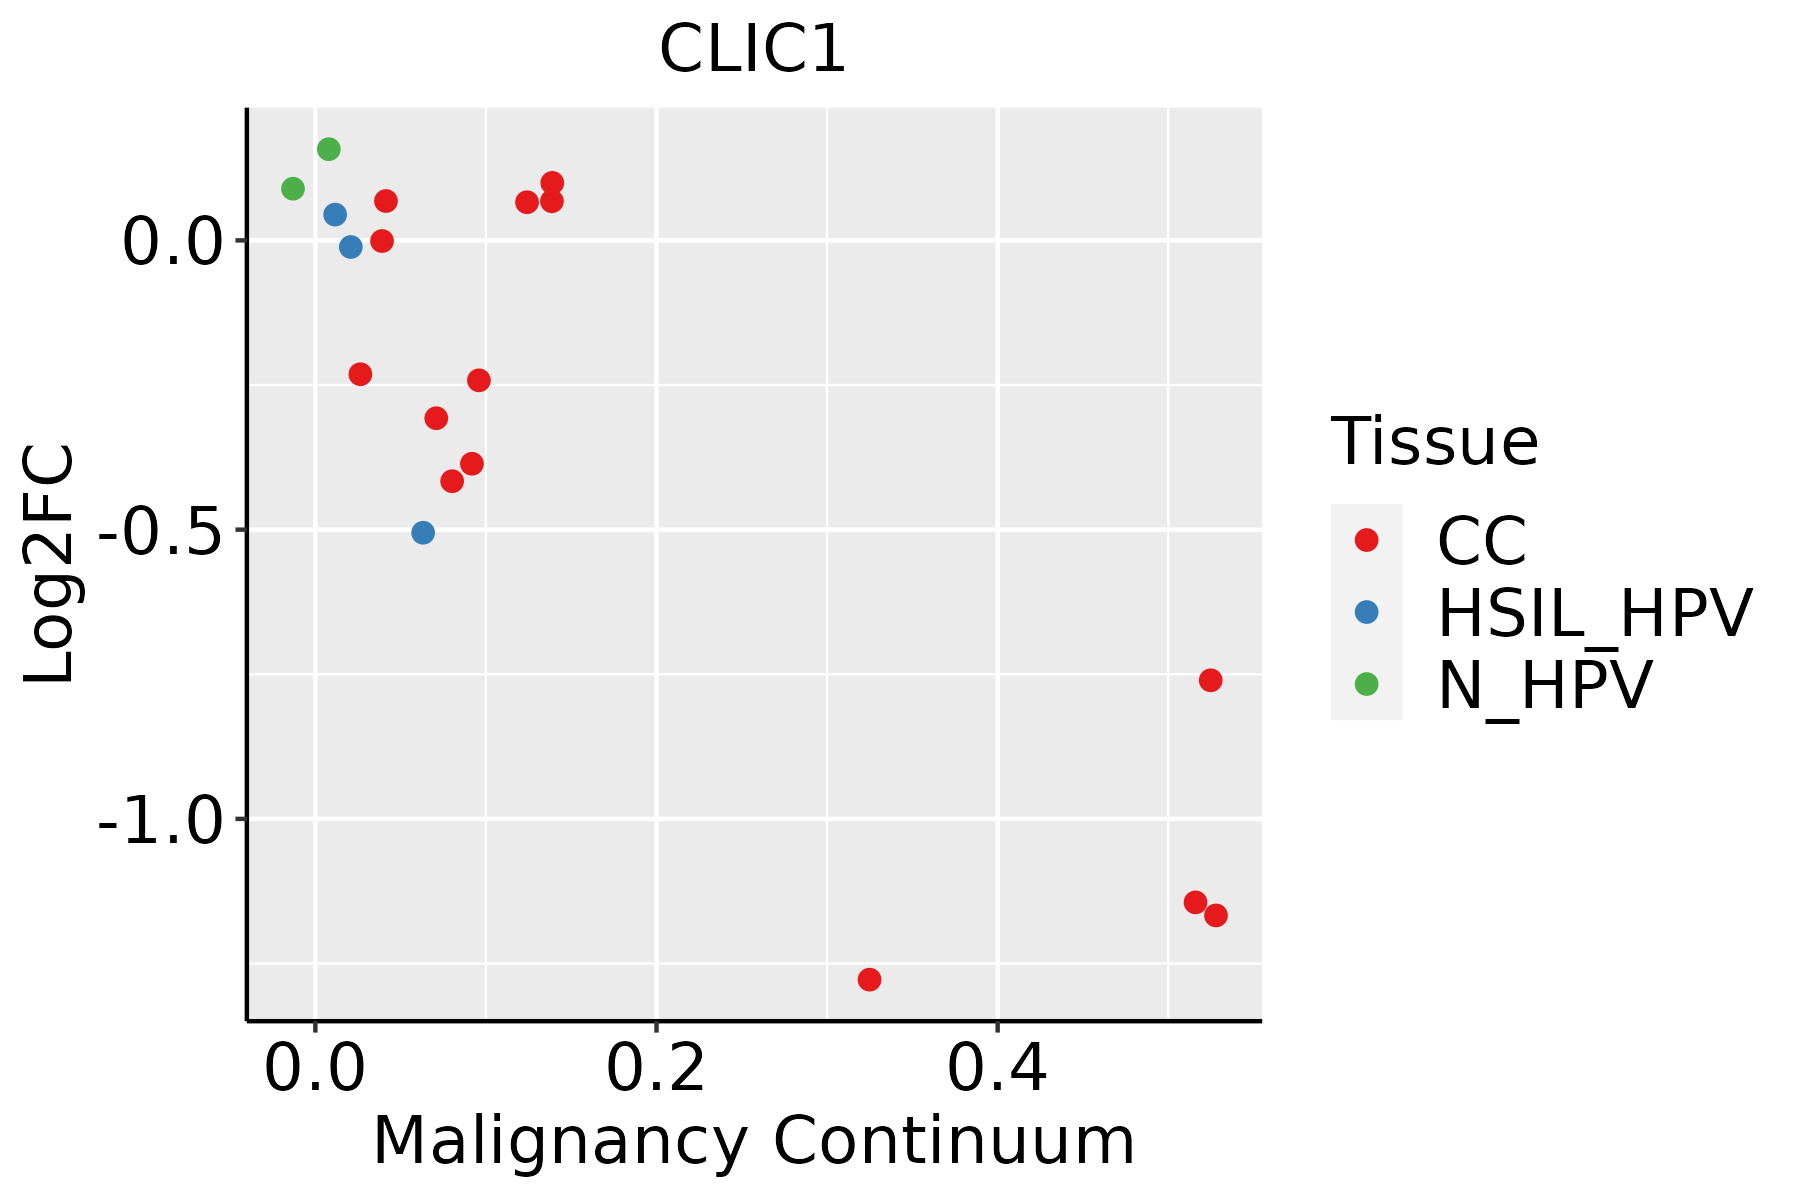 | CC: Cervix cancer |
| HSIL_HPV: HPV-infected high-grade squamous intraepithelial lesions |
| N_HPV: HPV-infected normal cervix |
| Colorectum (GSE201348) |  | FAP: Familial adenomatous polyposis |
| CRC: Colorectal cancer |
| Colorectum (HTA11) |  | AD: Adenomas |
| SER: Sessile serrated lesions |
| MSI-H: Microsatellite-high colorectal cancer |
| MSS: Microsatellite stable colorectal cancer |
| Endometrium | 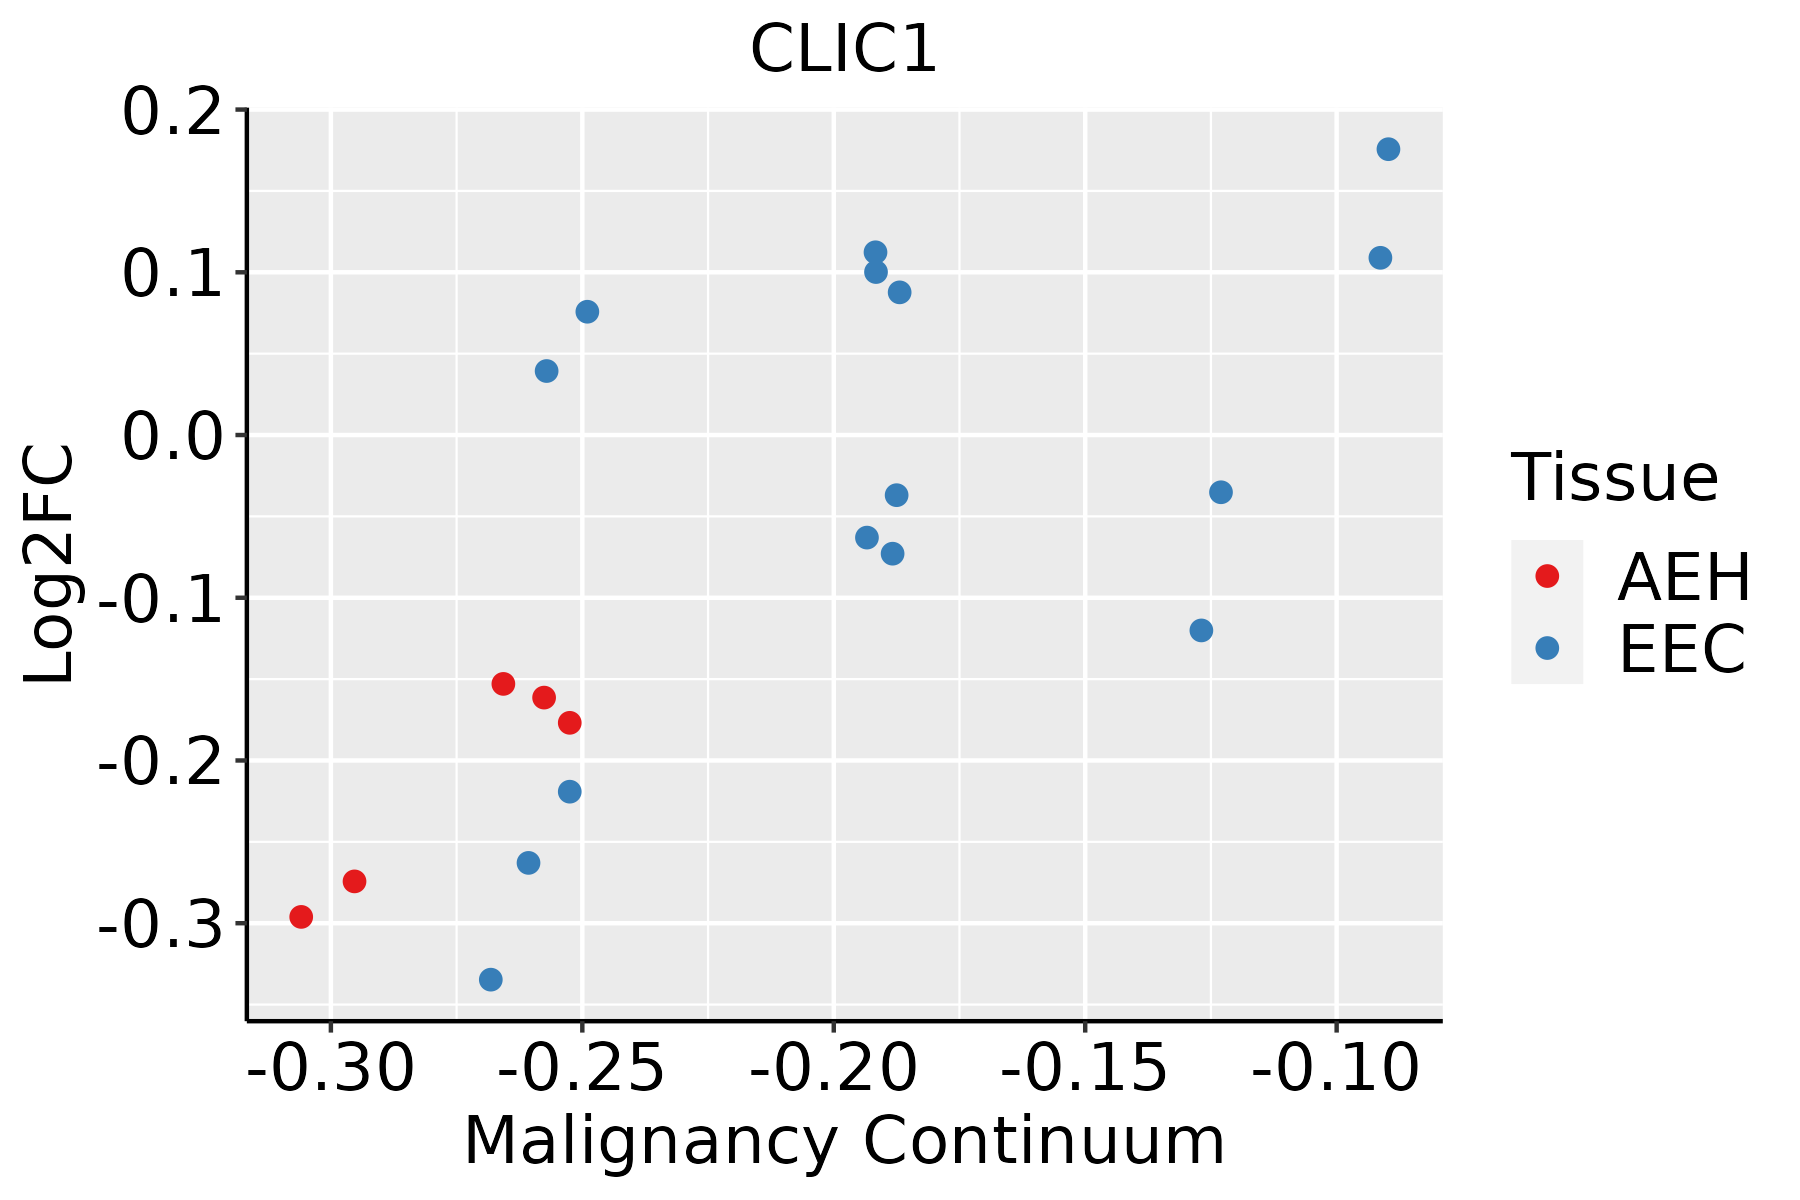 | AEH: Atypical endometrial hyperplasia |
| EEC: Endometrioid Cancer |
| Esophagus | 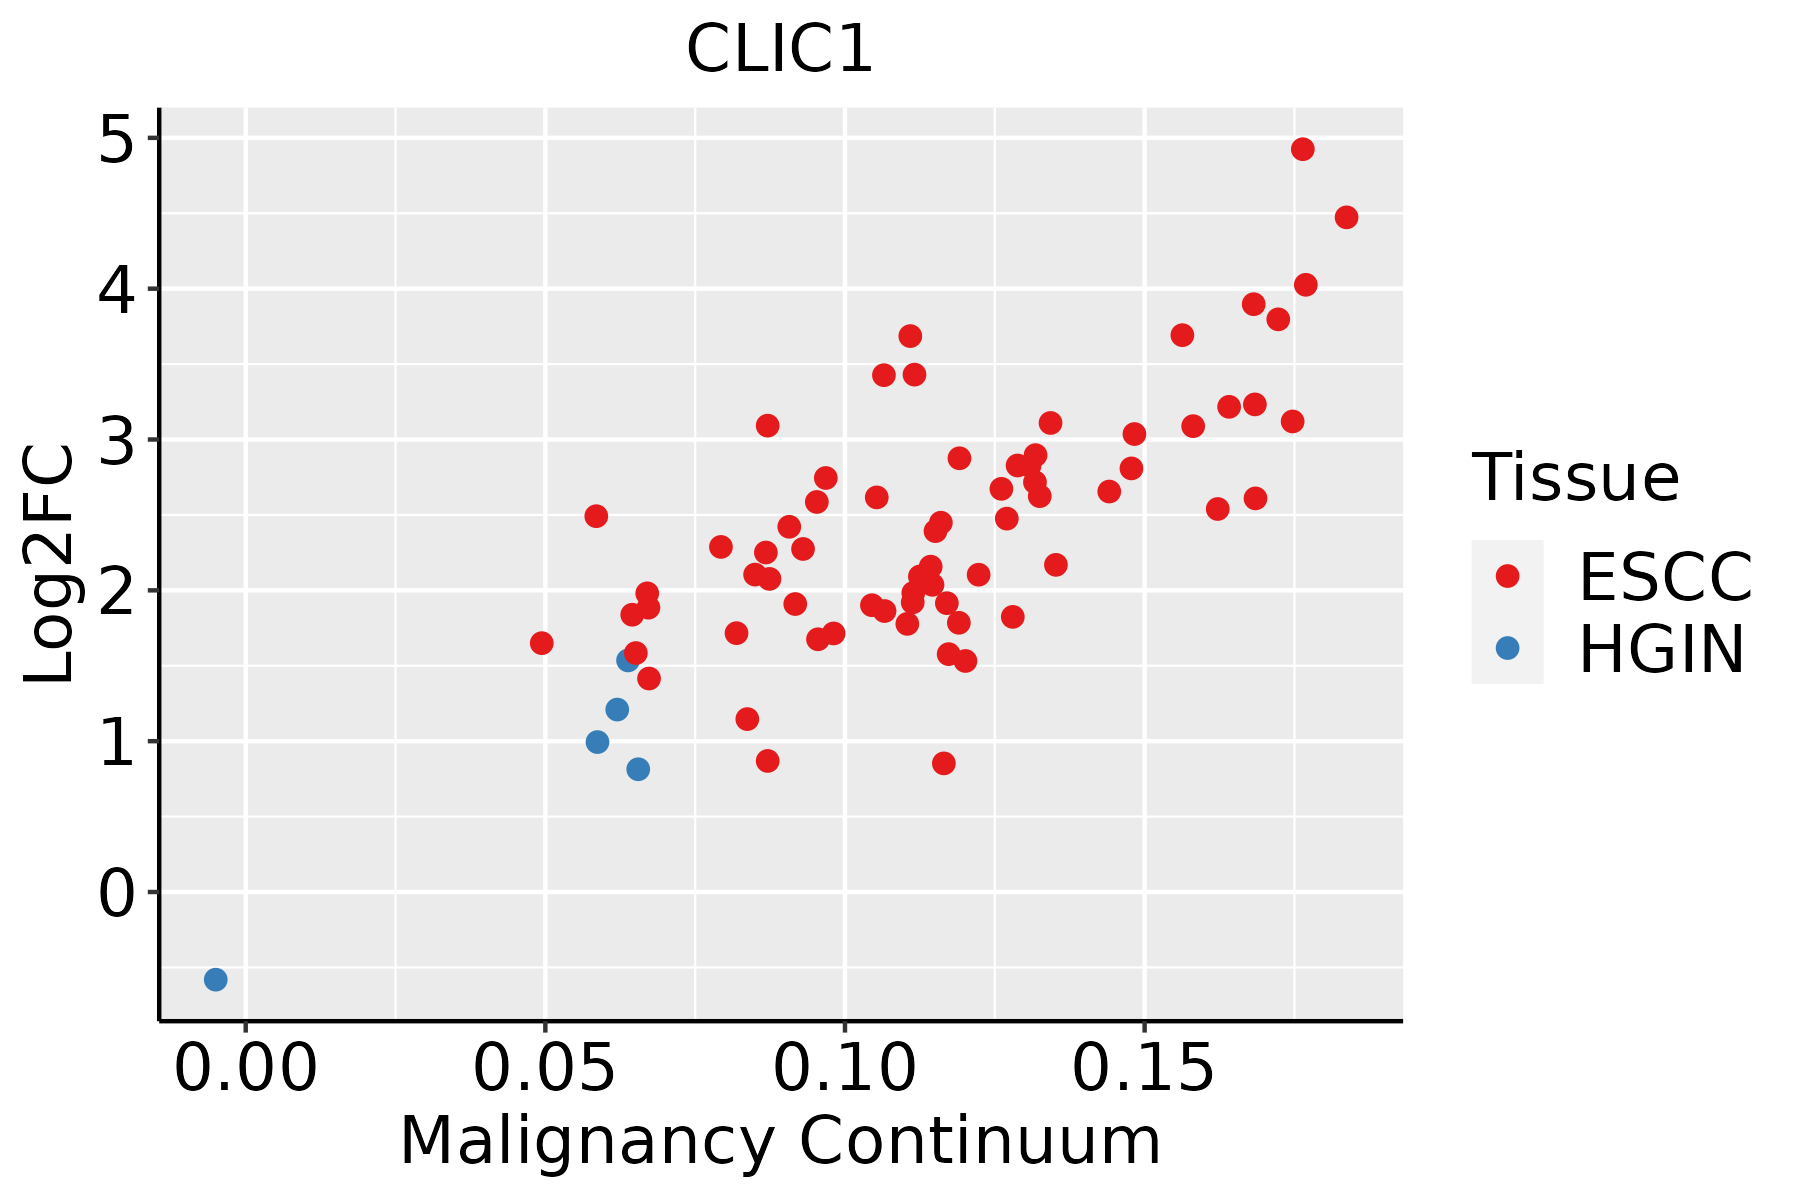 | ESCC: Esophageal squamous cell carcinoma |
| HGIN: High-grade intraepithelial neoplasias |
| LGIN: Low-grade intraepithelial neoplasias |
| GC |  | CAG: Chronic atrophic gastritis |
| CAG with IM: Chronic atrophic gastritis with intestinal metaplasia |
| CSG: Chronic superficial gastritis |
| GC: Gastric cancer |
| SIM: Severe intestinal metaplasia |
| WIM: Wild intestinal metaplasia |
| Liver |  | HCC: Hepatocellular carcinoma |
| NAFLD: Non-alcoholic fatty liver disease |
| Oral Cavity |  | EOLP: Erosive Oral lichen planus |
| LP: leukoplakia |
| NEOLP: Non-erosive oral lichen planus |
| OSCC: Oral squamous cell carcinoma |
| Prostate |  | BPH: Benign Prostatic Hyperplasia |
| Skin |  | AK: Actinic keratosis |
| cSCC: Cutaneous squamous cell carcinoma |
| SCCIS:squamous cell carcinoma in situ |
| Thyroid |  | ATC: Anaplastic thyroid cancer |
| HT: Hashimoto's thyroiditis |
| PTC: Papillary thyroid cancer |
| GO ID | Tissue | Disease Stage | Description | Gene Ratio | Bg Ratio | pvalue | p.adjust | Count |
| GO:00518816 | Breast | Precancer | regulation of mitochondrial membrane potential | 18/1080 | 74/18723 | 1.45e-07 | 7.82e-06 | 18 |
| GO:00341099 | Breast | Precancer | homotypic cell-cell adhesion | 18/1080 | 90/18723 | 3.15e-06 | 1.03e-04 | 18 |
| GO:00420609 | Breast | Precancer | wound healing | 48/1080 | 422/18723 | 5.48e-06 | 1.63e-04 | 48 |
| GO:00508789 | Breast | Precancer | regulation of body fluid levels | 40/1080 | 379/18723 | 1.68e-04 | 2.77e-03 | 40 |
| GO:00016496 | Breast | Precancer | osteoblast differentiation | 27/1080 | 229/18723 | 3.35e-04 | 4.73e-03 | 27 |
| GO:00705278 | Breast | Precancer | platelet aggregation | 12/1080 | 67/18723 | 4.02e-04 | 5.43e-03 | 12 |
| GO:00075995 | Breast | Precancer | hemostasis | 24/1080 | 222/18723 | 2.31e-03 | 2.15e-02 | 24 |
| GO:00075965 | Breast | Precancer | blood coagulation | 23/1080 | 217/18723 | 3.61e-03 | 2.98e-02 | 23 |
| GO:00508175 | Breast | Precancer | coagulation | 23/1080 | 222/18723 | 4.78e-03 | 3.64e-02 | 23 |
| GO:0030168 | Breast | Precancer | platelet activation | 15/1080 | 123/18723 | 4.80e-03 | 3.64e-02 | 15 |
| GO:00015036 | Breast | Precancer | ossification | 36/1080 | 408/18723 | 7.53e-03 | 4.98e-02 | 36 |
| GO:005188113 | Breast | IDC | regulation of mitochondrial membrane potential | 19/1434 | 74/18723 | 2.04e-06 | 8.27e-05 | 19 |
| GO:003410913 | Breast | IDC | homotypic cell-cell adhesion | 20/1434 | 90/18723 | 1.20e-05 | 3.17e-04 | 20 |
| GO:000164912 | Breast | IDC | osteoblast differentiation | 35/1434 | 229/18723 | 6.64e-05 | 1.35e-03 | 35 |
| GO:004206014 | Breast | IDC | wound healing | 55/1434 | 422/18723 | 7.27e-05 | 1.45e-03 | 55 |
| GO:005087813 | Breast | IDC | regulation of body fluid levels | 50/1434 | 379/18723 | 1.12e-04 | 2.10e-03 | 50 |
| GO:000150311 | Breast | IDC | ossification | 50/1434 | 408/18723 | 6.51e-04 | 8.04e-03 | 50 |
| GO:00423912 | Breast | IDC | regulation of membrane potential | 49/1434 | 434/18723 | 4.04e-03 | 3.25e-02 | 49 |
| GO:007052713 | Breast | IDC | platelet aggregation | 12/1434 | 67/18723 | 4.53e-03 | 3.49e-02 | 12 |
| GO:005188122 | Breast | DCIS | regulation of mitochondrial membrane potential | 19/1390 | 74/18723 | 1.28e-06 | 4.99e-05 | 19 |
| Hugo Symbol | Variant Class | Variant Classification | dbSNP RS | HGVSc | HGVSp | HGVSp Short | SWISSPROT | BIOTYPE | SIFT | PolyPhen | Tumor Sample Barcode | Tissue | Histology | Sex | Age | Stage | Therapy Types | Drugs | Outcome |
| CLIC1 | SNV | Missense_Mutation | | c.123N>A | p.Phe41Leu | p.F41L | O00299 | protein_coding | deleterious(0.02) | probably_damaging(0.996) | TCGA-A8-A09G-01 | Breast | breast invasive carcinoma | Female | >=65 | III/IV | Unknown | Unknown | SD |
| CLIC1 | SNV | Missense_Mutation | novel | c.484G>A | p.Val162Ile | p.V162I | O00299 | protein_coding | tolerated(0.49) | benign(0) | TCGA-E2-A150-01 | Breast | breast invasive carcinoma | Female | <65 | I/II | Chemotherapy | doxorubicin | SD |
| CLIC1 | SNV | Missense_Mutation | | c.667T>C | p.Cys223Arg | p.C223R | O00299 | protein_coding | deleterious(0) | possibly_damaging(0.624) | TCGA-CM-6674-01 | Colorectum | colon adenocarcinoma | Male | <65 | I/II | Unknown | Unknown | SD |
| CLIC1 | SNV | Missense_Mutation | novel | c.39N>T | p.Lys13Asn | p.K13N | O00299 | protein_coding | deleterious(0) | possibly_damaging(0.55) | TCGA-A5-A0G2-01 | Endometrium | uterine corpus endometrioid carcinoma | Female | <65 | III/IV | Unknown | Unknown | SD |
| CLIC1 | SNV | Missense_Mutation | | c.226G>A | p.Asp76Asn | p.D76N | O00299 | protein_coding | deleterious(0.01) | probably_damaging(0.998) | TCGA-AP-A054-01 | Endometrium | uterine corpus endometrioid carcinoma | Female | <65 | III/IV | Chemotherapy | carboplatin | PD |
| CLIC1 | SNV | Missense_Mutation | rs570496971 | c.100C>A | p.Leu34Met | p.L34M | O00299 | protein_coding | deleterious(0) | probably_damaging(0.999) | TCGA-AP-A059-01 | Endometrium | uterine corpus endometrioid carcinoma | Female | >=65 | I/II | Unknown | Unknown | SD |
| CLIC1 | SNV | Missense_Mutation | novel | c.623G>A | p.Arg208Gln | p.R208Q | O00299 | protein_coding | tolerated(0.06) | benign(0.015) | TCGA-AP-A1DR-01 | Endometrium | uterine corpus endometrioid carcinoma | Female | <65 | III/IV | Chemotherapy | cisplatin | SD |
| CLIC1 | SNV | Missense_Mutation | novel | c.619N>T | p.His207Tyr | p.H207Y | O00299 | protein_coding | tolerated(0.11) | benign(0.075) | TCGA-AX-A1CE-01 | Endometrium | uterine corpus endometrioid carcinoma | Female | <65 | I/II | Unspecific | Paclitaxel | SD |
| CLIC1 | SNV | Missense_Mutation | novel | c.583N>T | p.Arg195Trp | p.R195W | O00299 | protein_coding | deleterious(0.04) | benign(0.009) | TCGA-AX-A2HD-01 | Endometrium | uterine corpus endometrioid carcinoma | Female | >=65 | III/IV | Unknown | Unknown | SD |
| CLIC1 | SNV | Missense_Mutation | novel | c.475N>A | p.Asp159Asn | p.D159N | O00299 | protein_coding | tolerated(0.25) | benign(0.028) | TCGA-B5-A3FC-01 | Endometrium | uterine corpus endometrioid carcinoma | Female | <65 | I/II | Unknown | Unknown | SD |


