
|
|||||
|
 | |
| |
| |
| |
| |
| |
|
Gene: CLEC7A |
Gene summary for CLEC7A |
| Gene information | Species | Human | Gene symbol | CLEC7A | Gene ID | 64581 |
| Gene name | C-type lectin domain containing 7A | |
| Gene Alias | BGR | |
| Cytomap | 12p13.2 | |
| Gene Type | protein-coding | GO ID | GO:0000165 | UniProtAcc | Q68D78 |
Top |
Malignant transformation analysis |
| Identification of the aberrant gene expression in precancerous and cancerous lesions by comparing the gene expression of stem-like cells in diseased tissues with normal stem cells |
| Entrez ID | Symbol | Replicates | Species | Organ | Tissue | Adj P-value | Log2FC | Malignancy |
| 64581 | CLEC7A | P1T-E | Human | Esophagus | ESCC | 6.11e-03 | 1.28e-01 | 0.0875 |
| 64581 | CLEC7A | P4T-E | Human | Esophagus | ESCC | 3.02e-03 | 2.23e-01 | 0.1323 |
| 64581 | CLEC7A | P20T-E | Human | Esophagus | ESCC | 9.46e-06 | 7.73e-02 | 0.1124 |
| 64581 | CLEC7A | P22T-E | Human | Esophagus | ESCC | 4.60e-53 | 1.30e+00 | 0.1236 |
| 64581 | CLEC7A | P23T-E | Human | Esophagus | ESCC | 3.86e-05 | 3.25e-01 | 0.108 |
| 64581 | CLEC7A | P24T-E | Human | Esophagus | ESCC | 1.14e-02 | 2.64e-01 | 0.1287 |
| 64581 | CLEC7A | P31T-E | Human | Esophagus | ESCC | 2.17e-10 | 2.59e-01 | 0.1251 |
| 64581 | CLEC7A | P40T-E | Human | Esophagus | ESCC | 7.29e-06 | 3.33e-01 | 0.109 |
| 64581 | CLEC7A | P42T-E | Human | Esophagus | ESCC | 4.81e-02 | 2.86e-01 | 0.1175 |
| 64581 | CLEC7A | P61T-E | Human | Esophagus | ESCC | 8.51e-03 | 1.16e-02 | 0.099 |
| 64581 | CLEC7A | P62T-E | Human | Esophagus | ESCC | 3.09e-27 | 7.61e-01 | 0.1302 |
| 64581 | CLEC7A | P65T-E | Human | Esophagus | ESCC | 4.46e-06 | 1.57e-01 | 0.0978 |
| 64581 | CLEC7A | P80T-E | Human | Esophagus | ESCC | 3.23e-08 | 5.53e-01 | 0.155 |
| 64581 | CLEC7A | P107T-E | Human | Esophagus | ESCC | 1.87e-25 | 8.29e-01 | 0.171 |
| 64581 | CLEC7A | P126T-E | Human | Esophagus | ESCC | 1.51e-02 | 4.51e-01 | 0.1125 |
| 64581 | CLEC7A | P127T-E | Human | Esophagus | ESCC | 1.69e-06 | 1.47e-01 | 0.0826 |
| 64581 | CLEC7A | P130T-E | Human | Esophagus | ESCC | 2.89e-57 | 1.24e+00 | 0.1676 |
| 64581 | CLEC7A | C04 | Human | Oral cavity | OSCC | 6.79e-09 | 5.67e-01 | 0.2633 |
| 64581 | CLEC7A | C30 | Human | Oral cavity | OSCC | 2.16e-12 | 8.04e-01 | 0.3055 |
| 64581 | CLEC7A | C38 | Human | Oral cavity | OSCC | 3.06e-04 | 7.83e-01 | 0.172 |
| Page: 1 2 |
| Tissue | Expression Dynamics | Abbreviation |
| Esophagus | 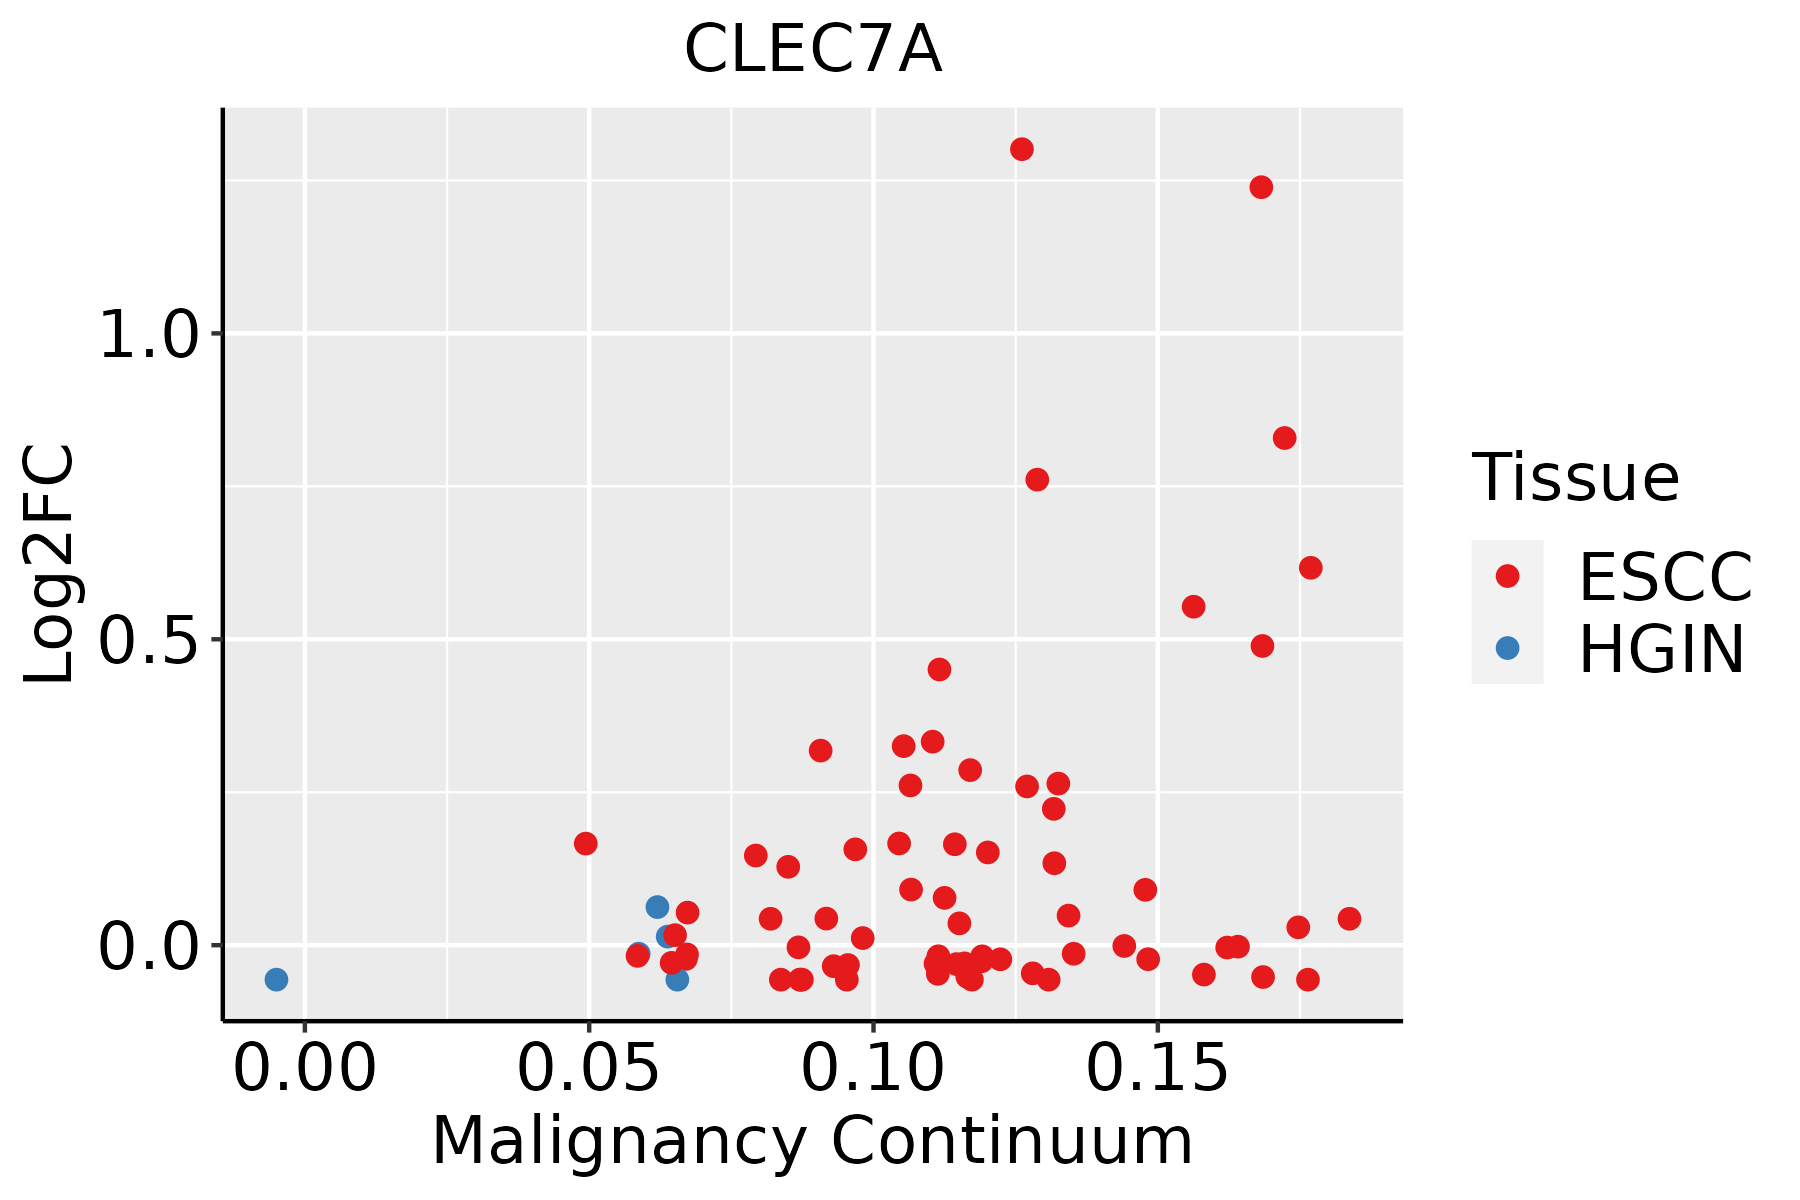 | ESCC: Esophageal squamous cell carcinoma |
| HGIN: High-grade intraepithelial neoplasias | ||
| LGIN: Low-grade intraepithelial neoplasias | ||
| Oral Cavity | 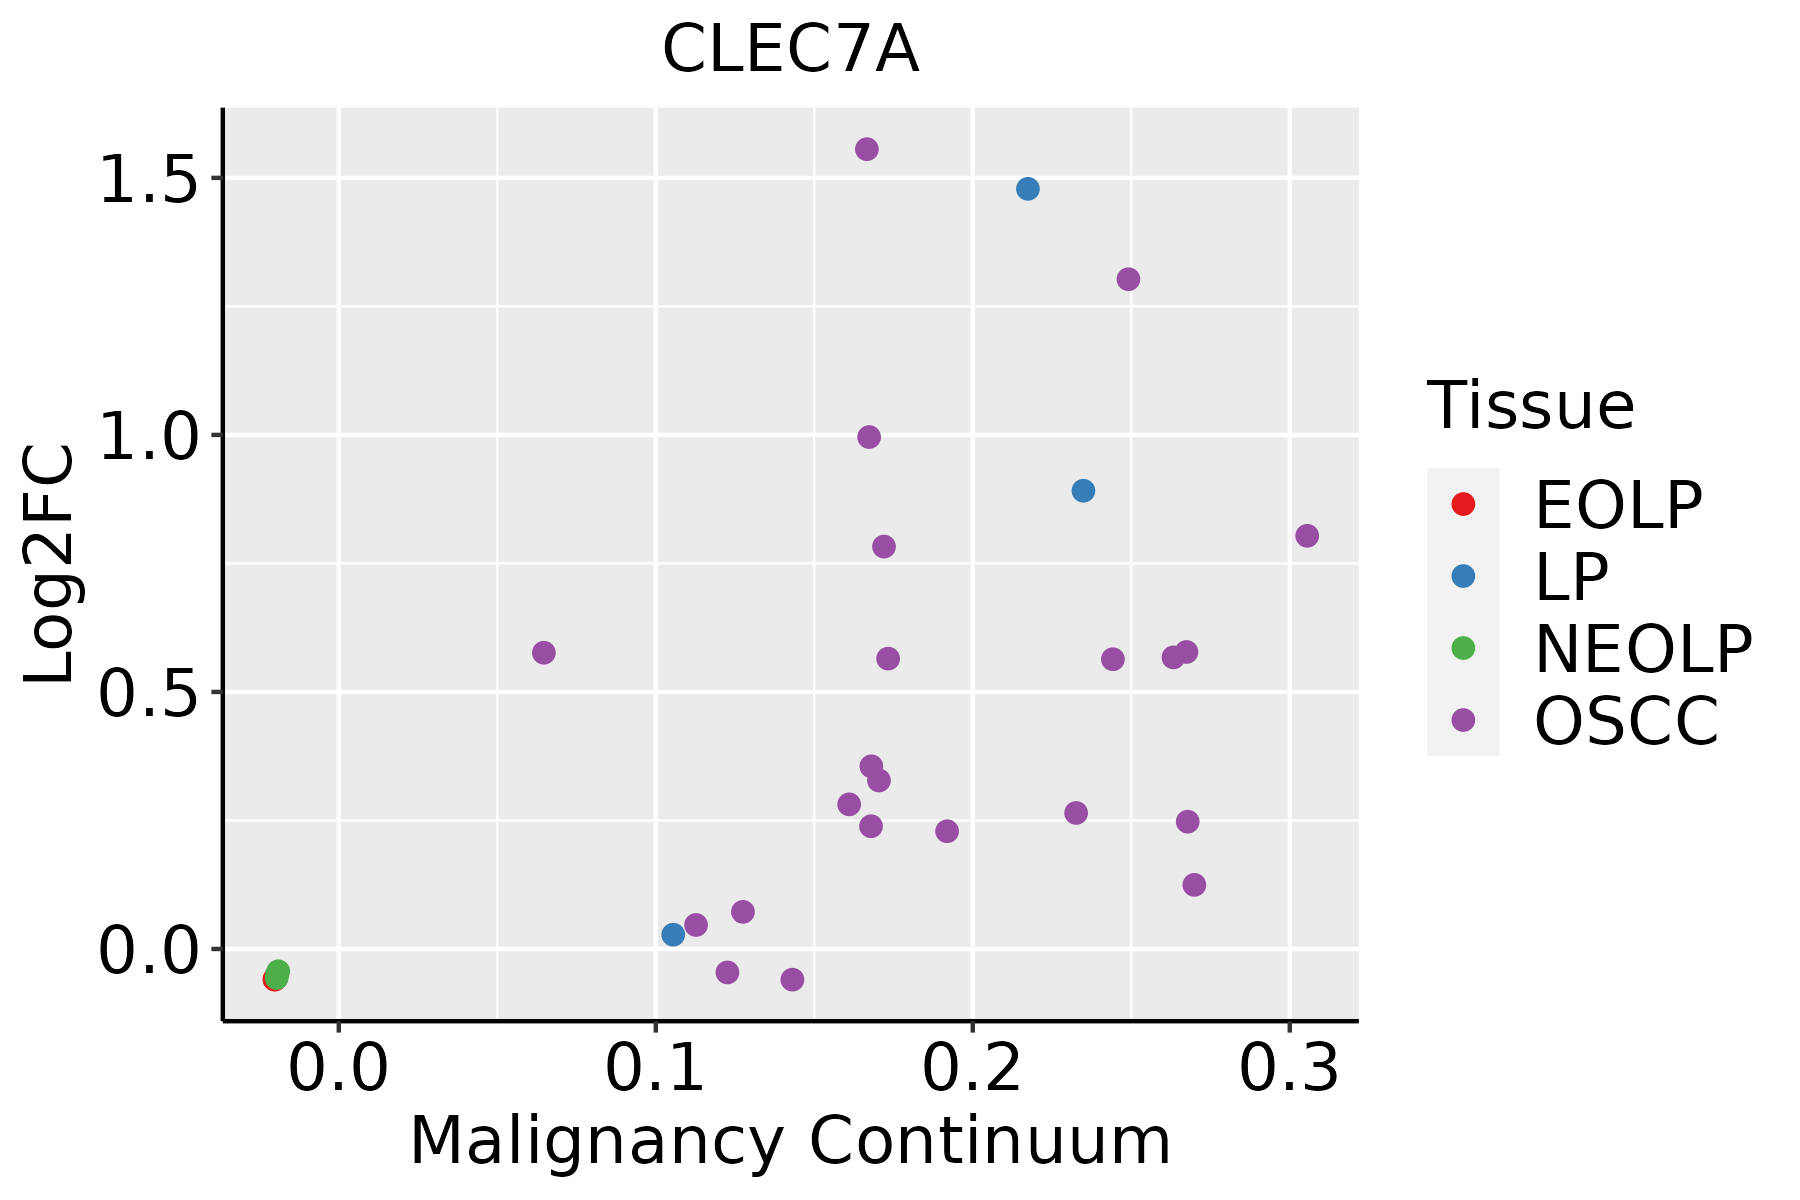 | EOLP: Erosive Oral lichen planus |
| LP: leukoplakia | ||
| NEOLP: Non-erosive oral lichen planus | ||
| OSCC: Oral squamous cell carcinoma |
| ∗log2FC in expression of this searched gene in stem-like cells from each diseased tissue sample relative to stem-like cells in normal samples in each tissue plotted against the malignancy continuum. Samples are colored based on if they are from different disease stage. |
Top |
Malignant transformation related pathway analysis |
| Find out the enriched GO biological processes and KEGG pathways involved in transition from healthy to precancer to cancer |
| Tissue | Disease Stage | Enriched GO biological Processes |
| Colorectum | AD |  |
| Colorectum | SER |  |
| Colorectum | MSS |  |
| Colorectum | MSI-H |  |
| Colorectum | FAP |  |
| ∗Top 15 enriched GO BP terms are showed in the bar plot of each disease state in each tissue. Each row represents a significant GO biological process which is colored according to the -log10(p.adjust). |
| Page: 1 2 3 4 5 6 7 8 9 |
| GO ID | Tissue | Disease Stage | Description | Gene Ratio | Bg Ratio | pvalue | p.adjust | Count |
| GO:0045862111 | Esophagus | ESCC | positive regulation of proteolysis | 256/8552 | 372/18723 | 7.88e-20 | 9.43e-18 | 256 |
| GO:0043254111 | Esophagus | ESCC | regulation of protein-containing complex assembly | 278/8552 | 428/18723 | 3.81e-16 | 2.77e-14 | 278 |
| GO:0031334111 | Esophagus | ESCC | positive regulation of protein-containing complex assembly | 166/8552 | 237/18723 | 2.06e-14 | 1.07e-12 | 166 |
| GO:004312318 | Esophagus | ESCC | positive regulation of I-kappaB kinase/NF-kappaB signaling | 132/8552 | 186/18723 | 2.07e-12 | 8.58e-11 | 132 |
| GO:0043122110 | Esophagus | ESCC | regulation of I-kappaB kinase/NF-kappaB signaling | 167/8552 | 249/18723 | 6.11e-12 | 2.32e-10 | 167 |
| GO:2000116111 | Esophagus | ESCC | regulation of cysteine-type endopeptidase activity | 158/8552 | 235/18723 | 1.67e-11 | 5.90e-10 | 158 |
| GO:0043281111 | Esophagus | ESCC | regulation of cysteine-type endopeptidase activity involved in apoptotic process | 143/8552 | 209/18723 | 2.12e-11 | 7.31e-10 | 143 |
| GO:000724919 | Esophagus | ESCC | I-kappaB kinase/NF-kappaB signaling | 183/8552 | 281/18723 | 3.02e-11 | 1.01e-09 | 183 |
| GO:0010952111 | Esophagus | ESCC | positive regulation of peptidase activity | 133/8552 | 197/18723 | 4.31e-10 | 1.14e-08 | 133 |
| GO:0052547111 | Esophagus | ESCC | regulation of peptidase activity | 275/8552 | 461/18723 | 7.54e-10 | 1.88e-08 | 275 |
| GO:0052548111 | Esophagus | ESCC | regulation of endopeptidase activity | 253/8552 | 432/18723 | 3.68e-08 | 6.78e-07 | 253 |
| GO:003109818 | Esophagus | ESCC | stress-activated protein kinase signaling cascade | 154/8552 | 247/18723 | 8.53e-08 | 1.44e-06 | 154 |
| GO:0010950111 | Esophagus | ESCC | positive regulation of endopeptidase activity | 116/8552 | 179/18723 | 1.77e-07 | 2.79e-06 | 116 |
| GO:004206027 | Esophagus | ESCC | wound healing | 243/8552 | 422/18723 | 4.62e-07 | 6.25e-06 | 243 |
| GO:00510908 | Esophagus | ESCC | regulation of DNA-binding transcription factor activity | 252/8552 | 440/18723 | 5.22e-07 | 6.97e-06 | 252 |
| GO:005140318 | Esophagus | ESCC | stress-activated MAPK cascade | 147/8552 | 239/18723 | 5.43e-07 | 7.18e-06 | 147 |
| GO:00028318 | Esophagus | ESCC | regulation of response to biotic stimulus | 191/8552 | 327/18723 | 2.12e-06 | 2.45e-05 | 191 |
| GO:00510918 | Esophagus | ESCC | positive regulation of DNA-binding transcription factor activity | 155/8552 | 260/18723 | 3.83e-06 | 4.14e-05 | 155 |
| GO:200037718 | Esophagus | ESCC | regulation of reactive oxygen species metabolic process | 100/8552 | 157/18723 | 3.87e-06 | 4.17e-05 | 100 |
| GO:0043280110 | Esophagus | ESCC | positive regulation of cysteine-type endopeptidase activity involved in apoptotic process | 84/8552 | 129/18723 | 6.38e-06 | 6.55e-05 | 84 |
| Page: 1 2 3 4 5 6 7 8 |
| Pathway ID | Tissue | Disease Stage | Description | Gene Ratio | Bg Ratio | pvalue | p.adjust | qvalue | Count |
| hsa046259 | Esophagus | ESCC | C-type lectin receptor signaling pathway | 73/4205 | 104/8465 | 1.57e-05 | 7.98e-05 | 4.09e-05 | 73 |
| hsa0414530 | Esophagus | ESCC | Phagosome | 100/4205 | 152/8465 | 3.81e-05 | 1.72e-04 | 8.82e-05 | 100 |
| hsa051527 | Esophagus | ESCC | Tuberculosis | 111/4205 | 180/8465 | 7.14e-04 | 2.32e-03 | 1.19e-03 | 111 |
| hsa0462513 | Esophagus | ESCC | C-type lectin receptor signaling pathway | 73/4205 | 104/8465 | 1.57e-05 | 7.98e-05 | 4.09e-05 | 73 |
| hsa04145114 | Esophagus | ESCC | Phagosome | 100/4205 | 152/8465 | 3.81e-05 | 1.72e-04 | 8.82e-05 | 100 |
| hsa0515212 | Esophagus | ESCC | Tuberculosis | 111/4205 | 180/8465 | 7.14e-04 | 2.32e-03 | 1.19e-03 | 111 |
| hsa046258 | Oral cavity | OSCC | C-type lectin receptor signaling pathway | 73/3704 | 104/8465 | 3.83e-08 | 3.12e-07 | 1.59e-07 | 73 |
| hsa051526 | Oral cavity | OSCC | Tuberculosis | 105/3704 | 180/8465 | 5.00e-05 | 2.04e-04 | 1.04e-04 | 105 |
| hsa0414528 | Oral cavity | OSCC | Phagosome | 88/3704 | 152/8465 | 2.83e-04 | 9.13e-04 | 4.65e-04 | 88 |
| hsa0462512 | Oral cavity | OSCC | C-type lectin receptor signaling pathway | 73/3704 | 104/8465 | 3.83e-08 | 3.12e-07 | 1.59e-07 | 73 |
| hsa0515211 | Oral cavity | OSCC | Tuberculosis | 105/3704 | 180/8465 | 5.00e-05 | 2.04e-04 | 1.04e-04 | 105 |
| hsa04145113 | Oral cavity | OSCC | Phagosome | 88/3704 | 152/8465 | 2.83e-04 | 9.13e-04 | 4.65e-04 | 88 |
| hsa0414529 | Oral cavity | LP | Phagosome | 73/2418 | 152/8465 | 2.37e-07 | 3.29e-06 | 2.12e-06 | 73 |
| hsa0462521 | Oral cavity | LP | C-type lectin receptor signaling pathway | 43/2418 | 104/8465 | 3.33e-03 | 1.41e-02 | 9.06e-03 | 43 |
| hsa0515221 | Oral cavity | LP | Tuberculosis | 65/2418 | 180/8465 | 1.60e-02 | 4.92e-02 | 3.17e-02 | 65 |
| hsa0414536 | Oral cavity | LP | Phagosome | 73/2418 | 152/8465 | 2.37e-07 | 3.29e-06 | 2.12e-06 | 73 |
| hsa0462531 | Oral cavity | LP | C-type lectin receptor signaling pathway | 43/2418 | 104/8465 | 3.33e-03 | 1.41e-02 | 9.06e-03 | 43 |
| hsa0515231 | Oral cavity | LP | Tuberculosis | 65/2418 | 180/8465 | 1.60e-02 | 4.92e-02 | 3.17e-02 | 65 |
| Page: 1 |
Top |
Cell-cell communication analysis |
| Identification of potential cell-cell interactions between two cell types and their ligand-receptor pairs for different disease states |
| Ligand | Receptor | LRpair | Pathway | Tissue | Disease Stage |
| Page: 1 |
Top |
Single-cell gene regulatory network inference analysis |
| Find out the significant the regulons (TFs) and the target genes of each regulon across cell types for different disease states |
| TF | Cell Type | Tissue | Disease Stage | Target Gene | RSS | Regulon Activity |
| ∗The dot plots of a searched regulon are shown for all cell subpopulations in each disease state of each tissue based on the regulon specific score inferred using pySCENIC and by calculating the average expression. |
| Page: 1 |
Top |
Somatic mutation of malignant transformation related genes |
| Annotation of somatic variants for genes involved in malignant transformation |
| Hugo Symbol | Variant Class | Variant Classification | dbSNP RS | HGVSc | HGVSp | HGVSp Short | SWISSPROT | BIOTYPE | SIFT | PolyPhen | Tumor Sample Barcode | Tissue | Histology | Sex | Age | Stage | Therapy Types | Drugs | Outcome |
| CLEC7A | SNV | Missense_Mutation | novel | c.433N>C | p.Lys145Gln | p.K145Q | Q9BXN2 | protein_coding | tolerated(0.22) | possibly_damaging(0.886) | TCGA-A2-A0CR-01 | Breast | breast invasive carcinoma | Female | <65 | I/II | Chemotherapy | adriamycin | CR |
| CLEC7A | SNV | Missense_Mutation | novel | c.480N>A | p.Ser160Arg | p.S160R | Q9BXN2 | protein_coding | deleterious(0) | possibly_damaging(0.529) | TCGA-2W-A8YY-01 | Cervix | cervical & endocervical cancer | Female | <65 | I/II | Chemotherapy | cisplatin | CR |
| CLEC7A | SNV | Missense_Mutation | c.85N>A | p.Ala29Thr | p.A29T | Q9BXN2 | protein_coding | tolerated(0.12) | benign(0.024) | TCGA-AA-3510-01 | Colorectum | colon adenocarcinoma | Male | >=65 | I/II | Unknown | Unknown | SD | |
| CLEC7A | SNV | Missense_Mutation | c.625N>G | p.Thr209Ala | p.T209A | Q9BXN2 | protein_coding | tolerated(0.1) | benign(0.079) | TCGA-AA-3664-01 | Colorectum | colon adenocarcinoma | Female | >=65 | I/II | Unknown | Unknown | SD | |
| CLEC7A | SNV | Missense_Mutation | novel | c.5N>C | p.Glu2Ala | p.E2A | Q9BXN2 | protein_coding | tolerated(0.14) | benign(0) | TCGA-AG-A002-01 | Colorectum | rectum adenocarcinoma | Male | <65 | I/II | Unknown | Unknown | SD |
| CLEC7A | SNV | Missense_Mutation | novel | c.196A>G | p.Thr66Ala | p.T66A | Q9BXN2 | protein_coding | tolerated(0.42) | benign(0.001) | TCGA-EI-6917-01 | Colorectum | rectum adenocarcinoma | Male | <65 | III/IV | Chemotherapy | 5fluorouracil+oxaciplatina+l-folinian | SD |
| CLEC7A | SNV | Missense_Mutation | rs759032825 | c.65C>T | p.Ser22Phe | p.S22F | Q9BXN2 | protein_coding | deleterious(0) | possibly_damaging(0.873) | TCGA-A5-A1OF-01 | Endometrium | uterine corpus endometrioid carcinoma | Female | <65 | I/II | Unknown | Unknown | SD |
| CLEC7A | SNV | Missense_Mutation | novel | c.729N>T | p.Lys243Asn | p.K243N | Q9BXN2 | protein_coding | deleterious(0) | probably_damaging(0.925) | TCGA-A5-A2K5-01 | Endometrium | uterine corpus endometrioid carcinoma | Female | >=65 | I/II | Unknown | Unknown | SD |
| CLEC7A | SNV | Missense_Mutation | novel | c.209N>T | p.Trp70Leu | p.W70L | Q9BXN2 | protein_coding | deleterious(0.05) | benign(0.003) | TCGA-AJ-A3EL-01 | Endometrium | uterine corpus endometrioid carcinoma | Female | <65 | I/II | Unknown | Unknown | SD |
| CLEC7A | SNV | Missense_Mutation | c.26A>G | p.Asn9Ser | p.N9S | Q9BXN2 | protein_coding | deleterious(0.02) | benign(0.217) | TCGA-AP-A056-01 | Endometrium | uterine corpus endometrioid carcinoma | Female | <65 | I/II | Unknown | Unknown | SD |
| Page: 1 2 3 4 |
Top |
Related drugs of malignant transformation related genes |
| Identification of chemicals and drugs interact with genes involved in malignant transfromation |
| (DGIdb 4.0) |
| Entrez ID | Symbol | Category | Interaction Types | Drug Claim Name | Drug Name | PMIDs |
| Page: 1 |

Copyright 2023-Present -The University of Texas Health Science Center at Houston |