
|
|||||
|
 | |
| |
| |
| |
| |
| |
|
Gene: CLEC3A |
Gene summary for CLEC3A |
| Gene information | Species | Human | Gene symbol | CLEC3A | Gene ID | 10143 |
| Gene name | C-type lectin domain family 3 member A | |
| Gene Alias | CLECSF1 | |
| Cytomap | 16q23.1 | |
| Gene Type | protein-coding | GO ID | GO:0001501 | UniProtAcc | J3KNC9 |
Top |
Malignant transformation analysis |
| Identification of the aberrant gene expression in precancerous and cancerous lesions by comparing the gene expression of stem-like cells in diseased tissues with normal stem cells |
| Entrez ID | Symbol | Replicates | Species | Organ | Tissue | Adj P-value | Log2FC | Malignancy |
| 10143 | CLEC3A | GSM4909299 | Human | Breast | IDC | 1.57e-03 | 1.55e-01 | 0.035 |
| 10143 | CLEC3A | GSM4909307 | Human | Breast | IDC | 8.38e-65 | 1.30e+00 | 0.1569 |
| 10143 | CLEC3A | GSM4909308 | Human | Breast | IDC | 1.10e-100 | 1.57e+00 | 0.158 |
| 10143 | CLEC3A | GSM4909311 | Human | Breast | IDC | 1.08e-15 | 6.18e-01 | 0.1534 |
| 10143 | CLEC3A | GSM4909313 | Human | Breast | IDC | 2.30e-04 | 2.84e-01 | 0.0391 |
| 10143 | CLEC3A | GSM4909321 | Human | Breast | IDC | 3.52e-11 | 4.82e-01 | 0.1559 |
| 10143 | CLEC3A | M1 | Human | Breast | IDC | 2.70e-18 | 5.36e-01 | 0.1577 |
| 10143 | CLEC3A | NCCBC14 | Human | Breast | DCIS | 5.37e-06 | 3.37e-01 | 0.2021 |
| 10143 | CLEC3A | NCCBC5 | Human | Breast | DCIS | 2.59e-02 | 1.87e-01 | 0.2046 |
| 10143 | CLEC3A | P2 | Human | Breast | IDC | 4.67e-09 | 4.04e-01 | 0.21 |
| Page: 1 |
| Tissue | Expression Dynamics | Abbreviation |
| Breast | 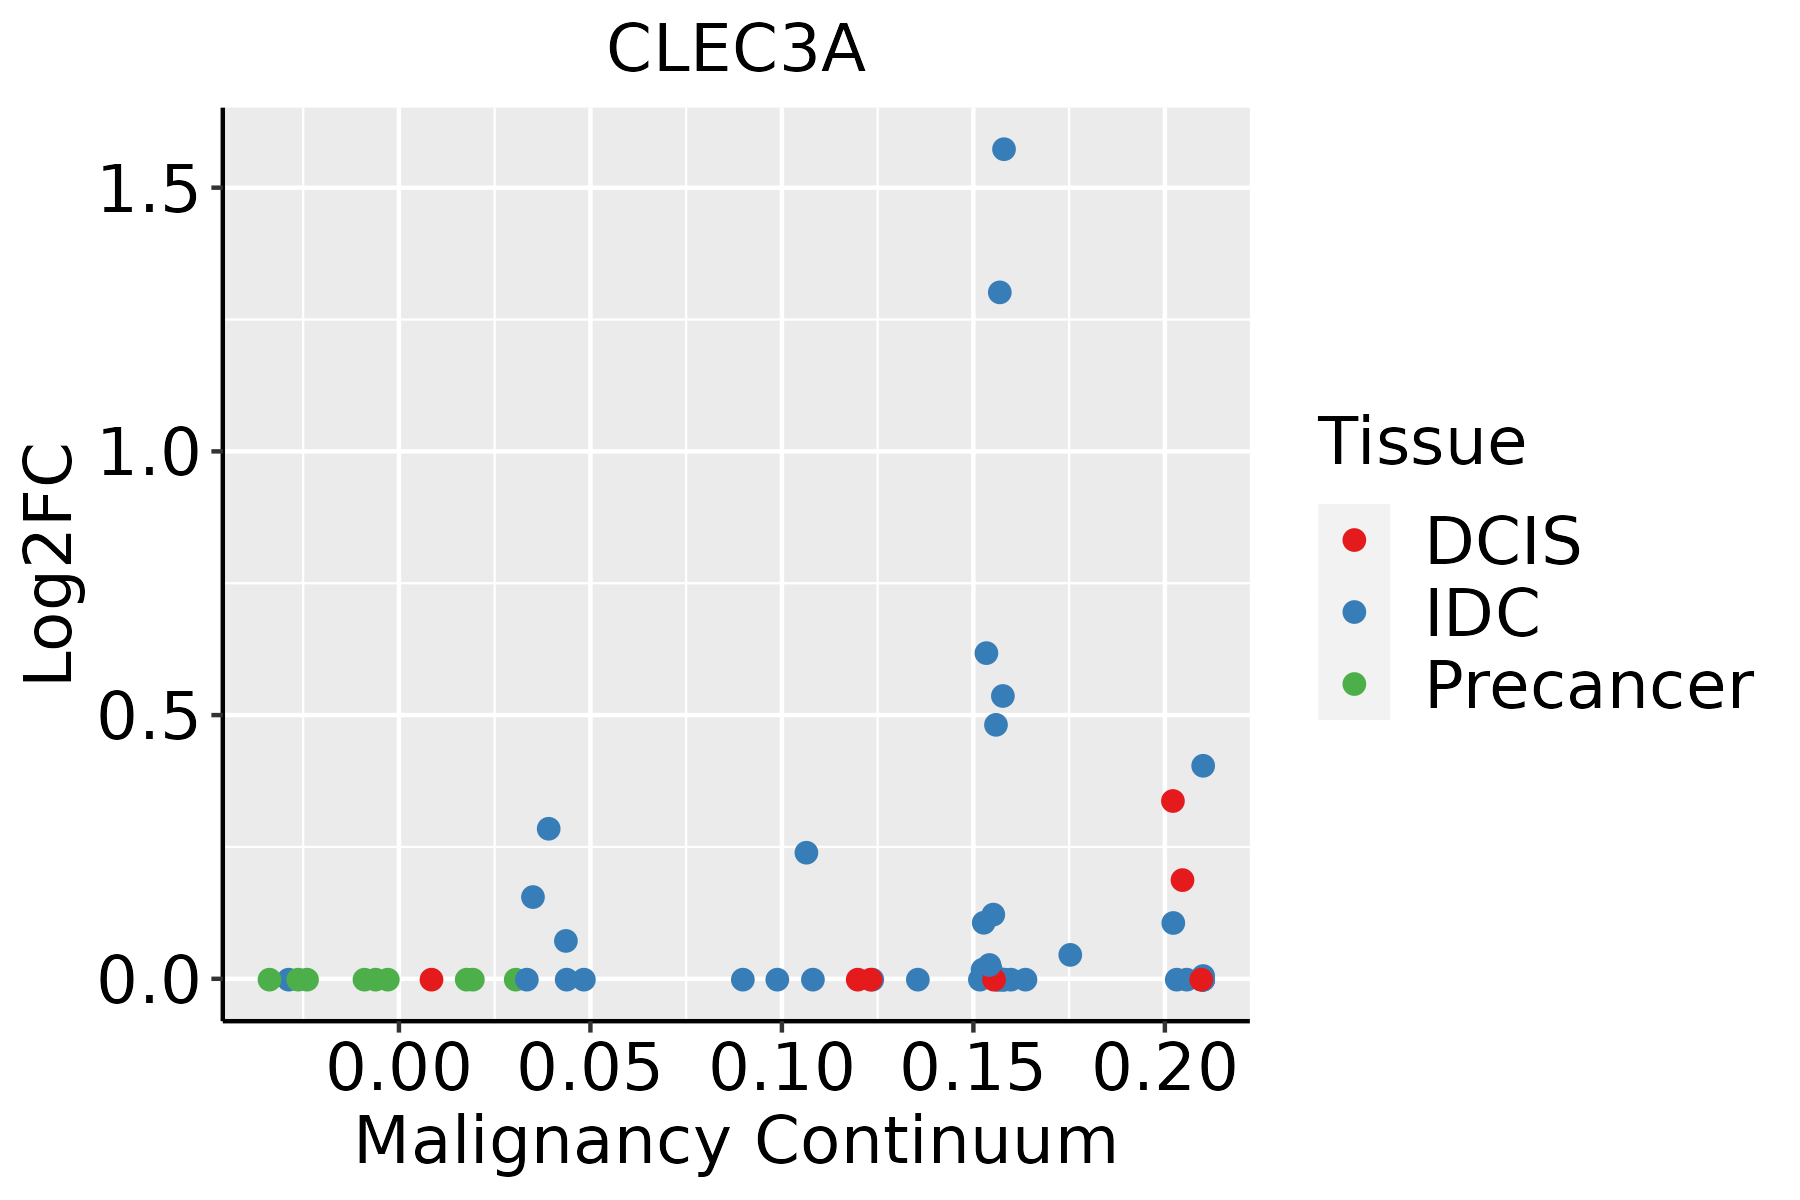 | IDC: Invasive ductal carcinoma |
| DCIS: Ductal carcinoma in situ | ||
| Precancer(BRCA1-mut): Precancerous lesion from BRCA1 mutation carriers |
| ∗log2FC in expression of this searched gene in stem-like cells from each diseased tissue sample relative to stem-like cells in normal samples in each tissue plotted against the malignancy continuum. Samples are colored based on if they are from different disease stage. |
Top |
Malignant transformation related pathway analysis |
| Find out the enriched GO biological processes and KEGG pathways involved in transition from healthy to precancer to cancer |
| Tissue | Disease Stage | Enriched GO biological Processes |
| Colorectum | AD |  |
| Colorectum | SER |  |
| Colorectum | MSS |  |
| Colorectum | MSI-H |  |
| Colorectum | FAP |  |
| ∗Top 15 enriched GO BP terms are showed in the bar plot of each disease state in each tissue. Each row represents a significant GO biological process which is colored according to the -log10(p.adjust). |
| Page: 1 2 3 4 5 6 7 8 9 |
| GO ID | Tissue | Disease Stage | Description | Gene Ratio | Bg Ratio | pvalue | p.adjust | Count |
| GO:000150311 | Breast | IDC | ossification | 50/1434 | 408/18723 | 6.51e-04 | 8.04e-03 | 50 |
| GO:000150321 | Breast | DCIS | ossification | 45/1390 | 408/18723 | 4.98e-03 | 3.72e-02 | 45 |
| Page: 1 |
| Pathway ID | Tissue | Disease Stage | Description | Gene Ratio | Bg Ratio | pvalue | p.adjust | qvalue | Count |
| Page: 1 |
Top |
Cell-cell communication analysis |
| Identification of potential cell-cell interactions between two cell types and their ligand-receptor pairs for different disease states |
| Ligand | Receptor | LRpair | Pathway | Tissue | Disease Stage |
| Page: 1 |
Top |
Single-cell gene regulatory network inference analysis |
| Find out the significant the regulons (TFs) and the target genes of each regulon across cell types for different disease states |
| TF | Cell Type | Tissue | Disease Stage | Target Gene | RSS | Regulon Activity |
| ∗The dot plots of a searched regulon are shown for all cell subpopulations in each disease state of each tissue based on the regulon specific score inferred using pySCENIC and by calculating the average expression. |
| Page: 1 |
Top |
Somatic mutation of malignant transformation related genes |
| Annotation of somatic variants for genes involved in malignant transformation |
| Hugo Symbol | Variant Class | Variant Classification | dbSNP RS | HGVSc | HGVSp | HGVSp Short | SWISSPROT | BIOTYPE | SIFT | PolyPhen | Tumor Sample Barcode | Tissue | Histology | Sex | Age | Stage | Therapy Types | Drugs | Outcome |
| CLEC3A | SNV | Missense_Mutation | rs375192134 | c.565G>A | p.Asp189Asn | p.D189N | protein_coding | deleterious(0) | benign(0.4) | TCGA-AR-A24H-01 | Breast | breast invasive carcinoma | Female | >=65 | I/II | Hormone Therapy | tamoxiphen | SD | |
| CLEC3A | SNV | Missense_Mutation | rs201495730 | c.578N>A | p.Arg193His | p.R193H | protein_coding | deleterious(0.01) | benign(0.013) | TCGA-MA-AA3W-01 | Cervix | cervical & endocervical cancer | Female | <65 | I/II | Chemotherapy | cisplatin | CR | |
| CLEC3A | SNV | Missense_Mutation | rs761179747 | c.577N>T | p.Arg193Cys | p.R193C | protein_coding | deleterious(0.01) | benign(0.045) | TCGA-3L-AA1B-01 | Colorectum | colon adenocarcinoma | Female | <65 | I/II | Unknown | Unknown | SD | |
| CLEC3A | SNV | Missense_Mutation | rs147323906 | c.364N>A | p.Ala122Thr | p.A122T | protein_coding | tolerated(0.15) | benign(0.011) | TCGA-A6-2679-01 | Colorectum | colon adenocarcinoma | Female | >=65 | I/II | Unknown | Unknown | SD | |
| CLEC3A | SNV | Missense_Mutation | c.397G>T | p.Gly133Cys | p.G133C | protein_coding | deleterious(0.02) | probably_damaging(0.944) | TCGA-A6-3809-01 | Colorectum | colon adenocarcinoma | Female | >=65 | I/II | Unknown | Unknown | SD | ||
| CLEC3A | SNV | Missense_Mutation | rs147323906 | c.364N>A | p.Ala122Thr | p.A122T | protein_coding | tolerated(0.15) | benign(0.011) | TCGA-AA-A02R-01 | Colorectum | colon adenocarcinoma | Female | >=65 | I/II | Unknown | Unknown | PD | |
| CLEC3A | SNV | Missense_Mutation | c.167N>G | p.Gln56Arg | p.Q56R | protein_coding | tolerated(0.16) | possibly_damaging(0.543) | TCGA-D5-6927-01 | Colorectum | colon adenocarcinoma | Male | <65 | I/II | Unknown | Unknown | SD | ||
| CLEC3A | SNV | Missense_Mutation | novel | c.454N>A | p.Asp152Asn | p.D152N | protein_coding | deleterious(0) | possibly_damaging(0.869) | TCGA-G4-6323-01 | Colorectum | colon adenocarcinoma | Male | <65 | I/II | Unknown | Unknown | SD | |
| CLEC3A | SNV | Missense_Mutation | c.395N>T | p.Pro132Leu | p.P132L | protein_coding | tolerated(0.07) | benign(0.061) | TCGA-AG-A02N-01 | Colorectum | rectum adenocarcinoma | Male | >=65 | I/II | Chemotherapy | folinic | CR | ||
| CLEC3A | SNV | Missense_Mutation | c.352N>A | p.Asp118Asn | p.D118N | protein_coding | tolerated(0.21) | possibly_damaging(0.681) | TCGA-A5-A0G1-01 | Endometrium | uterine corpus endometrioid carcinoma | Female | >=65 | I/II | Unknown | Unknown | SD |
| Page: 1 2 3 4 5 |
Top |
Related drugs of malignant transformation related genes |
| Identification of chemicals and drugs interact with genes involved in malignant transfromation |
| (DGIdb 4.0) |
| Entrez ID | Symbol | Category | Interaction Types | Drug Claim Name | Drug Name | PMIDs |
| Page: 1 |

Copyright 2023-Present -The University of Texas Health Science Center at Houston |