
|
|||||
|
 | |
| |
| |
| |
| |
| |
|
Gene: CLEC2D |
Gene summary for CLEC2D |
| Gene information | Species | Human | Gene symbol | CLEC2D | Gene ID | 29121 |
| Gene name | C-type lectin domain family 2 member D | |
| Gene Alias | CLAX | |
| Cytomap | 12p13.31 | |
| Gene Type | protein-coding | GO ID | GO:0007154 | UniProtAcc | Q9UHP7 |
Top |
Malignant transformation analysis |
| Identification of the aberrant gene expression in precancerous and cancerous lesions by comparing the gene expression of stem-like cells in diseased tissues with normal stem cells |
| Entrez ID | Symbol | Replicates | Species | Organ | Tissue | Adj P-value | Log2FC | Malignancy |
| 29121 | CLEC2D | HCC1_Meng | Human | Liver | HCC | 1.68e-03 | -1.02e-01 | 0.0246 |
| 29121 | CLEC2D | HCC2_Meng | Human | Liver | HCC | 2.87e-11 | -3.34e-02 | 0.0107 |
| 29121 | CLEC2D | HCC1 | Human | Liver | HCC | 3.83e-08 | 1.81e+00 | 0.5336 |
| 29121 | CLEC2D | HCC2 | Human | Liver | HCC | 3.28e-19 | 1.68e+00 | 0.5341 |
| 29121 | CLEC2D | C21 | Human | Oral cavity | OSCC | 6.70e-08 | 4.13e-01 | 0.2678 |
| 29121 | CLEC2D | C30 | Human | Oral cavity | OSCC | 4.47e-11 | 5.37e-01 | 0.3055 |
| 29121 | CLEC2D | C38 | Human | Oral cavity | OSCC | 6.86e-08 | 1.19e+00 | 0.172 |
| 29121 | CLEC2D | C46 | Human | Oral cavity | OSCC | 2.97e-10 | 3.19e-01 | 0.1673 |
| 29121 | CLEC2D | C51 | Human | Oral cavity | OSCC | 8.73e-05 | 3.08e-01 | 0.2674 |
| 29121 | CLEC2D | C57 | Human | Oral cavity | OSCC | 1.50e-04 | 2.15e-01 | 0.1679 |
| 29121 | CLEC2D | C06 | Human | Oral cavity | OSCC | 1.85e-04 | 8.37e-01 | 0.2699 |
| 29121 | CLEC2D | C08 | Human | Oral cavity | OSCC | 2.38e-03 | 1.91e-01 | 0.1919 |
| 29121 | CLEC2D | C09 | Human | Oral cavity | OSCC | 1.12e-03 | 1.58e-01 | 0.1431 |
| 29121 | CLEC2D | LN46 | Human | Oral cavity | OSCC | 1.98e-11 | 5.11e-01 | 0.1666 |
| 29121 | CLEC2D | EOLP-1 | Human | Oral cavity | EOLP | 4.65e-02 | 2.48e-01 | -0.0202 |
| Page: 1 |
| Tissue | Expression Dynamics | Abbreviation |
| Liver | 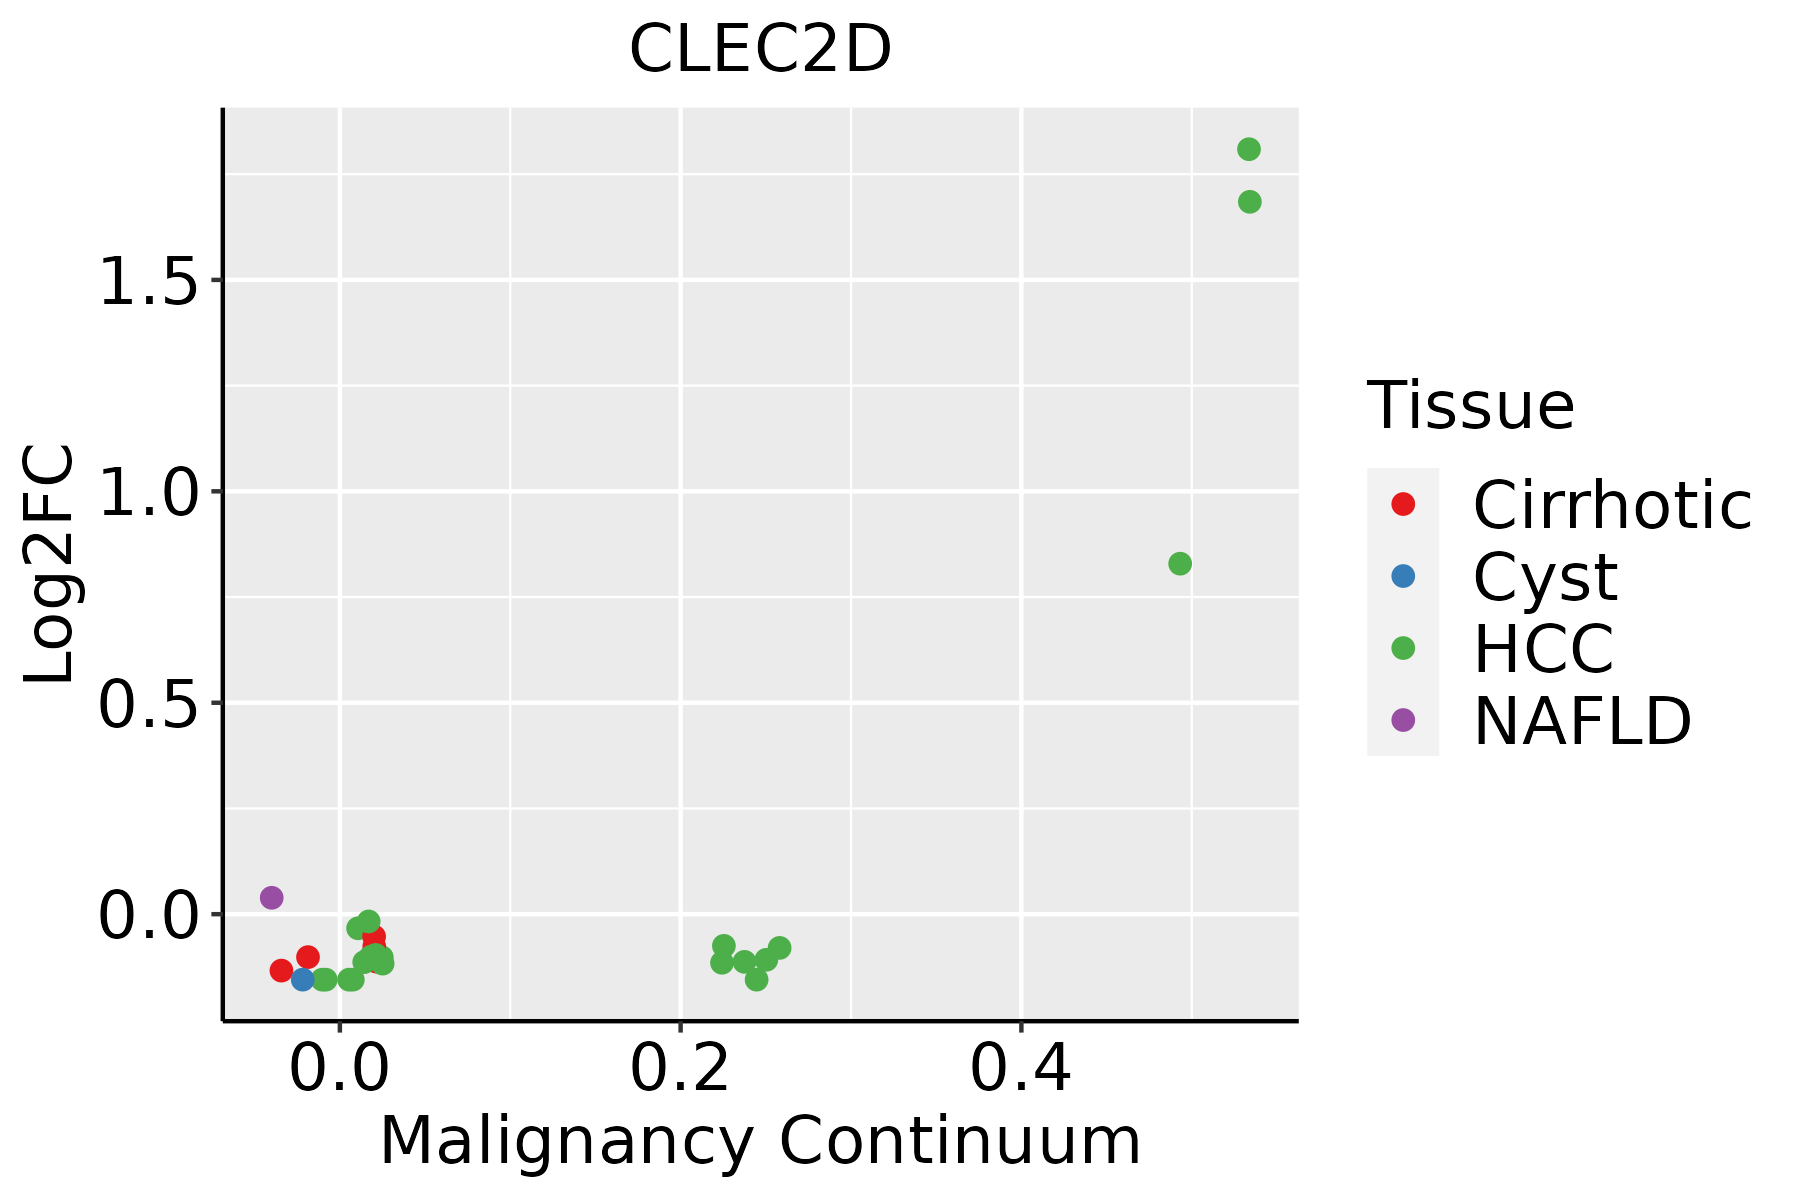 | HCC: Hepatocellular carcinoma |
| NAFLD: Non-alcoholic fatty liver disease | ||
| Oral Cavity | 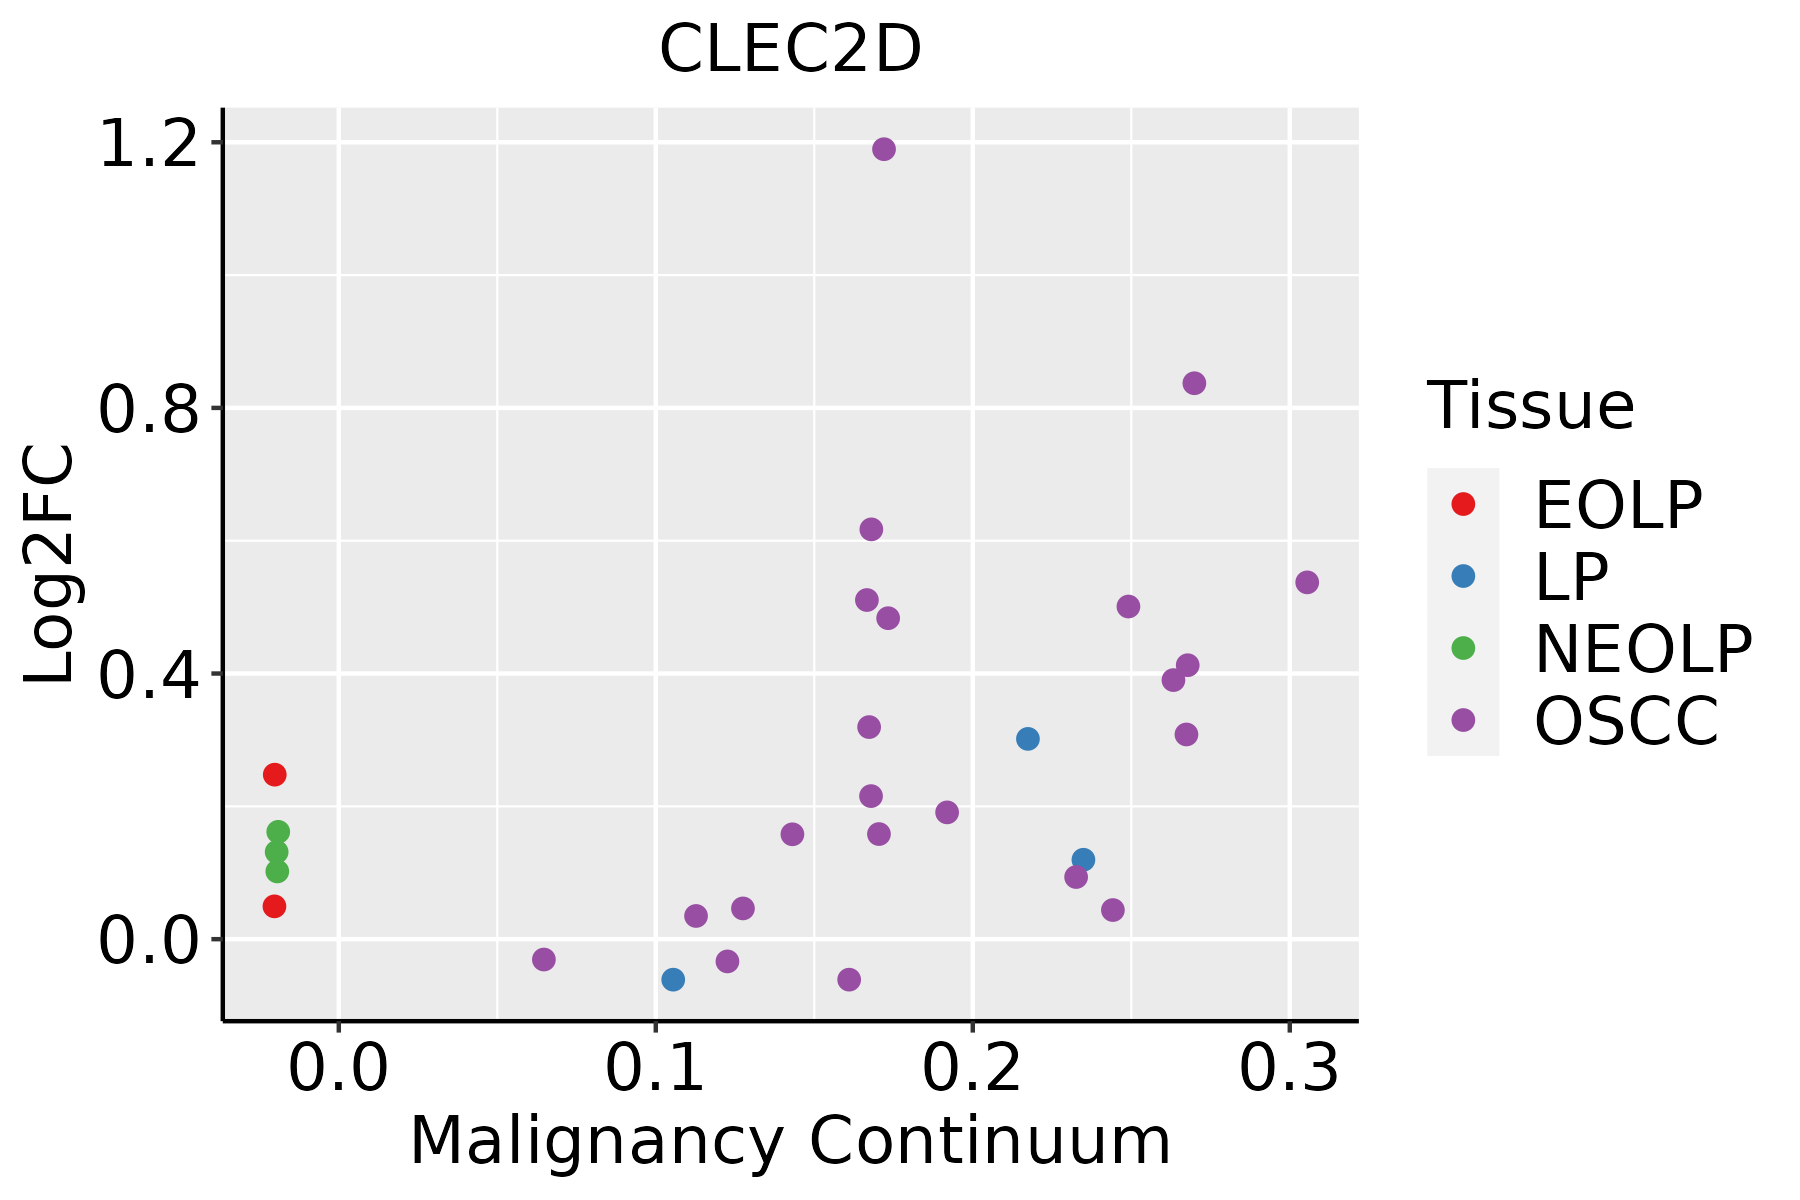 | EOLP: Erosive Oral lichen planus |
| LP: leukoplakia | ||
| NEOLP: Non-erosive oral lichen planus | ||
| OSCC: Oral squamous cell carcinoma |
| ∗log2FC in expression of this searched gene in stem-like cells from each diseased tissue sample relative to stem-like cells in normal samples in each tissue plotted against the malignancy continuum. Samples are colored based on if they are from different disease stage. |
Top |
Malignant transformation related pathway analysis |
| Find out the enriched GO biological processes and KEGG pathways involved in transition from healthy to precancer to cancer |
| Tissue | Disease Stage | Enriched GO biological Processes |
| Colorectum | AD |  |
| Colorectum | SER |  |
| Colorectum | MSS |  |
| Colorectum | MSI-H |  |
| Colorectum | FAP |  |
| ∗Top 15 enriched GO BP terms are showed in the bar plot of each disease state in each tissue. Each row represents a significant GO biological process which is colored according to the -log10(p.adjust). |
| Page: 1 2 3 4 5 6 7 8 9 |
| GO ID | Tissue | Disease Stage | Description | Gene Ratio | Bg Ratio | pvalue | p.adjust | Count |
| Page: 1 |
| Pathway ID | Tissue | Disease Stage | Description | Gene Ratio | Bg Ratio | pvalue | p.adjust | qvalue | Count |
| Page: 1 |
Top |
Cell-cell communication analysis |
| Identification of potential cell-cell interactions between two cell types and their ligand-receptor pairs for different disease states |
| Ligand | Receptor | LRpair | Pathway | Tissue | Disease Stage |
| CLEC2D | KLRB1 | CLEC2D_KLRB1 | CLEC | Breast | ADJ |
| CLEC2D | KLRB1 | CLEC2D_KLRB1 | CLEC | Breast | DCIS |
| CLEC2D | KLRB1 | CLEC2D_KLRB1 | CLEC | Breast | Healthy |
| CLEC2D | KLRB1 | CLEC2D_KLRB1 | CLEC | Breast | IDC |
| CLEC2D | KLRB1 | CLEC2D_KLRB1 | CLEC | Breast | Precancer |
| CLEC2D | KLRB1 | CLEC2D_KLRB1 | CLEC | Cervix | ADJ |
| CLEC2D | KLRB1 | CLEC2D_KLRB1 | CLEC | Cervix | CC |
| CLEC2D | KLRB1 | CLEC2D_KLRB1 | CLEC | Cervix | Healthy |
| CLEC2D | KLRB1 | CLEC2D_KLRB1 | CLEC | Cervix | Precancer |
| CLEC2D | KLRB1 | CLEC2D_KLRB1 | CLEC | CRC | MSI-H |
| CLEC2D | KLRB1 | CLEC2D_KLRB1 | CLEC | Endometrium | ADJ |
| CLEC2D | KLRB1 | CLEC2D_KLRB1 | CLEC | Endometrium | AEH |
| CLEC2D | KLRB1 | CLEC2D_KLRB1 | CLEC | Endometrium | EEC |
| CLEC2D | KLRB1 | CLEC2D_KLRB1 | CLEC | Endometrium | Healthy |
| CLEC2D | KLRB1 | CLEC2D_KLRB1 | CLEC | Esophagus | ADJ |
| CLEC2D | KLRB1 | CLEC2D_KLRB1 | CLEC | GC | ADJ |
| CLEC2D | KLRB1 | CLEC2D_KLRB1 | CLEC | GC | GC |
| CLEC2D | KLRB1 | CLEC2D_KLRB1 | CLEC | GC | Precancer |
| CLEC2D | KLRB1 | CLEC2D_KLRB1 | CLEC | HNSCC | ADJ |
| CLEC2D | KLRB1 | CLEC2D_KLRB1 | CLEC | HNSCC | Healthy |
| Page: 1 2 3 |
Top |
Single-cell gene regulatory network inference analysis |
| Find out the significant the regulons (TFs) and the target genes of each regulon across cell types for different disease states |
| TF | Cell Type | Tissue | Disease Stage | Target Gene | RSS | Regulon Activity |
| ∗The dot plots of a searched regulon are shown for all cell subpopulations in each disease state of each tissue based on the regulon specific score inferred using pySCENIC and by calculating the average expression. |
| Page: 1 |
Top |
Somatic mutation of malignant transformation related genes |
| Annotation of somatic variants for genes involved in malignant transformation |
| Hugo Symbol | Variant Class | Variant Classification | dbSNP RS | HGVSc | HGVSp | HGVSp Short | SWISSPROT | BIOTYPE | SIFT | PolyPhen | Tumor Sample Barcode | Tissue | Histology | Sex | Age | Stage | Therapy Types | Drugs | Outcome |
| CLEC2D | SNV | Missense_Mutation | novel | c.120C>A | p.Phe40Leu | p.F40L | Q9UHP7 | protein_coding | tolerated(0.66) | benign(0.005) | TCGA-C5-A8ZZ-01 | Cervix | cervical & endocervical cancer | Female | <65 | I/II | Unspecific | Cisplatin | SD |
| CLEC2D | SNV | Missense_Mutation | c.307T>C | p.Cys103Arg | p.C103R | Q9UHP7 | protein_coding | deleterious(0) | probably_damaging(1) | TCGA-AA-3492-01 | Colorectum | colon adenocarcinoma | Female | >=65 | I/II | Unknown | Unknown | SD | |
| CLEC2D | SNV | Missense_Mutation | novel | c.253N>C | p.Lys85Gln | p.K85Q | Q9UHP7 | protein_coding | deleterious(0.02) | probably_damaging(0.967) | TCGA-CA-6717-01 | Colorectum | colon adenocarcinoma | Male | <65 | I/II | Chemotherapy | oxaliplatin | CR |
| CLEC2D | SNV | Missense_Mutation | novel | c.362N>C | p.Phe121Ser | p.F121S | Q9UHP7 | protein_coding | deleterious(0) | probably_damaging(0.998) | TCGA-CA-6717-01 | Colorectum | colon adenocarcinoma | Male | <65 | I/II | Chemotherapy | oxaliplatin | CR |
| CLEC2D | SNV | Missense_Mutation | c.305N>G | p.Phe102Cys | p.F102C | Q9UHP7 | protein_coding | deleterious(0.01) | possibly_damaging(0.819) | TCGA-CA-6718-01 | Colorectum | colon adenocarcinoma | Male | <65 | I/II | Unknown | Unknown | PD | |
| CLEC2D | SNV | Missense_Mutation | c.536C>T | p.Pro179Leu | p.P179L | Q9UHP7 | protein_coding | tolerated(0.07) | benign(0.118) | TCGA-A5-A0G2-01 | Endometrium | uterine corpus endometrioid carcinoma | Female | <65 | III/IV | Unknown | Unknown | SD | |
| CLEC2D | SNV | Missense_Mutation | rs769100213 | c.109N>T | p.Arg37Cys | p.R37C | Q9UHP7 | protein_coding | tolerated(0.21) | benign(0) | TCGA-AP-A051-01 | Endometrium | uterine corpus endometrioid carcinoma | Female | >=65 | I/II | Unknown | Unknown | SD |
| CLEC2D | SNV | Missense_Mutation | novel | c.265T>G | p.Phe89Val | p.F89V | Q9UHP7 | protein_coding | deleterious(0) | probably_damaging(0.998) | TCGA-AP-A1DV-01 | Endometrium | uterine corpus endometrioid carcinoma | Female | <65 | I/II | Unknown | Unknown | SD |
| CLEC2D | SNV | Missense_Mutation | novel | c.380N>A | p.Gly127Asp | p.G127D | Q9UHP7 | protein_coding | deleterious(0.02) | possibly_damaging(0.907) | TCGA-AX-A1CE-01 | Endometrium | uterine corpus endometrioid carcinoma | Female | <65 | I/II | Unspecific | Paclitaxel | SD |
| CLEC2D | SNV | Missense_Mutation | c.271N>A | p.Asp91Asn | p.D91N | Q9UHP7 | protein_coding | deleterious(0) | benign(0.113) | TCGA-D1-A17M-01 | Endometrium | uterine corpus endometrioid carcinoma | Female | <65 | I/II | Unknown | Unknown | SD |
| Page: 1 2 3 |
Top |
Related drugs of malignant transformation related genes |
| Identification of chemicals and drugs interact with genes involved in malignant transfromation |
| (DGIdb 4.0) |
| Entrez ID | Symbol | Category | Interaction Types | Drug Claim Name | Drug Name | PMIDs |
| Page: 1 |

Copyright 2023-Present -The University of Texas Health Science Center at Houston |