
|
|||||
|
 | |
| |
| |
| |
| |
| |
|
Gene: CLEC2B |
Gene summary for CLEC2B |
| Gene information | Species | Human | Gene symbol | CLEC2B | Gene ID | 9976 |
| Gene name | C-type lectin domain family 2 member B | |
| Gene Alias | AICL | |
| Cytomap | 12p13.31 | |
| Gene Type | protein-coding | GO ID | GO:0005575 | UniProtAcc | Q92478 |
Top |
Malignant transformation analysis |
| Identification of the aberrant gene expression in precancerous and cancerous lesions by comparing the gene expression of stem-like cells in diseased tissues with normal stem cells |
| Entrez ID | Symbol | Replicates | Species | Organ | Tissue | Adj P-value | Log2FC | Malignancy |
| 9976 | CLEC2B | N_HPV_2 | Human | Cervix | N_HPV | 2.79e-02 | 1.64e-01 | -0.0131 |
| 9976 | CLEC2B | CCII_1 | Human | Cervix | CC | 6.81e-04 | -4.01e-01 | 0.3249 |
| 9976 | CLEC2B | Tumor | Human | Cervix | CC | 1.19e-34 | 8.46e-01 | 0.1241 |
| 9976 | CLEC2B | sample1 | Human | Cervix | CC | 4.28e-07 | 5.32e-01 | 0.0959 |
| 9976 | CLEC2B | sample3 | Human | Cervix | CC | 9.93e-44 | 7.89e-01 | 0.1387 |
| 9976 | CLEC2B | T1 | Human | Cervix | CC | 1.04e-12 | 5.14e-01 | 0.0918 |
| 9976 | CLEC2B | T3 | Human | Cervix | CC | 6.24e-30 | 8.15e-01 | 0.1389 |
| 9976 | CLEC2B | AEH-subject1 | Human | Endometrium | AEH | 1.56e-02 | -6.45e-02 | -0.3059 |
| 9976 | CLEC2B | AEH-subject3 | Human | Endometrium | AEH | 1.10e-04 | -9.18e-02 | -0.2576 |
| 9976 | CLEC2B | AEH-subject4 | Human | Endometrium | AEH | 2.16e-02 | -8.41e-03 | -0.2657 |
| 9976 | CLEC2B | EEC-subject2 | Human | Endometrium | EEC | 1.02e-03 | -1.41e-01 | -0.2607 |
| 9976 | CLEC2B | EEC-subject3 | Human | Endometrium | EEC | 5.06e-09 | 2.88e-02 | -0.2525 |
| 9976 | CLEC2B | EEC-subject4 | Human | Endometrium | EEC | 7.33e-06 | 1.34e-01 | -0.2571 |
| 9976 | CLEC2B | GSM5276934 | Human | Endometrium | EEC | 5.27e-24 | 6.35e-01 | -0.0913 |
| 9976 | CLEC2B | GSM5276935 | Human | Endometrium | EEC | 5.25e-06 | -1.20e-01 | -0.123 |
| 9976 | CLEC2B | GSM5276937 | Human | Endometrium | EEC | 1.15e-34 | 8.81e-01 | -0.0897 |
| 9976 | CLEC2B | GSM6177620_NYU_UCEC1_lib1_lib1 | Human | Endometrium | EEC | 5.68e-03 | -1.50e-01 | -0.1869 |
| 9976 | CLEC2B | GSM6177620_NYU_UCEC1_lib2_lib2 | Human | Endometrium | EEC | 3.73e-09 | -6.44e-02 | -0.1875 |
| 9976 | CLEC2B | GSM6177620_NYU_UCEC1_lib3_lib3 | Human | Endometrium | EEC | 4.15e-05 | -1.34e-01 | -0.1883 |
| 9976 | CLEC2B | GSM6177621_NYU_UCEC2_lib1_lib1 | Human | Endometrium | EEC | 1.51e-07 | -1.23e-01 | -0.1934 |
| Page: 1 2 3 4 5 6 |
| Tissue | Expression Dynamics | Abbreviation |
| Cervix |  | CC: Cervix cancer |
| HSIL_HPV: HPV-infected high-grade squamous intraepithelial lesions | ||
| N_HPV: HPV-infected normal cervix | ||
| Endometrium | 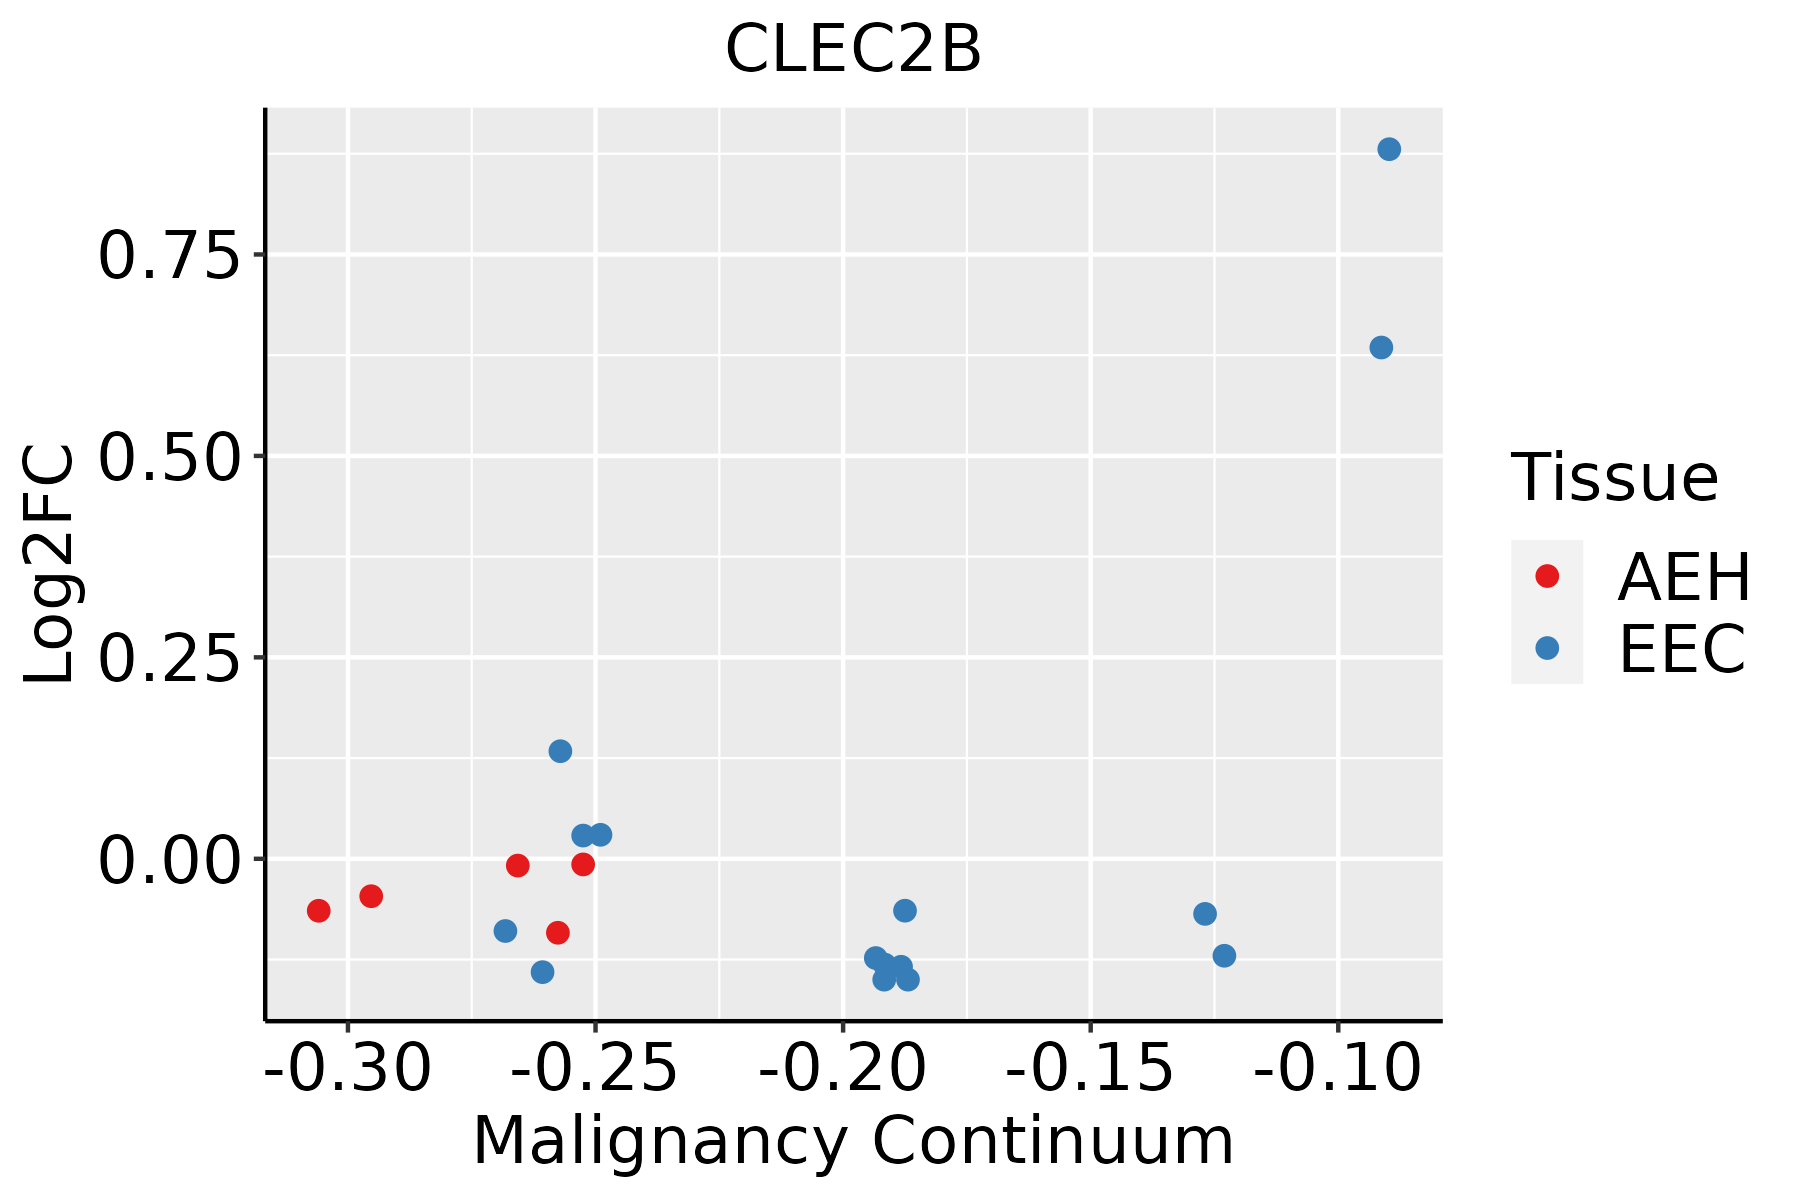 | AEH: Atypical endometrial hyperplasia |
| EEC: Endometrioid Cancer | ||
| Esophagus |  | ESCC: Esophageal squamous cell carcinoma |
| HGIN: High-grade intraepithelial neoplasias | ||
| LGIN: Low-grade intraepithelial neoplasias | ||
| Oral Cavity | 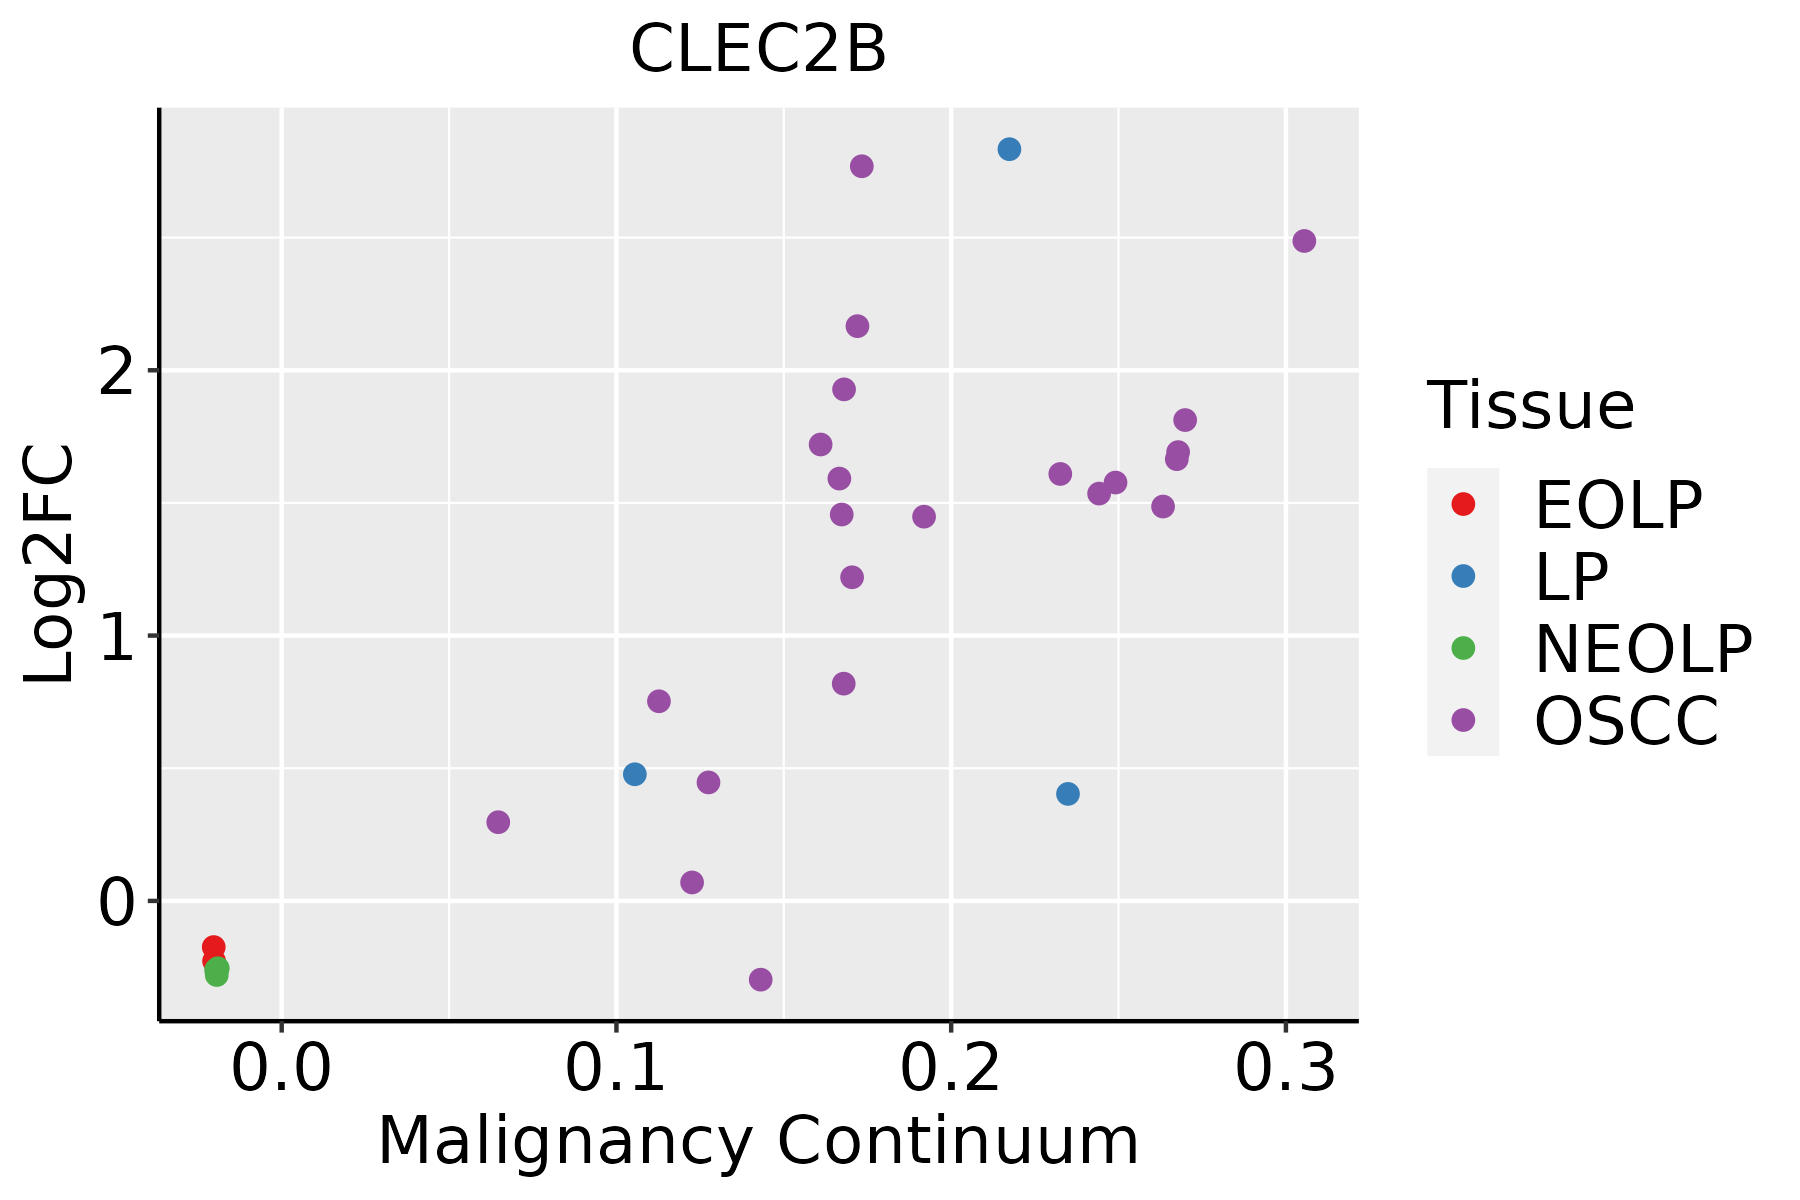 | EOLP: Erosive Oral lichen planus |
| LP: leukoplakia | ||
| NEOLP: Non-erosive oral lichen planus | ||
| OSCC: Oral squamous cell carcinoma | ||
| Prostate | 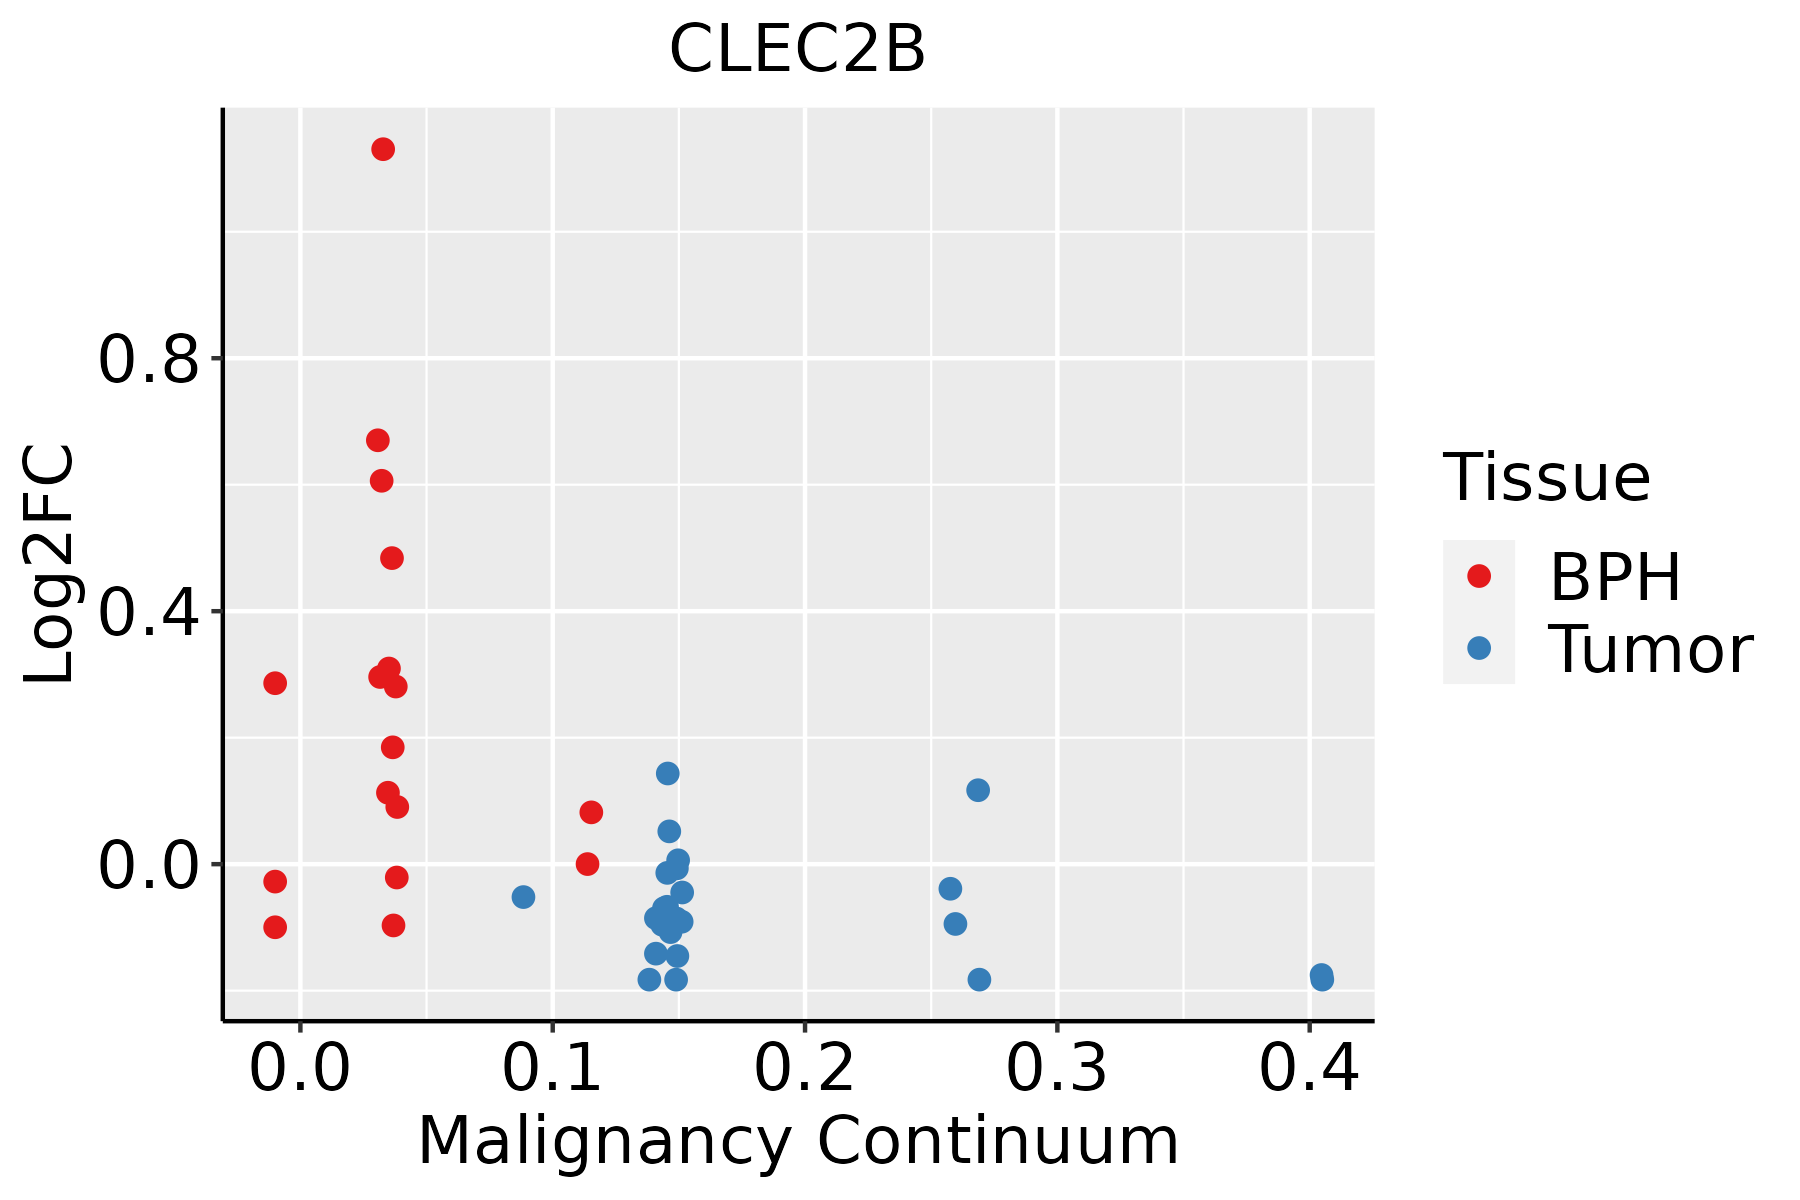 | BPH: Benign Prostatic Hyperplasia |
| Skin |  | AK: Actinic keratosis |
| cSCC: Cutaneous squamous cell carcinoma | ||
| SCCIS:squamous cell carcinoma in situ |
| ∗log2FC in expression of this searched gene in stem-like cells from each diseased tissue sample relative to stem-like cells in normal samples in each tissue plotted against the malignancy continuum. Samples are colored based on if they are from different disease stage. |
Top |
Malignant transformation related pathway analysis |
| Find out the enriched GO biological processes and KEGG pathways involved in transition from healthy to precancer to cancer |
| Tissue | Disease Stage | Enriched GO biological Processes |
| Colorectum | AD |  |
| Colorectum | SER |  |
| Colorectum | MSS |  |
| Colorectum | MSI-H |  |
| Colorectum | FAP |  |
| ∗Top 15 enriched GO BP terms are showed in the bar plot of each disease state in each tissue. Each row represents a significant GO biological process which is colored according to the -log10(p.adjust). |
| Page: 1 2 3 4 5 6 7 8 9 |
| GO ID | Tissue | Disease Stage | Description | Gene Ratio | Bg Ratio | pvalue | p.adjust | Count |
| Page: 1 |
| Pathway ID | Tissue | Disease Stage | Description | Gene Ratio | Bg Ratio | pvalue | p.adjust | qvalue | Count |
| hsa0516720 | Cervix | CC | Kaposi sarcoma-associated herpesvirus infection | 60/1267 | 194/8465 | 9.74e-09 | 1.58e-07 | 9.33e-08 | 60 |
| hsa05167110 | Cervix | CC | Kaposi sarcoma-associated herpesvirus infection | 60/1267 | 194/8465 | 9.74e-09 | 1.58e-07 | 9.33e-08 | 60 |
| hsa0516724 | Cervix | N_HPV | Kaposi sarcoma-associated herpesvirus infection | 18/349 | 194/8465 | 1.06e-03 | 7.37e-03 | 5.76e-03 | 18 |
| hsa0516734 | Cervix | N_HPV | Kaposi sarcoma-associated herpesvirus infection | 18/349 | 194/8465 | 1.06e-03 | 7.37e-03 | 5.76e-03 | 18 |
| hsa0516725 | Endometrium | AEH | Kaposi sarcoma-associated herpesvirus infection | 44/1197 | 194/8465 | 7.97e-04 | 5.28e-03 | 3.87e-03 | 44 |
| hsa05167111 | Endometrium | AEH | Kaposi sarcoma-associated herpesvirus infection | 44/1197 | 194/8465 | 7.97e-04 | 5.28e-03 | 3.87e-03 | 44 |
| hsa0516726 | Endometrium | EEC | Kaposi sarcoma-associated herpesvirus infection | 45/1237 | 194/8465 | 8.55e-04 | 5.86e-03 | 4.37e-03 | 45 |
| hsa0516735 | Endometrium | EEC | Kaposi sarcoma-associated herpesvirus infection | 45/1237 | 194/8465 | 8.55e-04 | 5.86e-03 | 4.37e-03 | 45 |
| hsa05167211 | Esophagus | ESCC | Kaposi sarcoma-associated herpesvirus infection | 136/4205 | 194/8465 | 4.28e-09 | 4.22e-08 | 2.16e-08 | 136 |
| hsa0516738 | Esophagus | ESCC | Kaposi sarcoma-associated herpesvirus infection | 136/4205 | 194/8465 | 4.28e-09 | 4.22e-08 | 2.16e-08 | 136 |
| hsa0516729 | Oral cavity | OSCC | Kaposi sarcoma-associated herpesvirus infection | 125/3704 | 194/8465 | 3.67e-09 | 3.84e-08 | 1.96e-08 | 125 |
| hsa05167113 | Oral cavity | OSCC | Kaposi sarcoma-associated herpesvirus infection | 125/3704 | 194/8465 | 3.67e-09 | 3.84e-08 | 1.96e-08 | 125 |
| hsa05167210 | Oral cavity | LP | Kaposi sarcoma-associated herpesvirus infection | 84/2418 | 194/8465 | 6.66e-06 | 5.16e-05 | 3.33e-05 | 84 |
| hsa0516737 | Oral cavity | LP | Kaposi sarcoma-associated herpesvirus infection | 84/2418 | 194/8465 | 6.66e-06 | 5.16e-05 | 3.33e-05 | 84 |
| hsa0516744 | Oral cavity | EOLP | Kaposi sarcoma-associated herpesvirus infection | 68/1218 | 194/8465 | 2.59e-13 | 2.09e-11 | 1.24e-11 | 68 |
| hsa0516754 | Oral cavity | EOLP | Kaposi sarcoma-associated herpesvirus infection | 68/1218 | 194/8465 | 2.59e-13 | 2.09e-11 | 1.24e-11 | 68 |
| hsa0516762 | Oral cavity | NEOLP | Kaposi sarcoma-associated herpesvirus infection | 56/1112 | 194/8465 | 4.05e-09 | 9.20e-08 | 5.78e-08 | 56 |
| hsa0516772 | Oral cavity | NEOLP | Kaposi sarcoma-associated herpesvirus infection | 56/1112 | 194/8465 | 4.05e-09 | 9.20e-08 | 5.78e-08 | 56 |
| hsa0516727 | Prostate | BPH | Kaposi sarcoma-associated herpesvirus infection | 69/1718 | 194/8465 | 4.22e-07 | 4.10e-06 | 2.54e-06 | 69 |
| hsa05167112 | Prostate | BPH | Kaposi sarcoma-associated herpesvirus infection | 69/1718 | 194/8465 | 4.22e-07 | 4.10e-06 | 2.54e-06 | 69 |
| Page: 1 |
Top |
Cell-cell communication analysis |
| Identification of potential cell-cell interactions between two cell types and their ligand-receptor pairs for different disease states |
| Ligand | Receptor | LRpair | Pathway | Tissue | Disease Stage |
| CLEC2B | KLRB1 | CLEC2B_KLRB1 | CLEC | Breast | ADJ |
| CLEC2B | KLRB1 | CLEC2B_KLRB1 | CLEC | Breast | DCIS |
| CLEC2B | KLRB1 | CLEC2B_KLRB1 | CLEC | Breast | Healthy |
| CLEC2B | KLRB1 | CLEC2B_KLRB1 | CLEC | Breast | IDC |
| CLEC2B | KLRB1 | CLEC2B_KLRB1 | CLEC | Breast | Precancer |
| CLEC2B | KLRB1 | CLEC2B_KLRB1 | CLEC | Cervix | ADJ |
| CLEC2B | KLRB1 | CLEC2B_KLRB1 | CLEC | Cervix | CC |
| CLEC2B | KLRB1 | CLEC2B_KLRB1 | CLEC | Cervix | Healthy |
| CLEC2B | KLRB1 | CLEC2B_KLRB1 | CLEC | Cervix | Precancer |
| CLEC2B | KLRB1 | CLEC2B_KLRB1 | CLEC | CRC | MSI-H |
| CLEC2B | KLRB1 | CLEC2B_KLRB1 | CLEC | Endometrium | ADJ |
| CLEC2B | KLRB1 | CLEC2B_KLRB1 | CLEC | Endometrium | AEH |
| CLEC2B | KLRB1 | CLEC2B_KLRB1 | CLEC | Endometrium | EEC |
| CLEC2B | KLRB1 | CLEC2B_KLRB1 | CLEC | Endometrium | Healthy |
| CLEC2B | KLRB1 | CLEC2B_KLRB1 | CLEC | Esophagus | ADJ |
| CLEC2B | KLRB1 | CLEC2B_KLRB1 | CLEC | GC | ADJ |
| CLEC2B | KLRB1 | CLEC2B_KLRB1 | CLEC | GC | GC |
| CLEC2B | KLRB1 | CLEC2B_KLRB1 | CLEC | GC | Healthy |
| CLEC2B | KLRB1 | CLEC2B_KLRB1 | CLEC | GC | Precancer |
| CLEC2B | KLRB1 | CLEC2B_KLRB1 | CLEC | HNSCC | ADJ |
| Page: 1 2 3 |
Top |
Single-cell gene regulatory network inference analysis |
| Find out the significant the regulons (TFs) and the target genes of each regulon across cell types for different disease states |
| TF | Cell Type | Tissue | Disease Stage | Target Gene | RSS | Regulon Activity |
| ∗The dot plots of a searched regulon are shown for all cell subpopulations in each disease state of each tissue based on the regulon specific score inferred using pySCENIC and by calculating the average expression. |
| Page: 1 |
Top |
Somatic mutation of malignant transformation related genes |
| Annotation of somatic variants for genes involved in malignant transformation |
| Hugo Symbol | Variant Class | Variant Classification | dbSNP RS | HGVSc | HGVSp | HGVSp Short | SWISSPROT | BIOTYPE | SIFT | PolyPhen | Tumor Sample Barcode | Tissue | Histology | Sex | Age | Stage | Therapy Types | Drugs | Outcome |
| CLEC2B | SNV | Missense_Mutation | novel | c.167N>T | p.Trp56Leu | p.W56L | Q92478 | protein_coding | deleterious(0) | probably_damaging(0.999) | TCGA-AC-A8OP-01 | Breast | breast invasive carcinoma | Female | >=65 | I/II | Unknown | Unknown | SD |
| CLEC2B | SNV | Missense_Mutation | c.434N>A | p.Arg145Lys | p.R145K | Q92478 | protein_coding | tolerated(0.37) | benign(0.115) | TCGA-AU-3779-01 | Colorectum | colon adenocarcinoma | Female | >=65 | I/II | Unknown | Unknown | SD | |
| CLEC2B | SNV | Missense_Mutation | c.368N>A | p.Cys123Tyr | p.C123Y | Q92478 | protein_coding | deleterious(0) | benign(0.326) | TCGA-AU-6004-01 | Colorectum | colon adenocarcinoma | Female | >=65 | I/II | Unknown | Unknown | SD | |
| CLEC2B | SNV | Missense_Mutation | c.117N>C | p.Trp39Cys | p.W39C | Q92478 | protein_coding | deleterious(0) | probably_damaging(0.999) | TCGA-AZ-6608-01 | Colorectum | colon adenocarcinoma | Female | <65 | III/IV | Unknown | Unknown | SD | |
| CLEC2B | SNV | Missense_Mutation | c.351N>A | p.Met117Ile | p.M117I | Q92478 | protein_coding | tolerated(0.67) | benign(0) | TCGA-G4-6320-01 | Colorectum | colon adenocarcinoma | Male | >=65 | III/IV | Chemotherapy | oxaliplatin | SD | |
| CLEC2B | SNV | Missense_Mutation | c.20N>G | p.Lys7Arg | p.K7R | Q92478 | protein_coding | tolerated(0.74) | benign(0.054) | TCGA-AG-A026-01 | Colorectum | rectum adenocarcinoma | Male | >=65 | I/II | Unknown | Unknown | PD | |
| CLEC2B | SNV | Missense_Mutation | c.296N>C | p.Lys99Thr | p.K99T | Q92478 | protein_coding | deleterious(0.02) | benign(0.278) | TCGA-F5-6814-01 | Colorectum | rectum adenocarcinoma | Male | <65 | I/II | Unknown | Unknown | SD | |
| CLEC2B | SNV | Missense_Mutation | rs774782334 | c.394G>A | p.Ala132Thr | p.A132T | Q92478 | protein_coding | deleterious(0.01) | possibly_damaging(0.674) | TCGA-A5-A0G2-01 | Endometrium | uterine corpus endometrioid carcinoma | Female | <65 | III/IV | Unknown | Unknown | SD |
| CLEC2B | SNV | Missense_Mutation | c.55A>G | p.Asn19Asp | p.N19D | Q92478 | protein_coding | deleterious(0.05) | benign(0.01) | TCGA-A5-A0G2-01 | Endometrium | uterine corpus endometrioid carcinoma | Female | <65 | III/IV | Unknown | Unknown | SD | |
| CLEC2B | SNV | Missense_Mutation | c.73G>T | p.Val25Phe | p.V25F | Q92478 | protein_coding | tolerated(0.11) | benign(0.3) | TCGA-A5-A0GB-01 | Endometrium | uterine corpus endometrioid carcinoma | Female | >=65 | I/II | Unknown | Unknown | SD |
| Page: 1 2 |
Top |
Related drugs of malignant transformation related genes |
| Identification of chemicals and drugs interact with genes involved in malignant transfromation |
| (DGIdb 4.0) |
| Entrez ID | Symbol | Category | Interaction Types | Drug Claim Name | Drug Name | PMIDs |
| Page: 1 |

Copyright 2023-Present -The University of Texas Health Science Center at Houston |