
|
|||||
|
 | |
| |
| |
| |
| |
| |
|
Gene: CLEC16A |
Gene summary for CLEC16A |
| Gene information | Species | Human | Gene symbol | CLEC16A | Gene ID | 23274 |
| Gene name | C-type lectin domain containing 16A | |
| Gene Alias | Gop-1 | |
| Cytomap | 16p13.13 | |
| Gene Type | protein-coding | GO ID | GO:0006810 | UniProtAcc | Q2KHT3 |
Top |
Malignant transformation analysis |
| Identification of the aberrant gene expression in precancerous and cancerous lesions by comparing the gene expression of stem-like cells in diseased tissues with normal stem cells |
| Entrez ID | Symbol | Replicates | Species | Organ | Tissue | Adj P-value | Log2FC | Malignancy |
| 23274 | CLEC16A | CCI_2 | Human | Cervix | CC | 5.23e-03 | 5.19e-01 | 0.5249 |
| 23274 | CLEC16A | CCI_3 | Human | Cervix | CC | 5.62e-11 | 7.26e-01 | 0.516 |
| 23274 | CLEC16A | HTA11_347_2000001011 | Human | Colorectum | AD | 6.44e-09 | 5.49e-01 | -0.1954 |
| 23274 | CLEC16A | HTA11_1391_2000001011 | Human | Colorectum | AD | 1.49e-02 | 4.99e-01 | -0.059 |
| 23274 | CLEC16A | HTA11_99999965104_69814 | Human | Colorectum | MSS | 3.15e-02 | 5.44e-01 | 0.281 |
| 23274 | CLEC16A | A015-C-203 | Human | Colorectum | FAP | 8.60e-18 | -3.33e-01 | -0.1294 |
| 23274 | CLEC16A | A015-C-204 | Human | Colorectum | FAP | 1.54e-08 | -4.30e-01 | -0.0228 |
| 23274 | CLEC16A | A014-C-040 | Human | Colorectum | FAP | 2.61e-02 | -2.72e-01 | -0.1184 |
| 23274 | CLEC16A | A002-C-201 | Human | Colorectum | FAP | 3.98e-08 | -2.76e-01 | 0.0324 |
| 23274 | CLEC16A | A001-C-119 | Human | Colorectum | FAP | 4.21e-06 | -4.10e-01 | -0.1557 |
| 23274 | CLEC16A | A001-C-108 | Human | Colorectum | FAP | 2.82e-11 | -2.77e-01 | -0.0272 |
| 23274 | CLEC16A | A002-C-205 | Human | Colorectum | FAP | 7.29e-17 | -4.24e-01 | -0.1236 |
| 23274 | CLEC16A | A001-C-104 | Human | Colorectum | FAP | 6.17e-03 | -2.20e-01 | 0.0184 |
| 23274 | CLEC16A | A015-C-005 | Human | Colorectum | FAP | 2.99e-03 | -2.67e-01 | -0.0336 |
| 23274 | CLEC16A | A015-C-006 | Human | Colorectum | FAP | 2.28e-10 | -3.29e-01 | -0.0994 |
| 23274 | CLEC16A | A015-C-106 | Human | Colorectum | FAP | 1.96e-07 | -2.15e-01 | -0.0511 |
| 23274 | CLEC16A | A002-C-114 | Human | Colorectum | FAP | 1.15e-13 | -3.77e-01 | -0.1561 |
| 23274 | CLEC16A | A015-C-104 | Human | Colorectum | FAP | 9.59e-24 | -4.46e-01 | -0.1899 |
| 23274 | CLEC16A | A001-C-014 | Human | Colorectum | FAP | 3.04e-13 | -3.32e-01 | 0.0135 |
| 23274 | CLEC16A | A002-C-016 | Human | Colorectum | FAP | 2.68e-15 | -3.18e-01 | 0.0521 |
| Page: 1 2 3 4 5 6 |
| Tissue | Expression Dynamics | Abbreviation |
| Cervix | 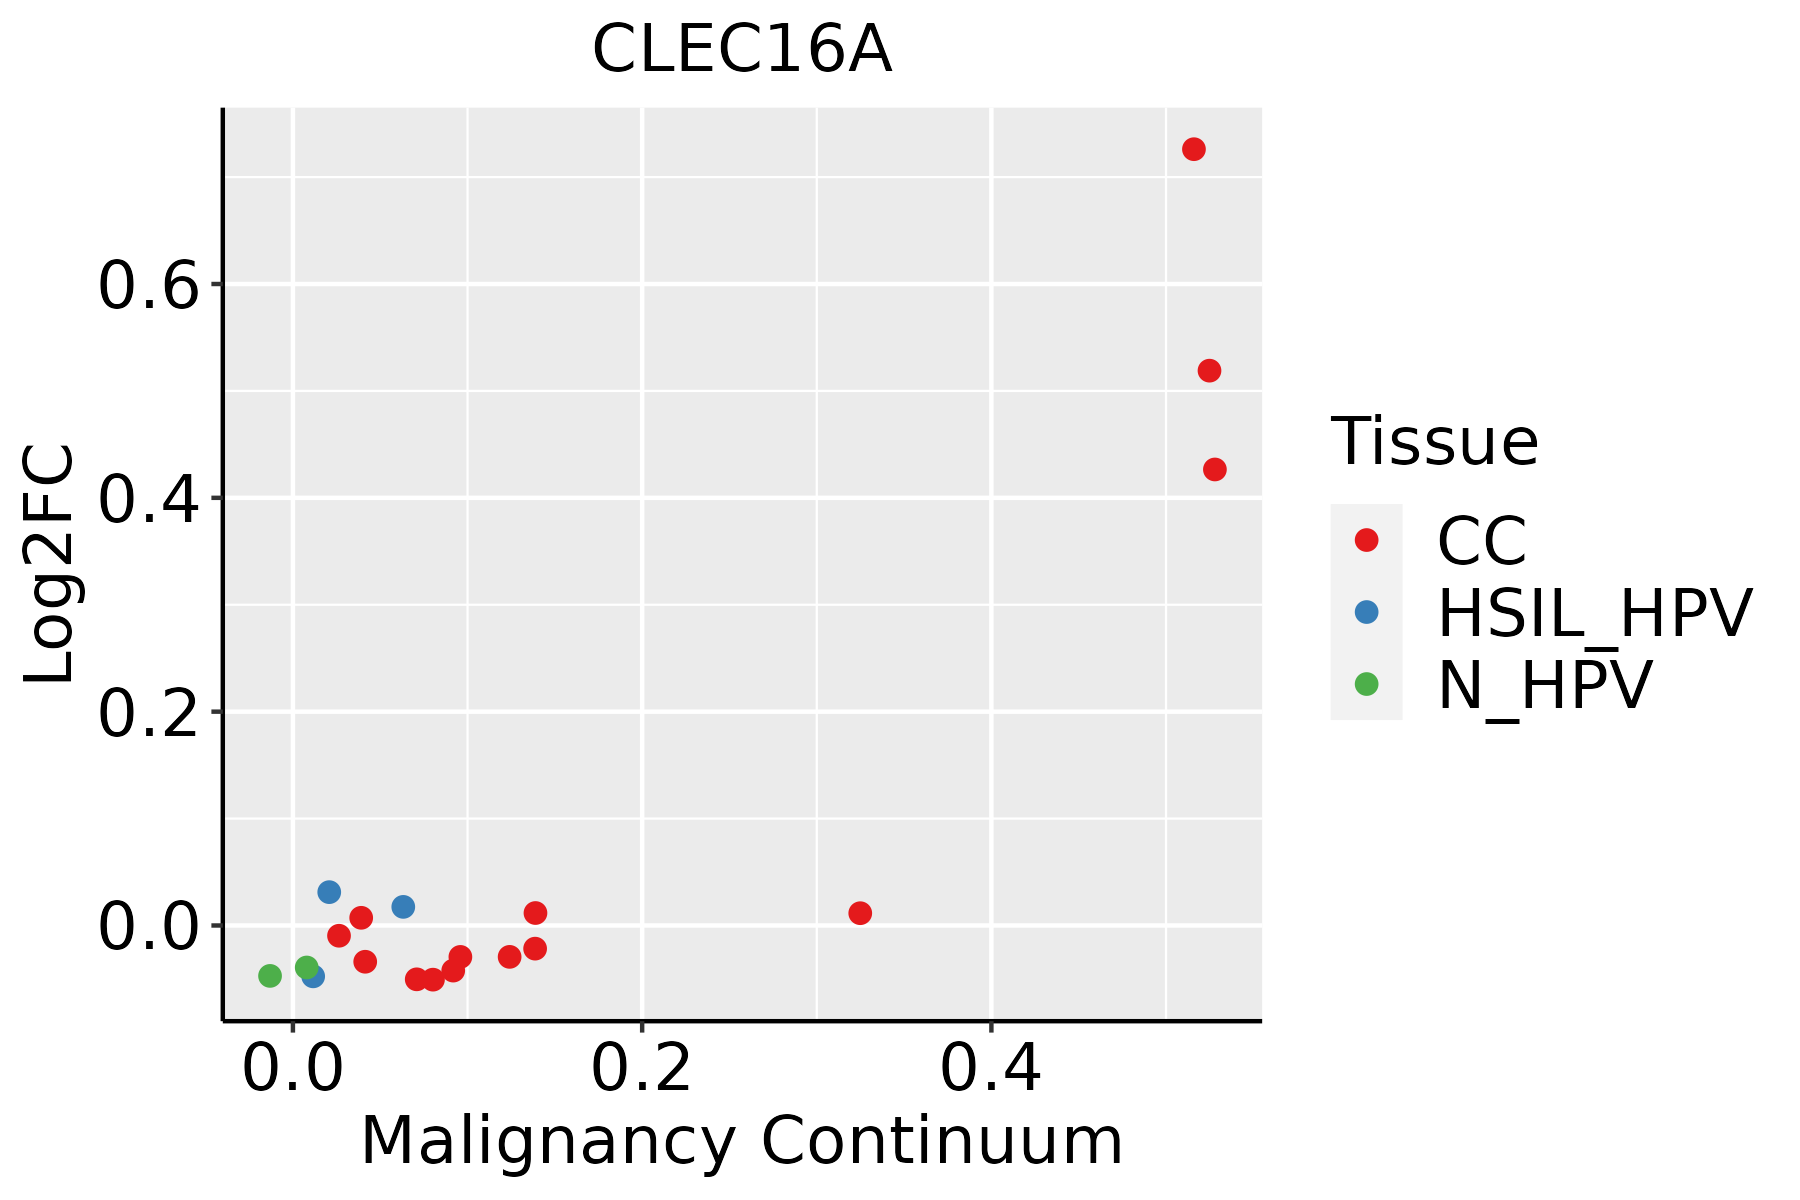 | CC: Cervix cancer |
| HSIL_HPV: HPV-infected high-grade squamous intraepithelial lesions | ||
| N_HPV: HPV-infected normal cervix | ||
| Colorectum (GSE201348) |  | FAP: Familial adenomatous polyposis |
| CRC: Colorectal cancer | ||
| Colorectum (HTA11) |  | AD: Adenomas |
| SER: Sessile serrated lesions | ||
| MSI-H: Microsatellite-high colorectal cancer | ||
| MSS: Microsatellite stable colorectal cancer | ||
| Esophagus |  | ESCC: Esophageal squamous cell carcinoma |
| HGIN: High-grade intraepithelial neoplasias | ||
| LGIN: Low-grade intraepithelial neoplasias | ||
| Lung | 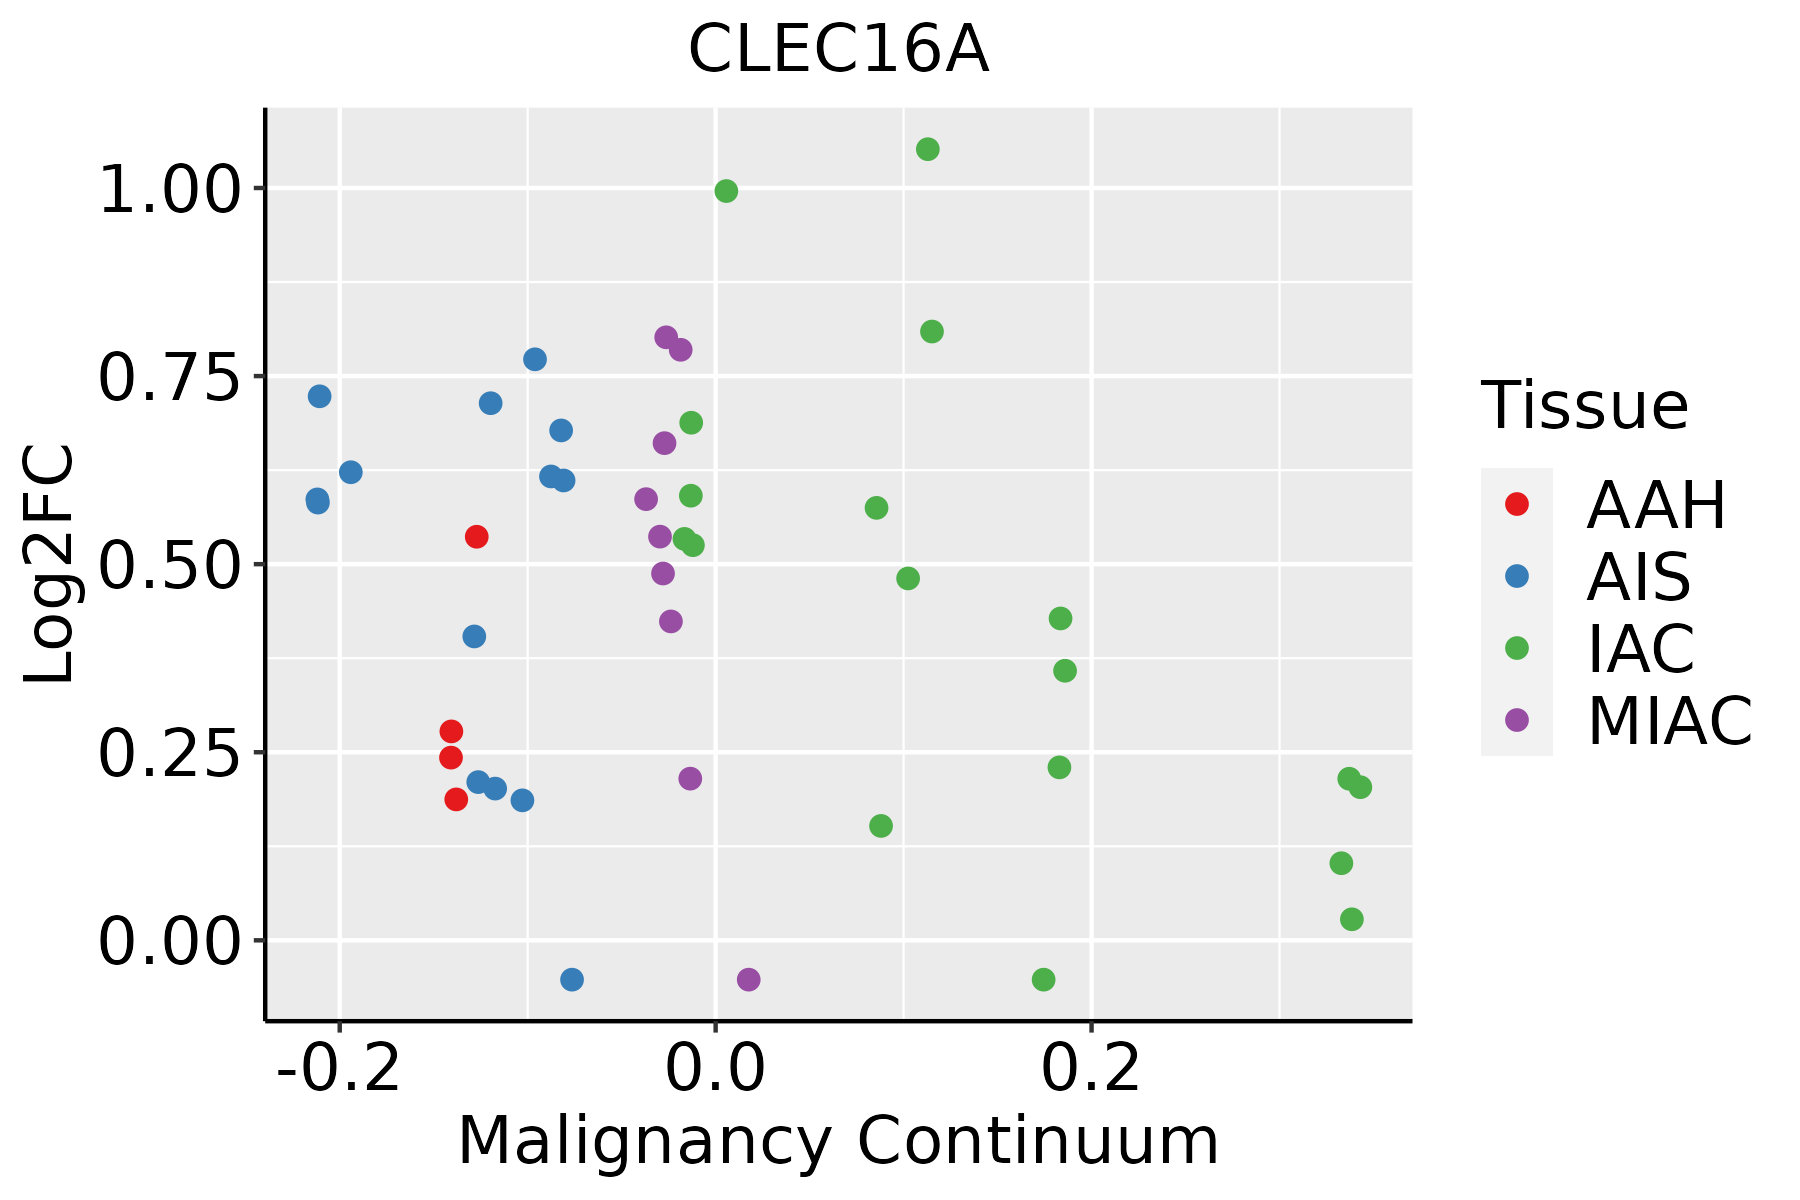 | AAH: Atypical adenomatous hyperplasia |
| AIS: Adenocarcinoma in situ | ||
| IAC: Invasive lung adenocarcinoma | ||
| MIA: Minimally invasive adenocarcinoma | ||
| Thyroid | 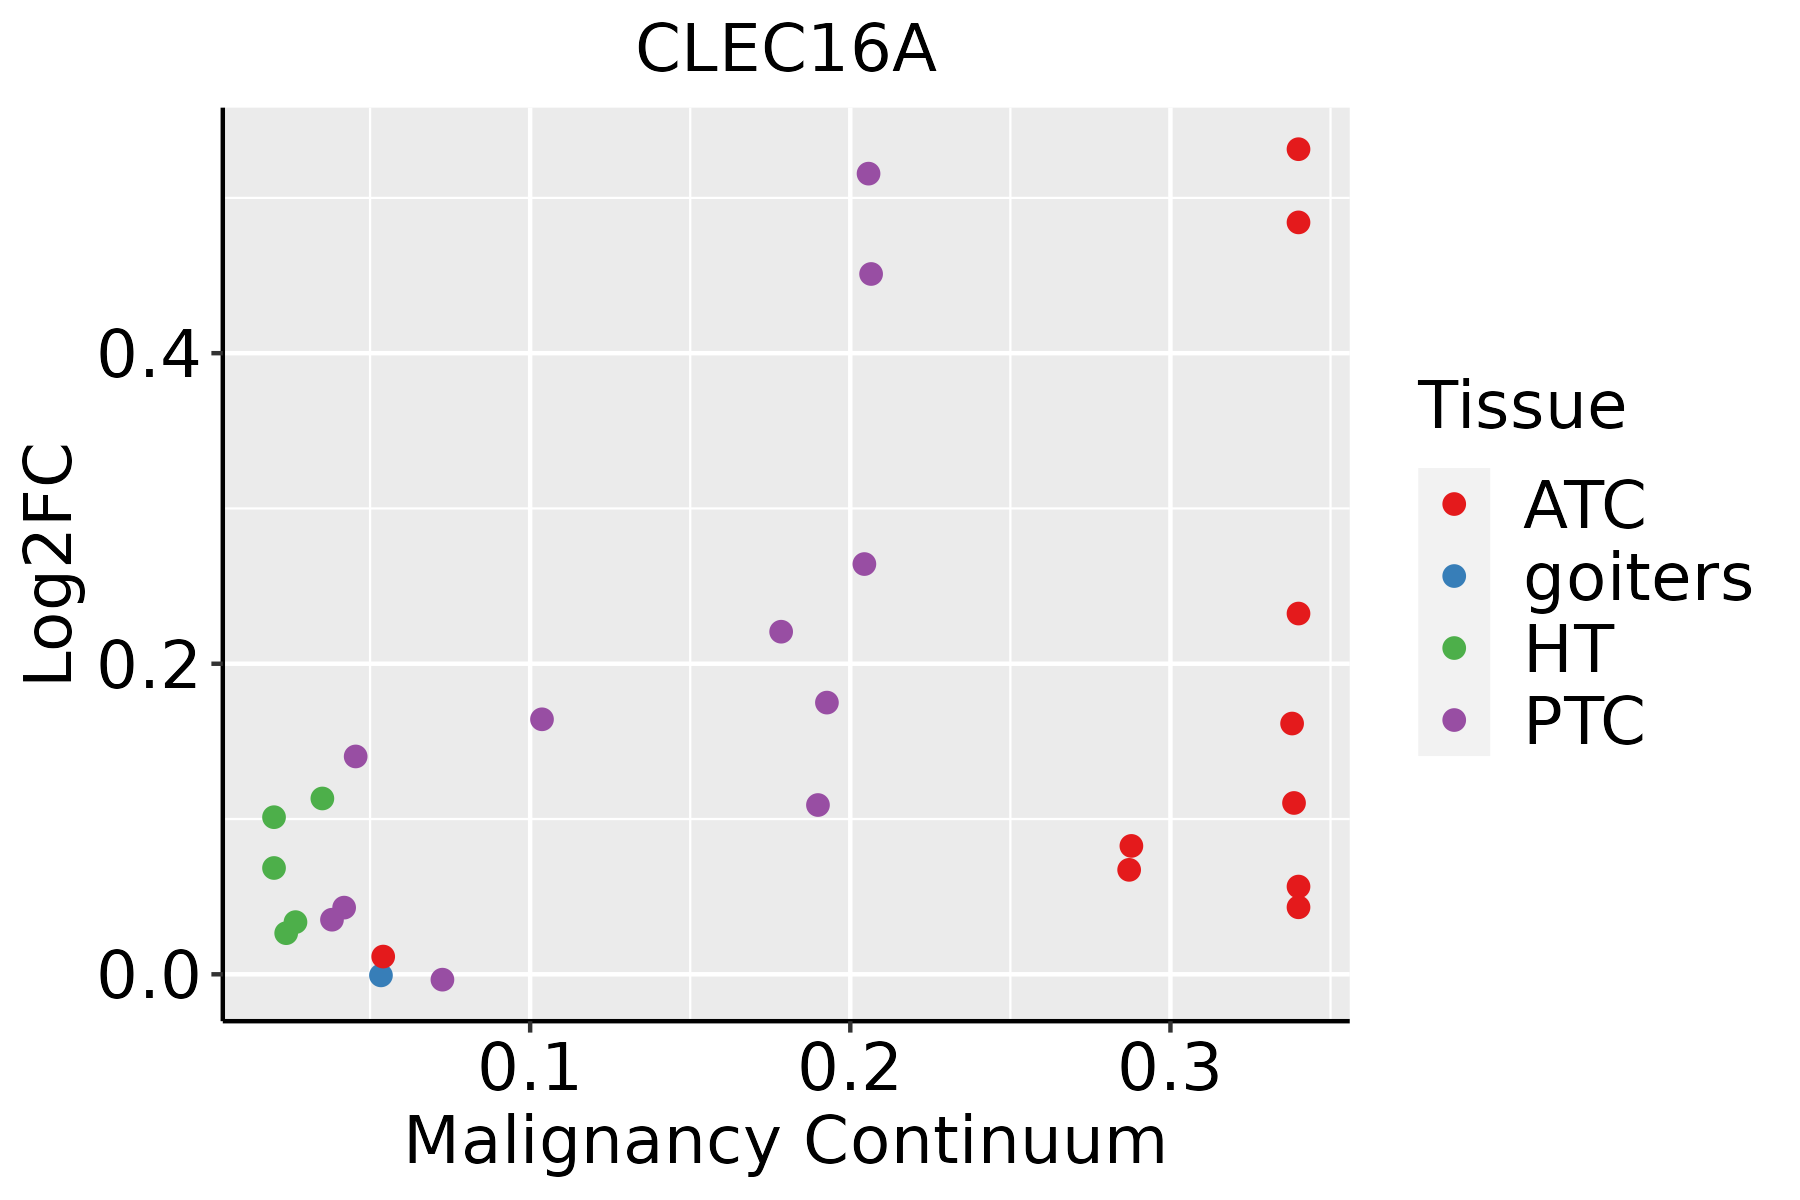 | ATC: Anaplastic thyroid cancer |
| HT: Hashimoto's thyroiditis | ||
| PTC: Papillary thyroid cancer |
| ∗log2FC in expression of this searched gene in stem-like cells from each diseased tissue sample relative to stem-like cells in normal samples in each tissue plotted against the malignancy continuum. Samples are colored based on if they are from different disease stage. |
Top |
Malignant transformation related pathway analysis |
| Find out the enriched GO biological processes and KEGG pathways involved in transition from healthy to precancer to cancer |
| Tissue | Disease Stage | Enriched GO biological Processes |
| Colorectum | AD |  |
| Colorectum | SER |  |
| Colorectum | MSS |  |
| Colorectum | MSI-H |  |
| Colorectum | FAP |  |
| ∗Top 15 enriched GO BP terms are showed in the bar plot of each disease state in each tissue. Each row represents a significant GO biological process which is colored according to the -log10(p.adjust). |
| Page: 1 2 3 4 5 6 7 8 9 |
| GO ID | Tissue | Disease Stage | Description | Gene Ratio | Bg Ratio | pvalue | p.adjust | Count |
| GO:007149610 | Cervix | CC | cellular response to external stimulus | 78/2311 | 320/18723 | 1.82e-09 | 1.98e-07 | 78 |
| GO:003133010 | Cervix | CC | negative regulation of cellular catabolic process | 63/2311 | 262/18723 | 1.10e-07 | 5.68e-06 | 63 |
| GO:00316689 | Cervix | CC | cellular response to extracellular stimulus | 59/2311 | 246/18723 | 3.03e-07 | 1.24e-05 | 59 |
| GO:000989510 | Cervix | CC | negative regulation of catabolic process | 69/2311 | 320/18723 | 2.15e-06 | 6.55e-05 | 69 |
| GO:003166710 | Cervix | CC | response to nutrient levels | 92/2311 | 474/18723 | 5.80e-06 | 1.42e-04 | 92 |
| GO:00092678 | Cervix | CC | cellular response to starvation | 39/2311 | 156/18723 | 1.04e-05 | 2.32e-04 | 39 |
| GO:00425948 | Cervix | CC | response to starvation | 46/2311 | 197/18723 | 1.24e-05 | 2.59e-04 | 46 |
| GO:00316698 | Cervix | CC | cellular response to nutrient levels | 49/2311 | 215/18723 | 1.32e-05 | 2.68e-04 | 49 |
| GO:002241110 | Cervix | CC | cellular component disassembly | 83/2311 | 443/18723 | 6.04e-05 | 8.68e-04 | 83 |
| GO:00162367 | Cervix | CC | macroautophagy | 58/2311 | 291/18723 | 1.40e-04 | 1.70e-03 | 58 |
| GO:00161977 | Cervix | CC | endosomal transport | 48/2311 | 230/18723 | 1.65e-04 | 1.97e-03 | 48 |
| GO:00105067 | Cervix | CC | regulation of autophagy | 61/2311 | 317/18723 | 2.61e-04 | 2.87e-03 | 61 |
| GO:00070347 | Cervix | CC | vacuolar transport | 34/2311 | 157/18723 | 7.03e-04 | 6.40e-03 | 34 |
| GO:00070416 | Cervix | CC | lysosomal transport | 24/2311 | 114/18723 | 5.81e-03 | 3.33e-02 | 24 |
| GO:00329847 | Cervix | CC | protein-containing complex disassembly | 41/2311 | 224/18723 | 6.13e-03 | 3.48e-02 | 41 |
| GO:0009895 | Colorectum | AD | negative regulation of catabolic process | 124/3918 | 320/18723 | 1.66e-13 | 3.35e-11 | 124 |
| GO:0031330 | Colorectum | AD | negative regulation of cellular catabolic process | 104/3918 | 262/18723 | 2.66e-12 | 3.96e-10 | 104 |
| GO:0016197 | Colorectum | AD | endosomal transport | 90/3918 | 230/18723 | 1.88e-10 | 1.73e-08 | 90 |
| GO:0022411 | Colorectum | AD | cellular component disassembly | 147/3918 | 443/18723 | 8.53e-10 | 6.76e-08 | 147 |
| GO:0010506 | Colorectum | AD | regulation of autophagy | 111/3918 | 317/18723 | 3.57e-09 | 2.35e-07 | 111 |
| Page: 1 2 3 4 5 6 7 8 9 |
| Pathway ID | Tissue | Disease Stage | Description | Gene Ratio | Bg Ratio | pvalue | p.adjust | qvalue | Count |
| Page: 1 |
Top |
Cell-cell communication analysis |
| Identification of potential cell-cell interactions between two cell types and their ligand-receptor pairs for different disease states |
| Ligand | Receptor | LRpair | Pathway | Tissue | Disease Stage |
| Page: 1 |
Top |
Single-cell gene regulatory network inference analysis |
| Find out the significant the regulons (TFs) and the target genes of each regulon across cell types for different disease states |
| TF | Cell Type | Tissue | Disease Stage | Target Gene | RSS | Regulon Activity |
| ∗The dot plots of a searched regulon are shown for all cell subpopulations in each disease state of each tissue based on the regulon specific score inferred using pySCENIC and by calculating the average expression. |
| Page: 1 |
Top |
Somatic mutation of malignant transformation related genes |
| Annotation of somatic variants for genes involved in malignant transformation |
| Hugo Symbol | Variant Class | Variant Classification | dbSNP RS | HGVSc | HGVSp | HGVSp Short | SWISSPROT | BIOTYPE | SIFT | PolyPhen | Tumor Sample Barcode | Tissue | Histology | Sex | Age | Stage | Therapy Types | Drugs | Outcome |
| CLEC16A | SNV | Missense_Mutation | rs750171153 | c.1802N>A | p.Arg601Gln | p.R601Q | Q2KHT3 | protein_coding | deleterious(0.05) | possibly_damaging(0.666) | TCGA-A2-A0EV-01 | Breast | breast invasive carcinoma | Female | >=65 | I/II | Unknown | Unknown | SD |
| CLEC16A | SNV | Missense_Mutation | c.974A>T | p.His325Leu | p.H325L | Q2KHT3 | protein_coding | tolerated(0.1) | probably_damaging(0.991) | TCGA-A8-A06Z-01 | Breast | breast invasive carcinoma | Female | >=65 | I/II | Unknown | Unknown | SD | |
| CLEC16A | SNV | Missense_Mutation | novel | c.1799T>C | p.Val600Ala | p.V600A | Q2KHT3 | protein_coding | tolerated(0.05) | benign(0.03) | TCGA-AN-A046-01 | Breast | breast invasive carcinoma | Female | >=65 | I/II | Unknown | Unknown | SD |
| CLEC16A | SNV | Missense_Mutation | c.532N>C | p.Phe178Leu | p.F178L | Q2KHT3 | protein_coding | tolerated(0.07) | probably_damaging(0.992) | TCGA-AN-A0AK-01 | Breast | breast invasive carcinoma | Female | >=65 | I/II | Unknown | Unknown | SD | |
| CLEC16A | SNV | Missense_Mutation | novel | c.2806N>T | p.Asp936Tyr | p.D936Y | Q2KHT3 | protein_coding | deleterious(0.01) | probably_damaging(0.994) | TCGA-AN-A0AK-01 | Breast | breast invasive carcinoma | Female | >=65 | I/II | Unknown | Unknown | SD |
| CLEC16A | SNV | Missense_Mutation | c.2969N>T | p.Thr990Ile | p.T990I | Q2KHT3 | protein_coding | deleterious_low_confidence(0) | probably_damaging(0.979) | TCGA-AN-A0AK-01 | Breast | breast invasive carcinoma | Female | >=65 | I/II | Unknown | Unknown | SD | |
| CLEC16A | SNV | Missense_Mutation | rs779266510 | c.2482N>A | p.Asp828Asn | p.D828N | Q2KHT3 | protein_coding | tolerated(0.11) | probably_damaging(0.989) | TCGA-BH-A0HF-01 | Breast | breast invasive carcinoma | Female | >=65 | I/II | Hormone Therapy | arimidex | SD |
| CLEC16A | SNV | Missense_Mutation | rs776955669 | c.367N>A | p.Val123Ile | p.V123I | Q2KHT3 | protein_coding | tolerated(0.17) | probably_damaging(0.995) | TCGA-D8-A1J8-01 | Breast | breast invasive carcinoma | Female | >=65 | I/II | Hormone Therapy | nolvadex | SD |
| CLEC16A | SNV | Missense_Mutation | rs764755955 | c.2042N>A | p.Arg681Gln | p.R681Q | Q2KHT3 | protein_coding | tolerated(1) | benign(0.001) | TCGA-E2-A1IK-01 | Breast | breast invasive carcinoma | Female | >=65 | I/II | Hormone Therapy | arimidex | SD |
| CLEC16A | SNV | Missense_Mutation | rs764755955 | c.2042G>A | p.Arg681Gln | p.R681Q | Q2KHT3 | protein_coding | tolerated(1) | benign(0.001) | TCGA-OL-A66L-01 | Breast | breast invasive carcinoma | Female | >=65 | I/II | Unknown | Unknown | SD |
| Page: 1 2 3 4 5 6 7 8 9 10 11 12 13 |
Top |
Related drugs of malignant transformation related genes |
| Identification of chemicals and drugs interact with genes involved in malignant transfromation |
| (DGIdb 4.0) |
| Entrez ID | Symbol | Category | Interaction Types | Drug Claim Name | Drug Name | PMIDs |
| Page: 1 |

Copyright 2023-Present -The University of Texas Health Science Center at Houston |