
|
|||||
|
 | |
| |
| |
| |
| |
| |
|
Gene: CLEC11A |
Gene summary for CLEC11A |
| Gene information | Species | Human | Gene symbol | CLEC11A | Gene ID | 6320 |
| Gene name | C-type lectin domain containing 11A | |
| Gene Alias | CLECSF3 | |
| Cytomap | 19q13.33 | |
| Gene Type | protein-coding | GO ID | GO:0001503 | UniProtAcc | Q9Y240 |
Top |
Malignant transformation analysis |
| Identification of the aberrant gene expression in precancerous and cancerous lesions by comparing the gene expression of stem-like cells in diseased tissues with normal stem cells |
| Entrez ID | Symbol | Replicates | Species | Organ | Tissue | Adj P-value | Log2FC | Malignancy |
| 6320 | CLEC11A | AEH-subject1 | Human | Endometrium | AEH | 2.60e-29 | -6.69e-01 | -0.3059 |
| 6320 | CLEC11A | AEH-subject2 | Human | Endometrium | AEH | 9.27e-33 | -6.46e-01 | -0.2525 |
| 6320 | CLEC11A | AEH-subject3 | Human | Endometrium | AEH | 1.38e-29 | -6.36e-01 | -0.2576 |
| 6320 | CLEC11A | AEH-subject4 | Human | Endometrium | AEH | 9.59e-24 | -6.23e-01 | -0.2657 |
| 6320 | CLEC11A | AEH-subject5 | Human | Endometrium | AEH | 1.08e-39 | -7.14e-01 | -0.2953 |
| 6320 | CLEC11A | EEC-subject1 | Human | Endometrium | EEC | 4.66e-41 | -7.04e-01 | -0.2682 |
| 6320 | CLEC11A | EEC-subject2 | Human | Endometrium | EEC | 6.20e-33 | -6.63e-01 | -0.2607 |
| 6320 | CLEC11A | EEC-subject3 | Human | Endometrium | EEC | 1.44e-47 | -6.95e-01 | -0.2525 |
| 6320 | CLEC11A | EEC-subject4 | Human | Endometrium | EEC | 1.69e-23 | -6.18e-01 | -0.2571 |
| 6320 | CLEC11A | EEC-subject5 | Human | Endometrium | EEC | 2.09e-35 | -6.67e-01 | -0.249 |
| 6320 | CLEC11A | GSM5276934 | Human | Endometrium | EEC | 2.34e-04 | -2.93e-01 | -0.0913 |
| 6320 | CLEC11A | GSM5276935 | Human | Endometrium | EEC | 2.54e-38 | -6.95e-01 | -0.123 |
| 6320 | CLEC11A | GSM5276937 | Human | Endometrium | EEC | 8.66e-03 | -3.11e-01 | -0.0897 |
| 6320 | CLEC11A | GSM6177620_NYU_UCEC1_lib1_lib1 | Human | Endometrium | EEC | 6.61e-35 | -7.15e-01 | -0.1869 |
| 6320 | CLEC11A | GSM6177620_NYU_UCEC1_lib2_lib2 | Human | Endometrium | EEC | 8.52e-31 | -6.87e-01 | -0.1875 |
| 6320 | CLEC11A | GSM6177620_NYU_UCEC1_lib3_lib3 | Human | Endometrium | EEC | 2.94e-33 | -6.76e-01 | -0.1883 |
| 6320 | CLEC11A | GSM6177621_NYU_UCEC2_lib1_lib1 | Human | Endometrium | EEC | 3.61e-45 | -6.95e-01 | -0.1934 |
| 6320 | CLEC11A | GSM6177622_NYU_UCEC3_lib1_lib1 | Human | Endometrium | EEC | 9.54e-47 | -7.16e-01 | -0.1917 |
| 6320 | CLEC11A | GSM6177622_NYU_UCEC3_lib2_lib2 | Human | Endometrium | EEC | 9.99e-45 | -6.69e-01 | -0.1916 |
| 6320 | CLEC11A | GSM6177623_NYU_UCEC3_Vis | Human | Endometrium | EEC | 2.16e-17 | -5.76e-01 | -0.1269 |
| Page: 1 2 3 4 5 6 |
| Tissue | Expression Dynamics | Abbreviation |
| Endometrium | 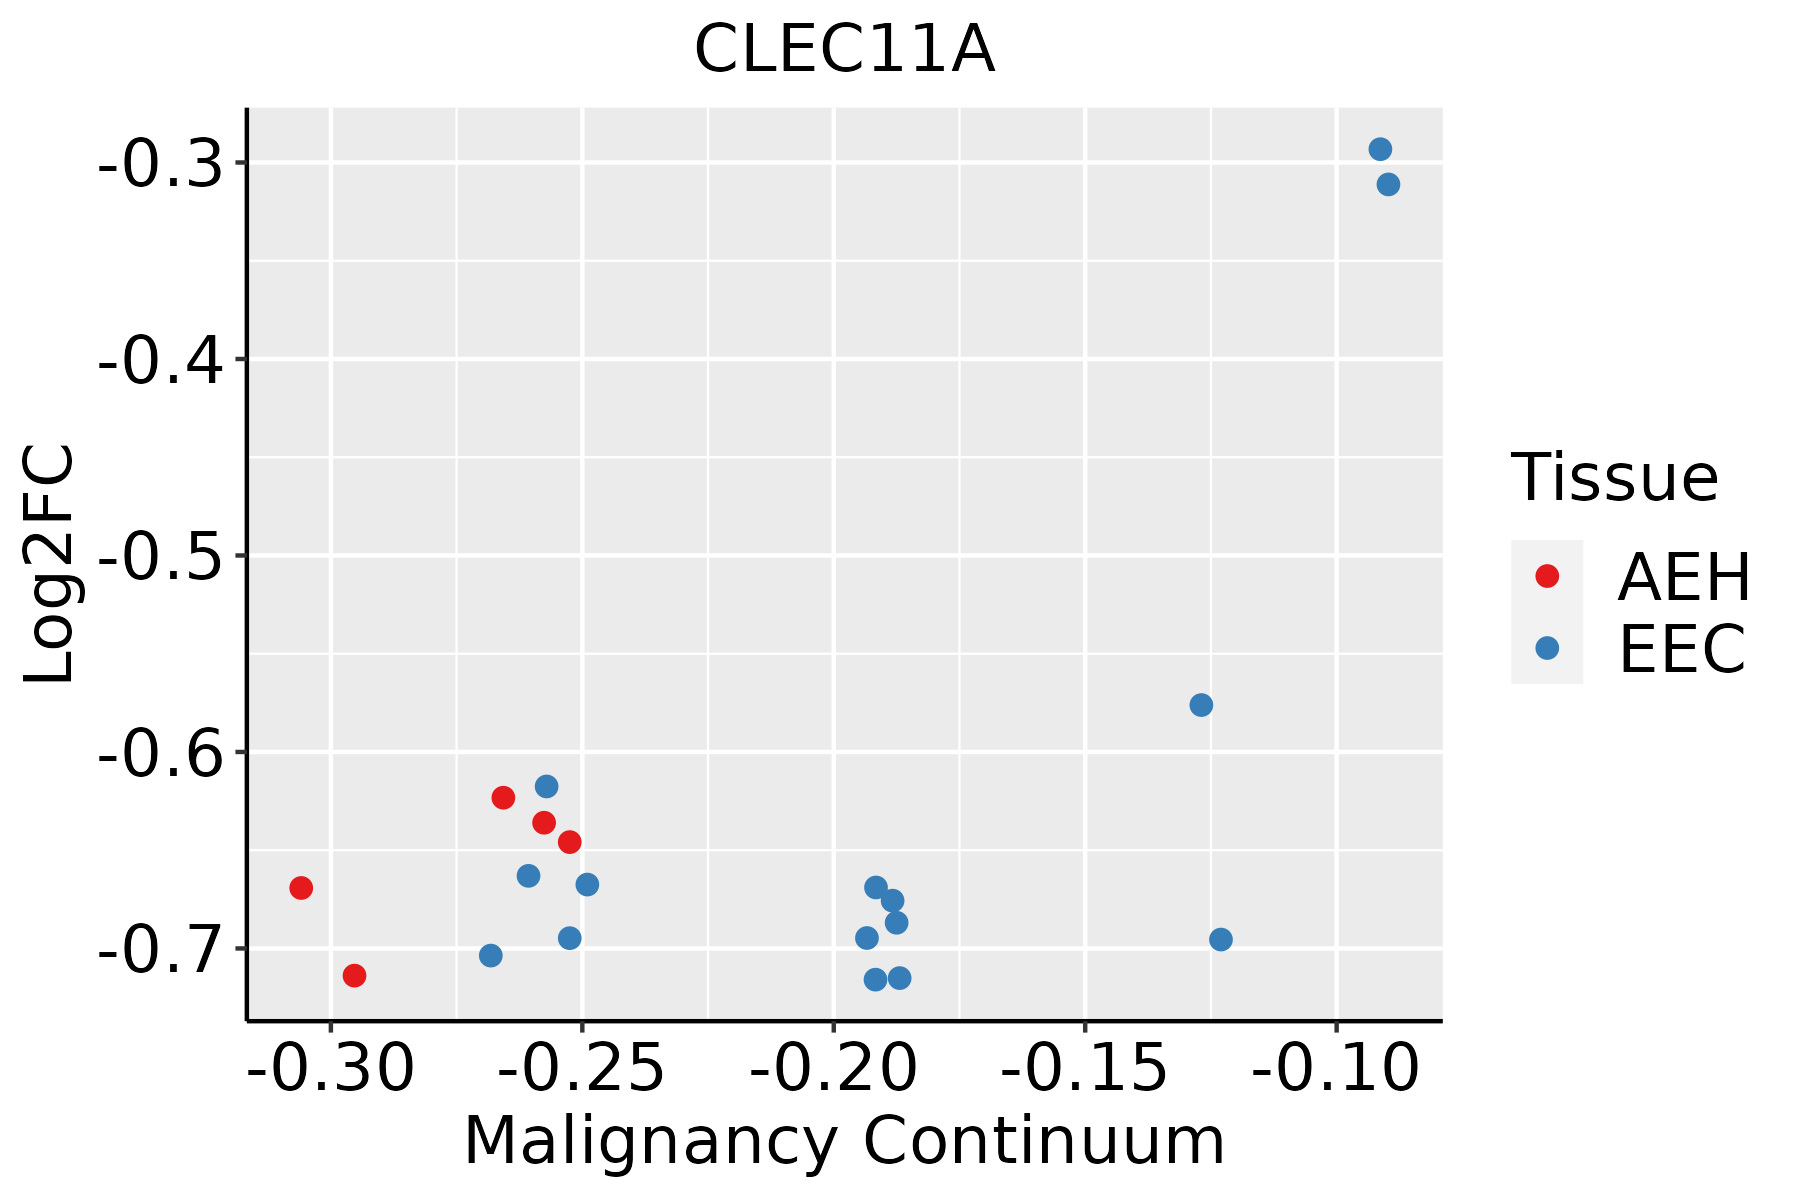 | AEH: Atypical endometrial hyperplasia |
| EEC: Endometrioid Cancer | ||
| Esophagus | 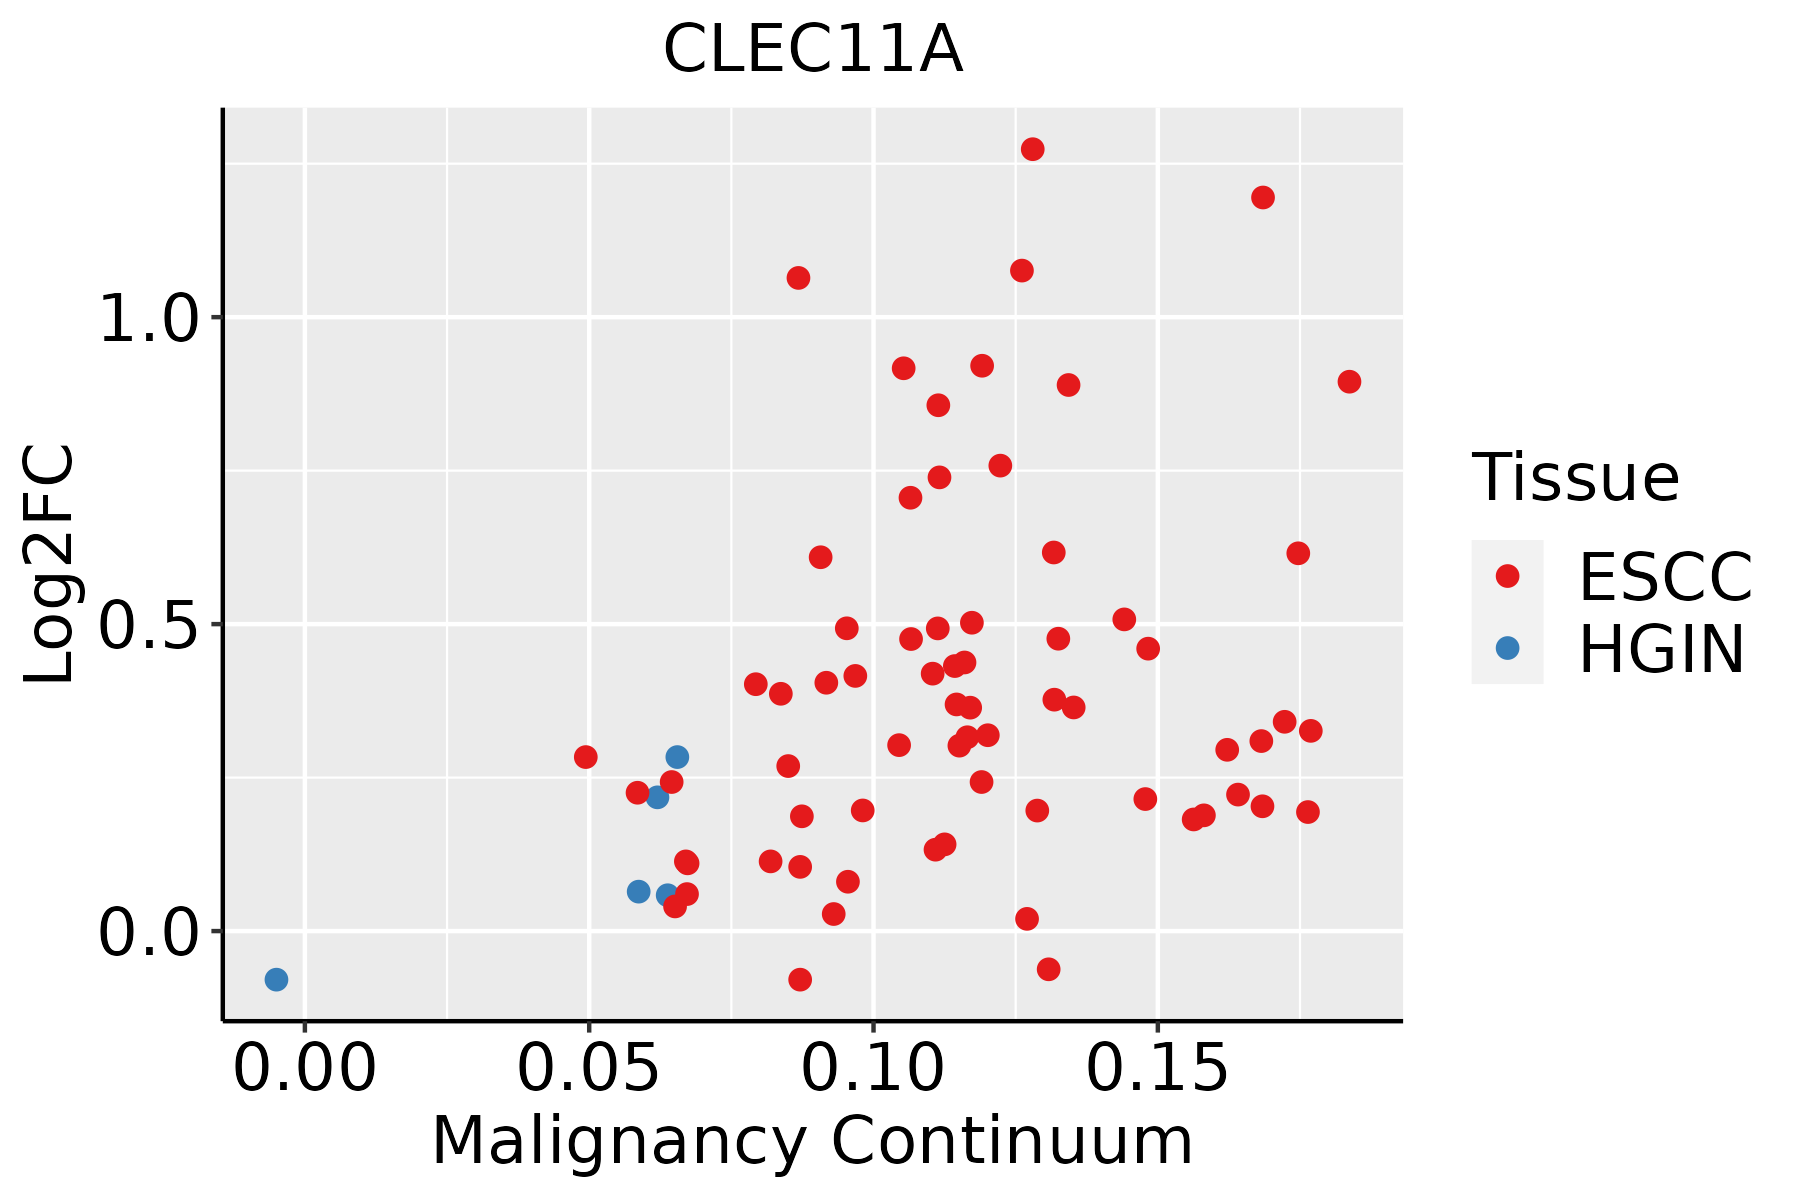 | ESCC: Esophageal squamous cell carcinoma |
| HGIN: High-grade intraepithelial neoplasias | ||
| LGIN: Low-grade intraepithelial neoplasias | ||
| Liver |  | HCC: Hepatocellular carcinoma |
| NAFLD: Non-alcoholic fatty liver disease | ||
| Oral Cavity | 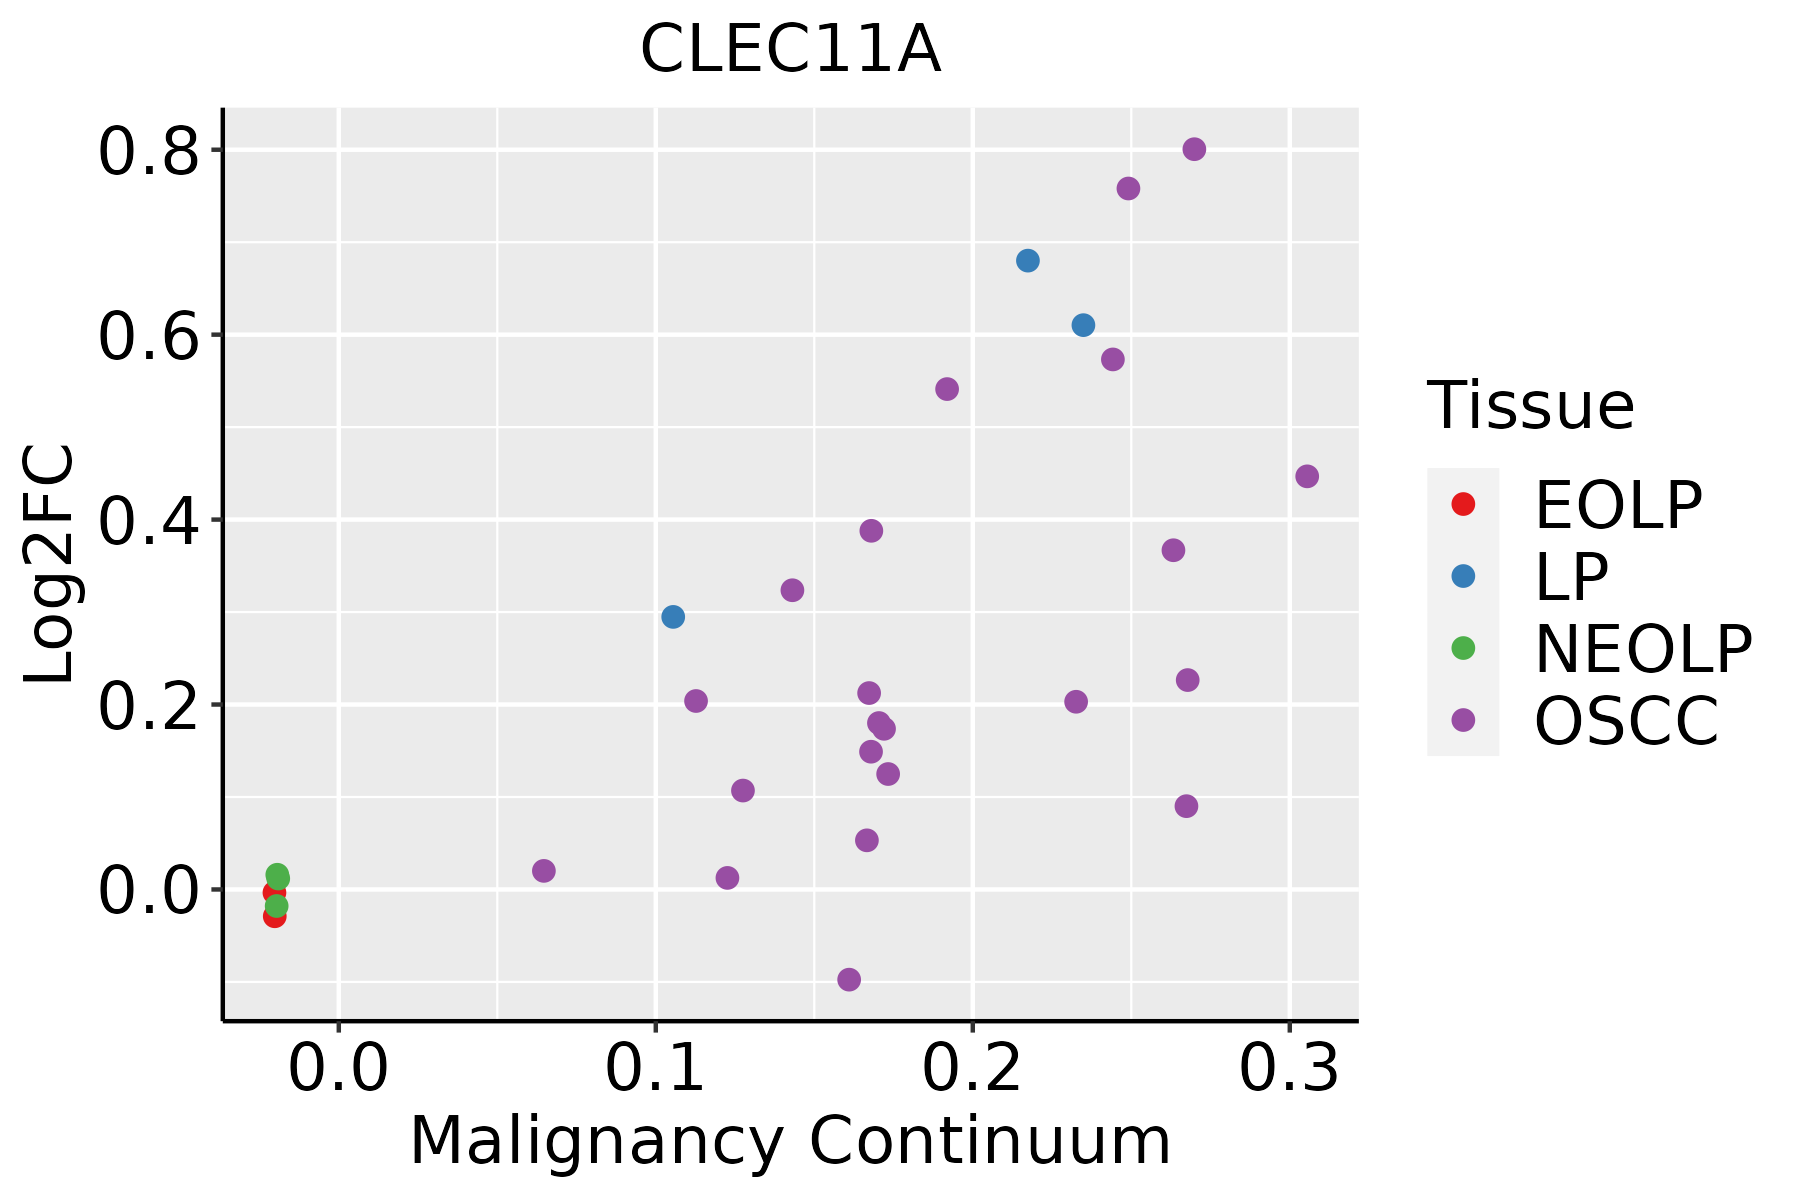 | EOLP: Erosive Oral lichen planus |
| LP: leukoplakia | ||
| NEOLP: Non-erosive oral lichen planus | ||
| OSCC: Oral squamous cell carcinoma | ||
| Thyroid | 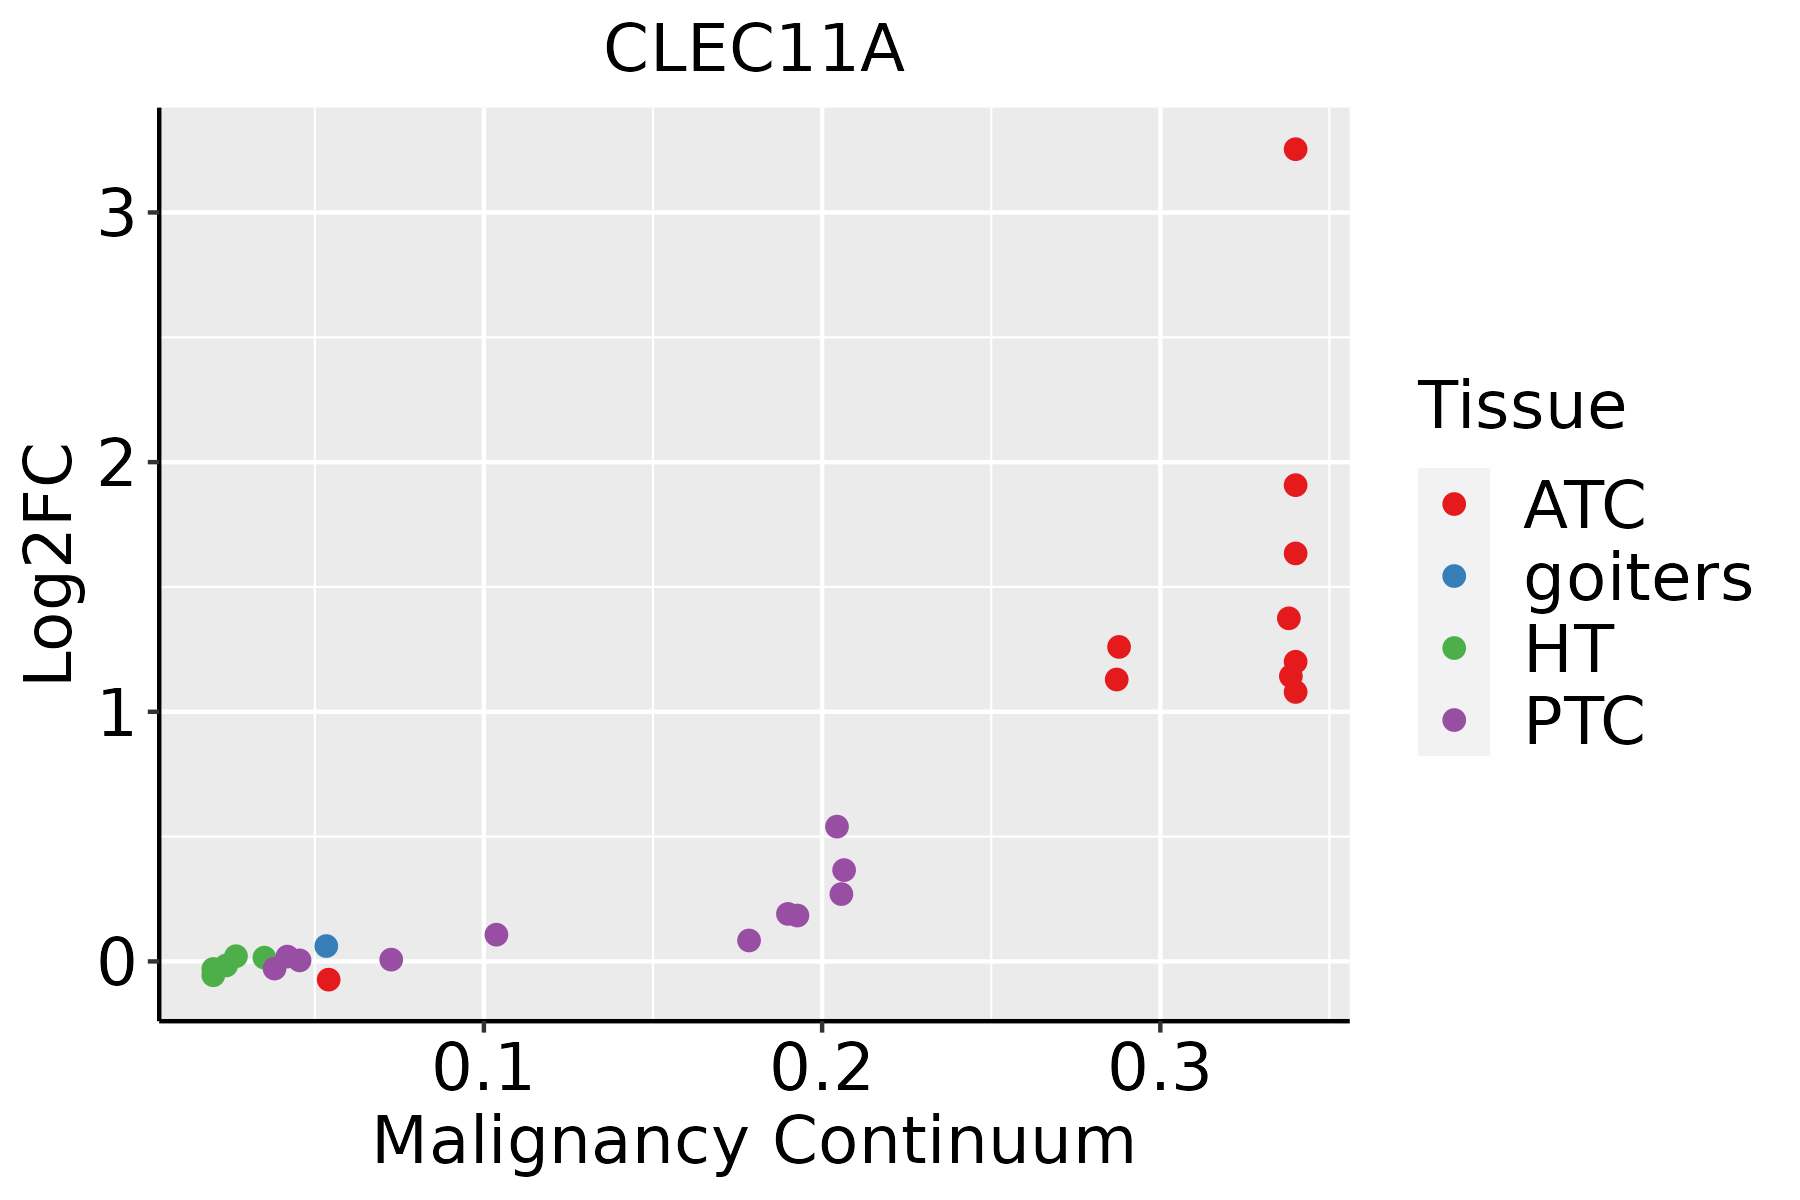 | ATC: Anaplastic thyroid cancer |
| HT: Hashimoto's thyroiditis | ||
| PTC: Papillary thyroid cancer |
| ∗log2FC in expression of this searched gene in stem-like cells from each diseased tissue sample relative to stem-like cells in normal samples in each tissue plotted against the malignancy continuum. Samples are colored based on if they are from different disease stage. |
Top |
Malignant transformation related pathway analysis |
| Find out the enriched GO biological processes and KEGG pathways involved in transition from healthy to precancer to cancer |
| Tissue | Disease Stage | Enriched GO biological Processes |
| Colorectum | AD |  |
| Colorectum | SER |  |
| Colorectum | MSS |  |
| Colorectum | MSI-H |  |
| Colorectum | FAP |  |
| ∗Top 15 enriched GO BP terms are showed in the bar plot of each disease state in each tissue. Each row represents a significant GO biological process which is colored according to the -log10(p.adjust). |
| Page: 1 2 3 4 5 6 7 8 9 |
| GO ID | Tissue | Disease Stage | Description | Gene Ratio | Bg Ratio | pvalue | p.adjust | Count |
| GO:00015038 | Endometrium | AEH | ossification | 78/2100 | 408/18723 | 1.54e-06 | 4.85e-05 | 78 |
| GO:000150313 | Endometrium | EEC | ossification | 79/2168 | 408/18723 | 2.72e-06 | 7.67e-05 | 79 |
| GO:000150317 | Esophagus | ESCC | ossification | 232/8552 | 408/18723 | 3.00e-06 | 3.40e-05 | 232 |
| GO:00015035 | Liver | Cirrhotic | ossification | 127/4634 | 408/18723 | 1.89e-03 | 1.19e-02 | 127 |
| GO:000150310 | Oral cavity | OSCC | ossification | 203/7305 | 408/18723 | 5.54e-06 | 6.19e-05 | 203 |
| GO:000150315 | Oral cavity | LP | ossification | 123/4623 | 408/18723 | 6.55e-03 | 3.84e-02 | 123 |
| GO:0001503110 | Thyroid | PTC | ossification | 176/5968 | 408/18723 | 9.26e-07 | 1.40e-05 | 176 |
| GO:000150332 | Thyroid | ATC | ossification | 206/6293 | 408/18723 | 9.23e-13 | 3.95e-11 | 206 |
| Page: 1 |
| Pathway ID | Tissue | Disease Stage | Description | Gene Ratio | Bg Ratio | pvalue | p.adjust | qvalue | Count |
| Page: 1 |
Top |
Cell-cell communication analysis |
| Identification of potential cell-cell interactions between two cell types and their ligand-receptor pairs for different disease states |
| Ligand | Receptor | LRpair | Pathway | Tissue | Disease Stage |
| Page: 1 |
Top |
Single-cell gene regulatory network inference analysis |
| Find out the significant the regulons (TFs) and the target genes of each regulon across cell types for different disease states |
| TF | Cell Type | Tissue | Disease Stage | Target Gene | RSS | Regulon Activity |
| ∗The dot plots of a searched regulon are shown for all cell subpopulations in each disease state of each tissue based on the regulon specific score inferred using pySCENIC and by calculating the average expression. |
| Page: 1 |
Top |
Somatic mutation of malignant transformation related genes |
| Annotation of somatic variants for genes involved in malignant transformation |
| Hugo Symbol | Variant Class | Variant Classification | dbSNP RS | HGVSc | HGVSp | HGVSp Short | SWISSPROT | BIOTYPE | SIFT | PolyPhen | Tumor Sample Barcode | Tissue | Histology | Sex | Age | Stage | Therapy Types | Drugs | Outcome |
| CLEC11A | SNV | Missense_Mutation | c.10G>A | p.Ala4Thr | p.A4T | Q9Y240 | protein_coding | deleterious_low_confidence(0) | possibly_damaging(0.515) | TCGA-A8-A09W-01 | Breast | breast invasive carcinoma | Female | >=65 | III/IV | Unknown | Unknown | SD | |
| CLEC11A | SNV | Missense_Mutation | c.880N>C | p.Glu294Gln | p.E294Q | Q9Y240 | protein_coding | tolerated(0.19) | probably_damaging(0.999) | TCGA-C5-A1BN-01 | Cervix | cervical & endocervical cancer | Female | <65 | I/II | Chemotherapy | cisplatin | PD | |
| CLEC11A | SNV | Missense_Mutation | rs368757096 | c.836N>T | p.Ser279Leu | p.S279L | Q9Y240 | protein_coding | deleterious_low_confidence(0.01) | benign(0.019) | TCGA-C5-A1MK-01 | Cervix | cervical & endocervical cancer | Female | >=65 | III/IV | Chemotherapy | carboplatin | PD |
| CLEC11A | SNV | Missense_Mutation | c.86N>T | p.Trp29Leu | p.W29L | Q9Y240 | protein_coding | deleterious_low_confidence(0.01) | benign(0.041) | TCGA-D5-6540-01 | Colorectum | colon adenocarcinoma | Male | >=65 | I/II | Unknown | Unknown | SD | |
| CLEC11A | SNV | Missense_Mutation | c.322G>T | p.Val108Phe | p.V108F | Q9Y240 | protein_coding | tolerated(0.32) | benign(0) | TCGA-D5-6927-01 | Colorectum | colon adenocarcinoma | Male | <65 | I/II | Unknown | Unknown | SD | |
| CLEC11A | SNV | Missense_Mutation | c.132N>T | p.Glu44Asp | p.E44D | Q9Y240 | protein_coding | deleterious_low_confidence(0.01) | probably_damaging(0.935) | TCGA-D5-6928-01 | Colorectum | colon adenocarcinoma | Male | >=65 | I/II | Unknown | Unknown | SD | |
| CLEC11A | SNV | Missense_Mutation | c.235N>A | p.Glu79Lys | p.E79K | Q9Y240 | protein_coding | tolerated_low_confidence(0.12) | benign(0.037) | TCGA-G4-6321-01 | Colorectum | colon adenocarcinoma | Female | <65 | III/IV | Chemotherapy | fluorouracil | SD | |
| CLEC11A | SNV | Missense_Mutation | rs774318485 | c.202G>A | p.Gly68Arg | p.G68R | Q9Y240 | protein_coding | tolerated_low_confidence(0.18) | benign(0) | TCGA-A5-A0G2-01 | Endometrium | uterine corpus endometrioid carcinoma | Female | <65 | III/IV | Unknown | Unknown | SD |
| CLEC11A | SNV | Missense_Mutation | c.235N>A | p.Glu79Lys | p.E79K | Q9Y240 | protein_coding | tolerated_low_confidence(0.12) | benign(0.037) | TCGA-AP-A051-01 | Endometrium | uterine corpus endometrioid carcinoma | Female | >=65 | I/II | Unknown | Unknown | SD | |
| CLEC11A | SNV | Missense_Mutation | novel | c.147G>T | p.Lys49Asn | p.K49N | Q9Y240 | protein_coding | deleterious_low_confidence(0) | probably_damaging(0.981) | TCGA-AP-A1DK-01 | Endometrium | uterine corpus endometrioid carcinoma | Female | <65 | I/II | Unknown | Unknown | SD |
| Page: 1 2 |
Top |
Related drugs of malignant transformation related genes |
| Identification of chemicals and drugs interact with genes involved in malignant transfromation |
| (DGIdb 4.0) |
| Entrez ID | Symbol | Category | Interaction Types | Drug Claim Name | Drug Name | PMIDs |
| Page: 1 |

Copyright 2023-Present -The University of Texas Health Science Center at Houston |