
|
|||||
|
 | |
| |
| |
| |
| |
| |
|
Gene: CLDN7 |
Gene summary for CLDN7 |
| Gene information | Species | Human | Gene symbol | CLDN7 | Gene ID | 1366 |
| Gene name | claudin 7 | |
| Gene Alias | CEPTRL2 | |
| Cytomap | 17p13.1 | |
| Gene Type | protein-coding | GO ID | GO:0007043 | UniProtAcc | O95471 |
Top |
Malignant transformation analysis |
| Identification of the aberrant gene expression in precancerous and cancerous lesions by comparing the gene expression of stem-like cells in diseased tissues with normal stem cells |
| Entrez ID | Symbol | Replicates | Species | Organ | Tissue | Adj P-value | Log2FC | Malignancy |
| 1366 | CLDN7 | GSM4909282 | Human | Breast | IDC | 1.08e-05 | -4.13e-01 | -0.0288 |
| 1366 | CLDN7 | GSM4909286 | Human | Breast | IDC | 8.96e-24 | -6.51e-01 | 0.1081 |
| 1366 | CLDN7 | GSM4909287 | Human | Breast | IDC | 4.90e-08 | -4.39e-01 | 0.2057 |
| 1366 | CLDN7 | GSM4909288 | Human | Breast | IDC | 4.01e-07 | -6.68e-01 | 0.0988 |
| 1366 | CLDN7 | GSM4909290 | Human | Breast | IDC | 9.90e-07 | -3.52e-01 | 0.2096 |
| 1366 | CLDN7 | GSM4909292 | Human | Breast | IDC | 1.10e-03 | -7.32e-01 | 0.1236 |
| 1366 | CLDN7 | GSM4909293 | Human | Breast | IDC | 4.27e-07 | -2.66e-01 | 0.1581 |
| 1366 | CLDN7 | GSM4909294 | Human | Breast | IDC | 3.36e-12 | -4.84e-01 | 0.2022 |
| 1366 | CLDN7 | GSM4909296 | Human | Breast | IDC | 2.70e-12 | -2.96e-01 | 0.1524 |
| 1366 | CLDN7 | GSM4909297 | Human | Breast | IDC | 6.30e-20 | 8.01e-02 | 0.1517 |
| 1366 | CLDN7 | GSM4909308 | Human | Breast | IDC | 4.95e-08 | -2.89e-01 | 0.158 |
| 1366 | CLDN7 | GSM4909311 | Human | Breast | IDC | 3.26e-40 | -5.29e-01 | 0.1534 |
| 1366 | CLDN7 | GSM4909312 | Human | Breast | IDC | 4.74e-15 | -2.75e-01 | 0.1552 |
| 1366 | CLDN7 | GSM4909319 | Human | Breast | IDC | 5.72e-46 | -5.08e-01 | 0.1563 |
| 1366 | CLDN7 | GSM4909320 | Human | Breast | IDC | 3.25e-03 | -2.65e-01 | 0.1575 |
| 1366 | CLDN7 | GSM4909321 | Human | Breast | IDC | 1.85e-13 | 2.84e-02 | 0.1559 |
| 1366 | CLDN7 | brca1 | Human | Breast | Precancer | 1.97e-44 | 7.27e-01 | -0.0338 |
| 1366 | CLDN7 | brca2 | Human | Breast | Precancer | 8.09e-15 | 4.24e-01 | -0.024 |
| 1366 | CLDN7 | brca3 | Human | Breast | Precancer | 1.24e-32 | 6.26e-01 | -0.0263 |
| 1366 | CLDN7 | M1 | Human | Breast | IDC | 6.12e-05 | -4.18e-01 | 0.1577 |
| Page: 1 2 3 4 5 6 7 8 9 10 11 12 13 |
| Tissue | Expression Dynamics | Abbreviation |
| Breast | 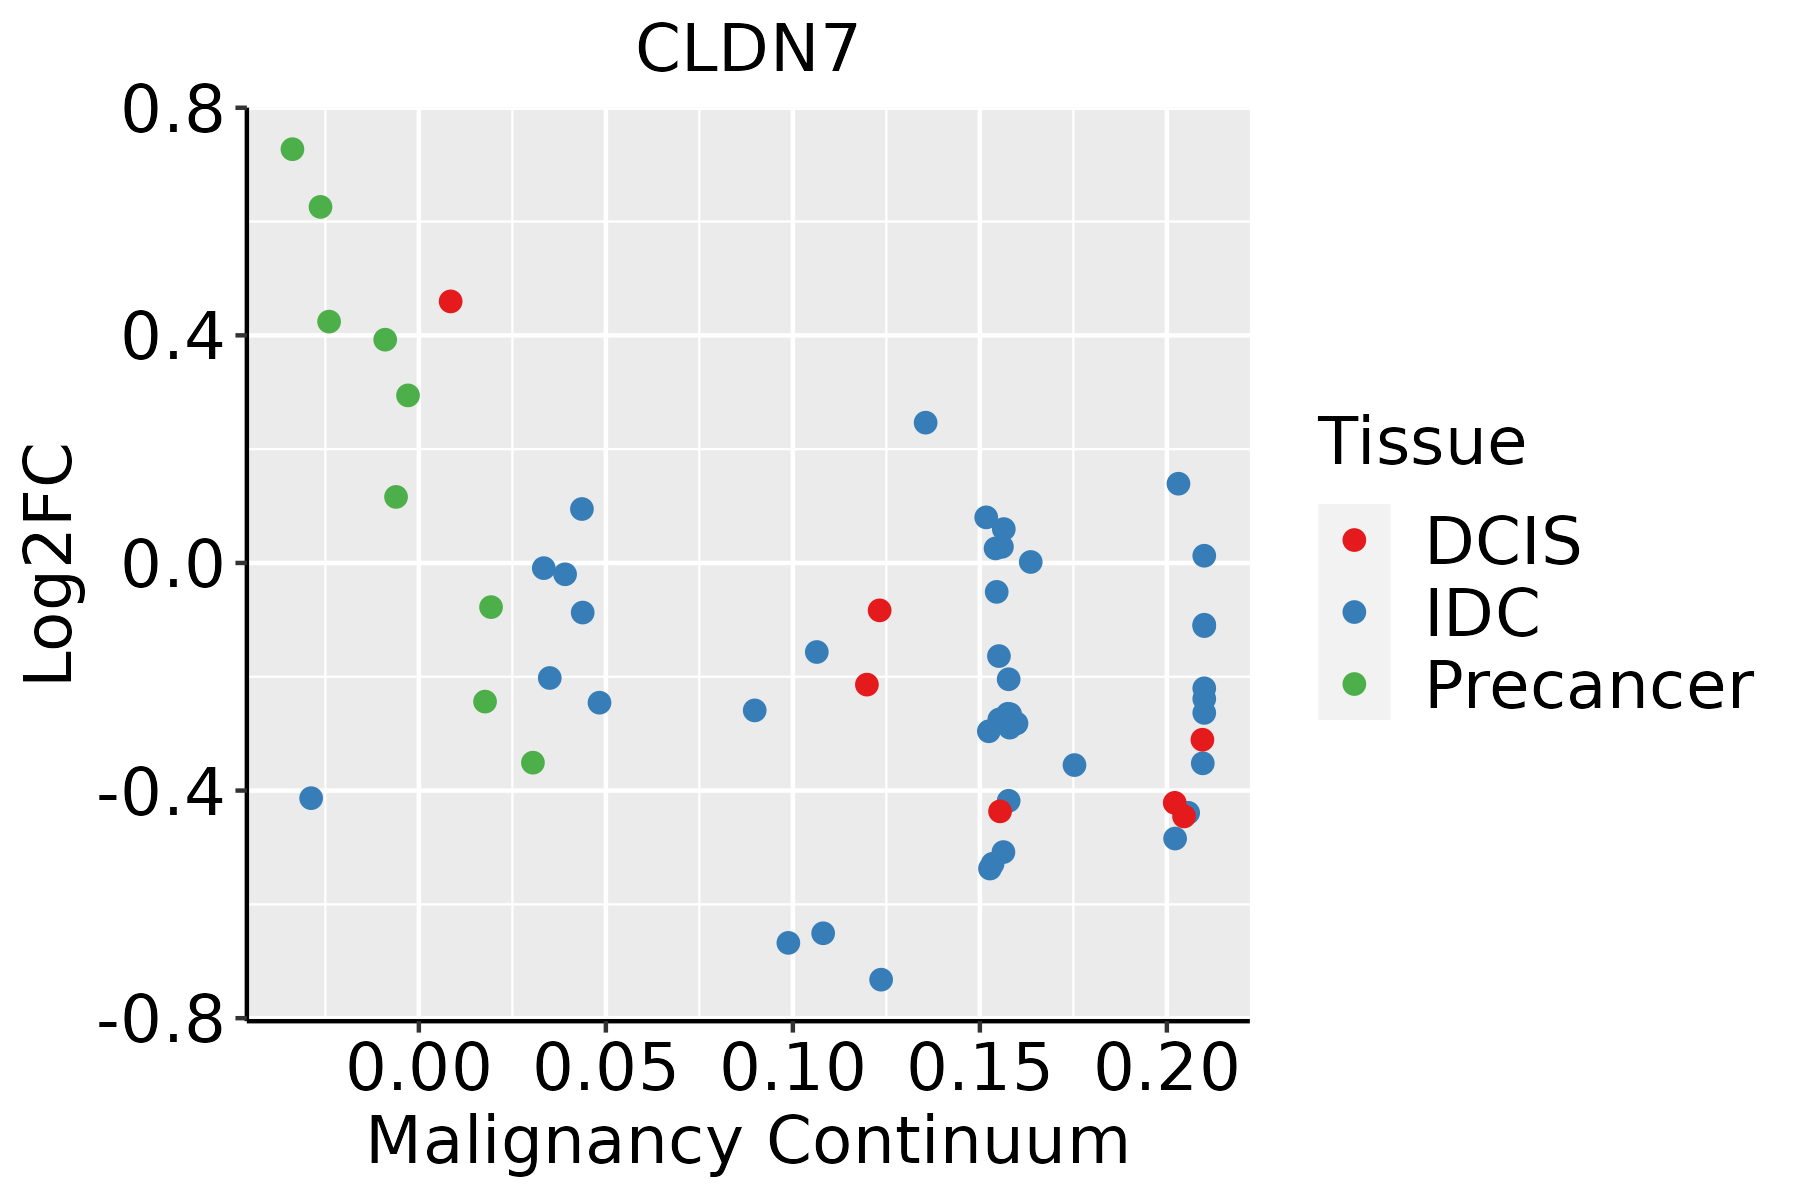 | IDC: Invasive ductal carcinoma |
| DCIS: Ductal carcinoma in situ | ||
| Precancer(BRCA1-mut): Precancerous lesion from BRCA1 mutation carriers | ||
| Cervix | 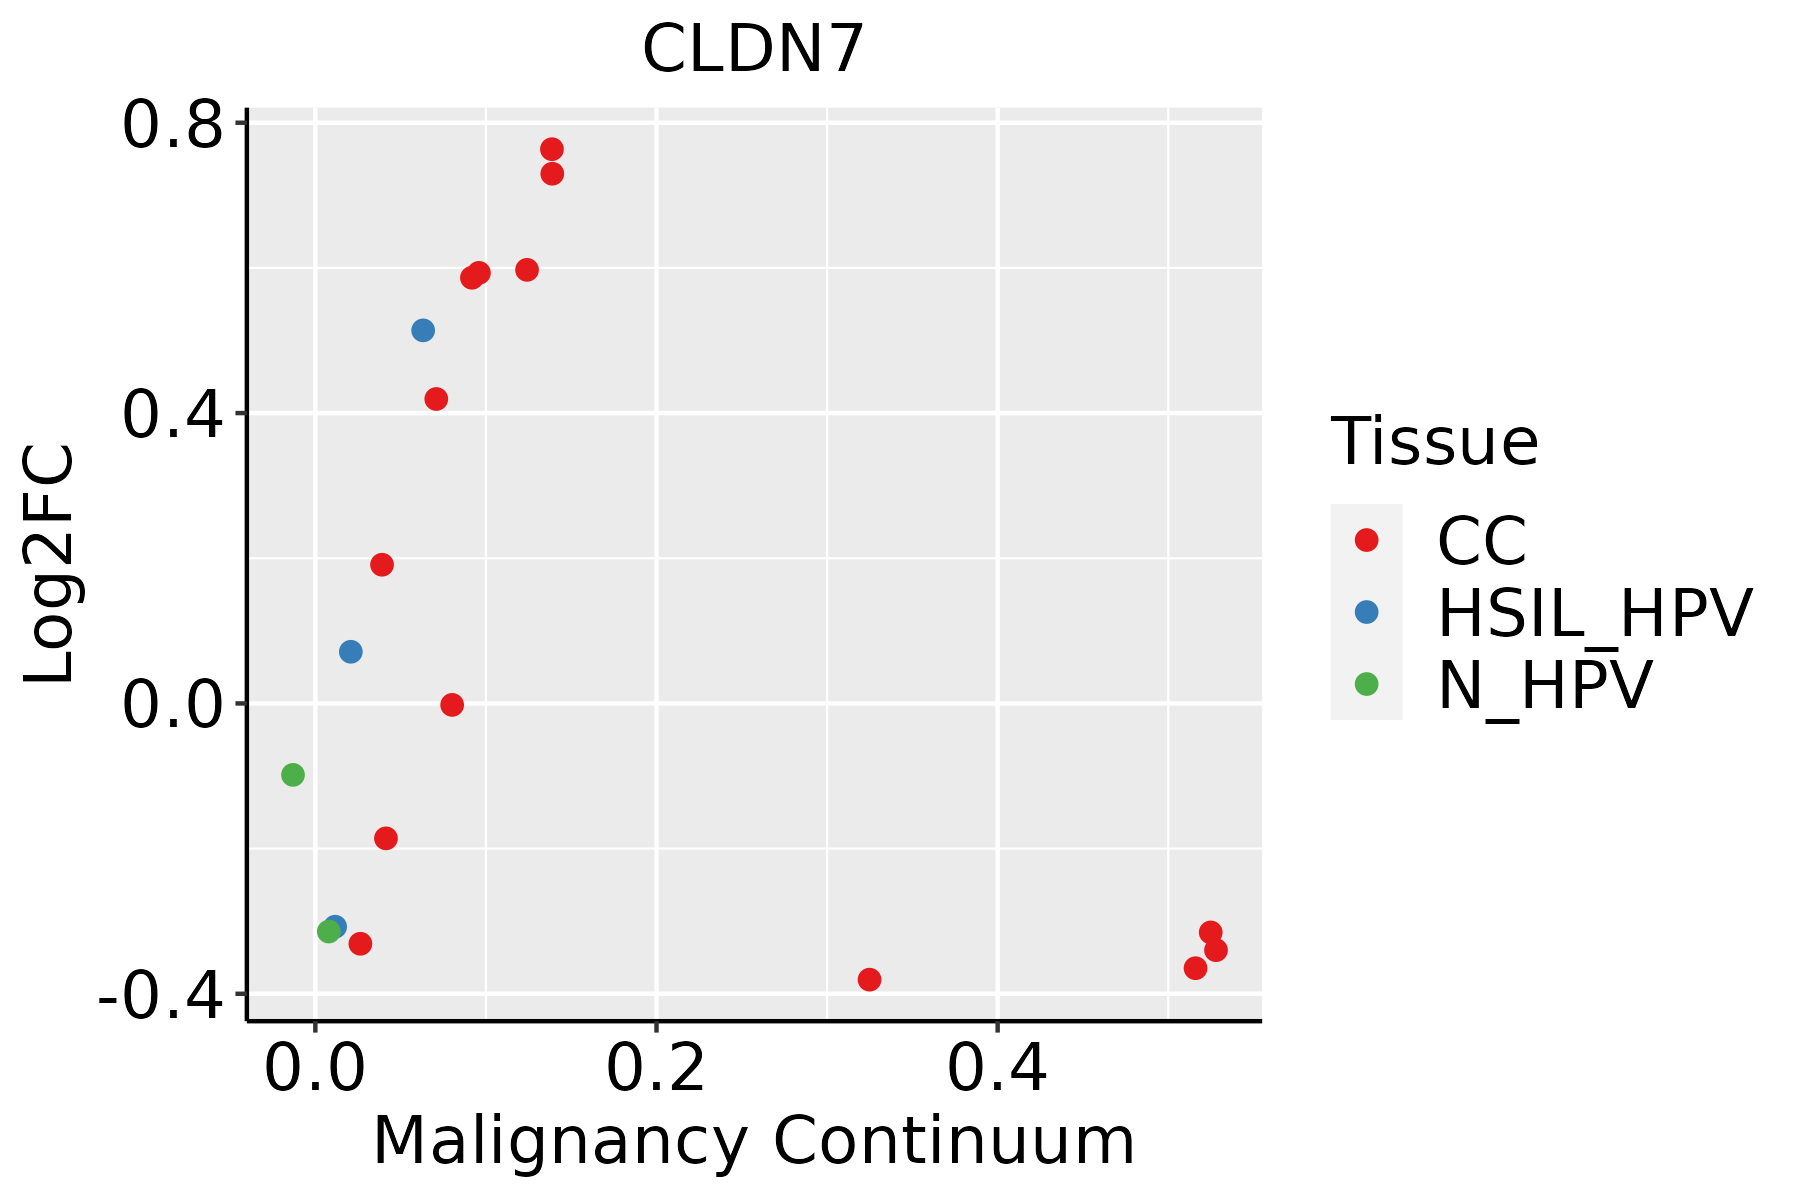 | CC: Cervix cancer |
| HSIL_HPV: HPV-infected high-grade squamous intraepithelial lesions | ||
| N_HPV: HPV-infected normal cervix | ||
| Colorectum (GSE201348) |  | FAP: Familial adenomatous polyposis |
| CRC: Colorectal cancer | ||
| Colorectum (HTA11) |  | AD: Adenomas |
| SER: Sessile serrated lesions | ||
| MSI-H: Microsatellite-high colorectal cancer | ||
| MSS: Microsatellite stable colorectal cancer | ||
| Endometrium |  | AEH: Atypical endometrial hyperplasia |
| EEC: Endometrioid Cancer | ||
| Esophagus | 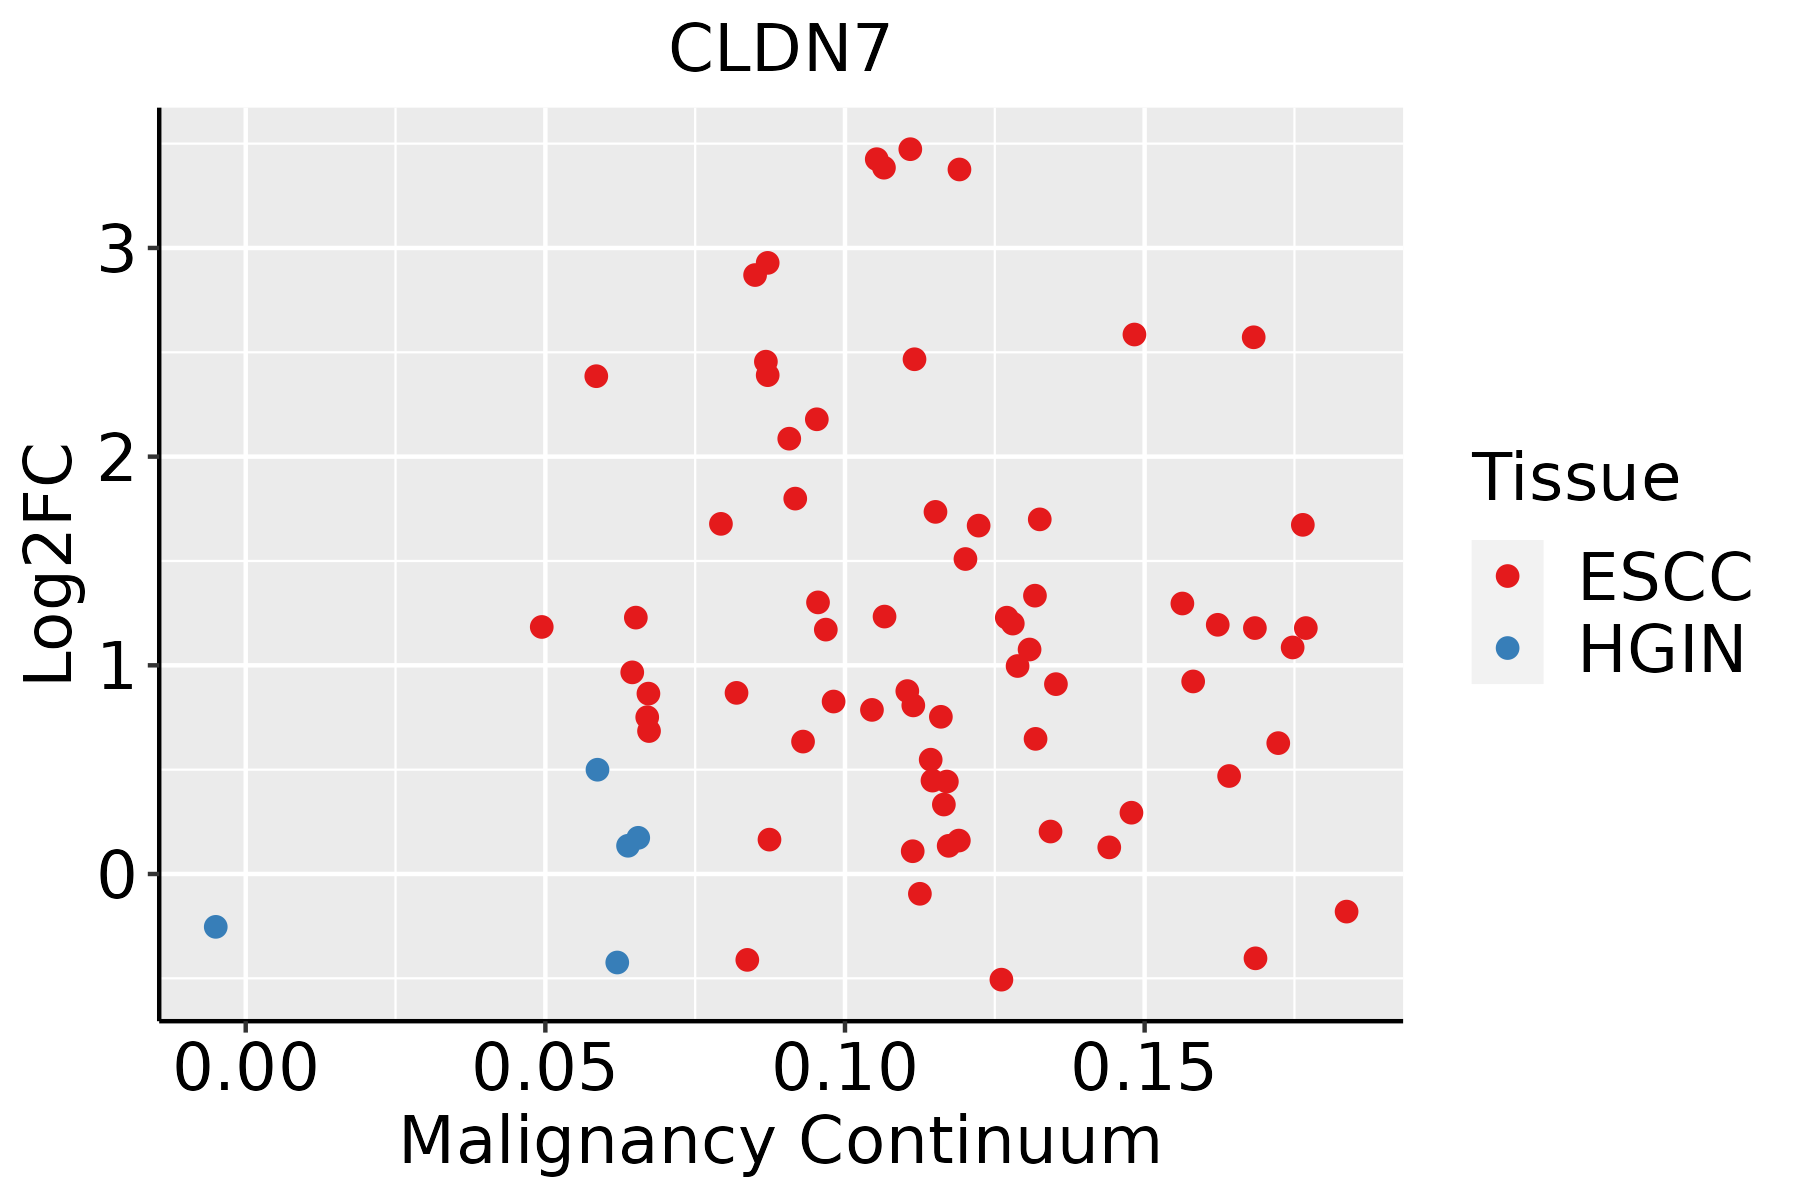 | ESCC: Esophageal squamous cell carcinoma |
| HGIN: High-grade intraepithelial neoplasias | ||
| LGIN: Low-grade intraepithelial neoplasias | ||
| GC | 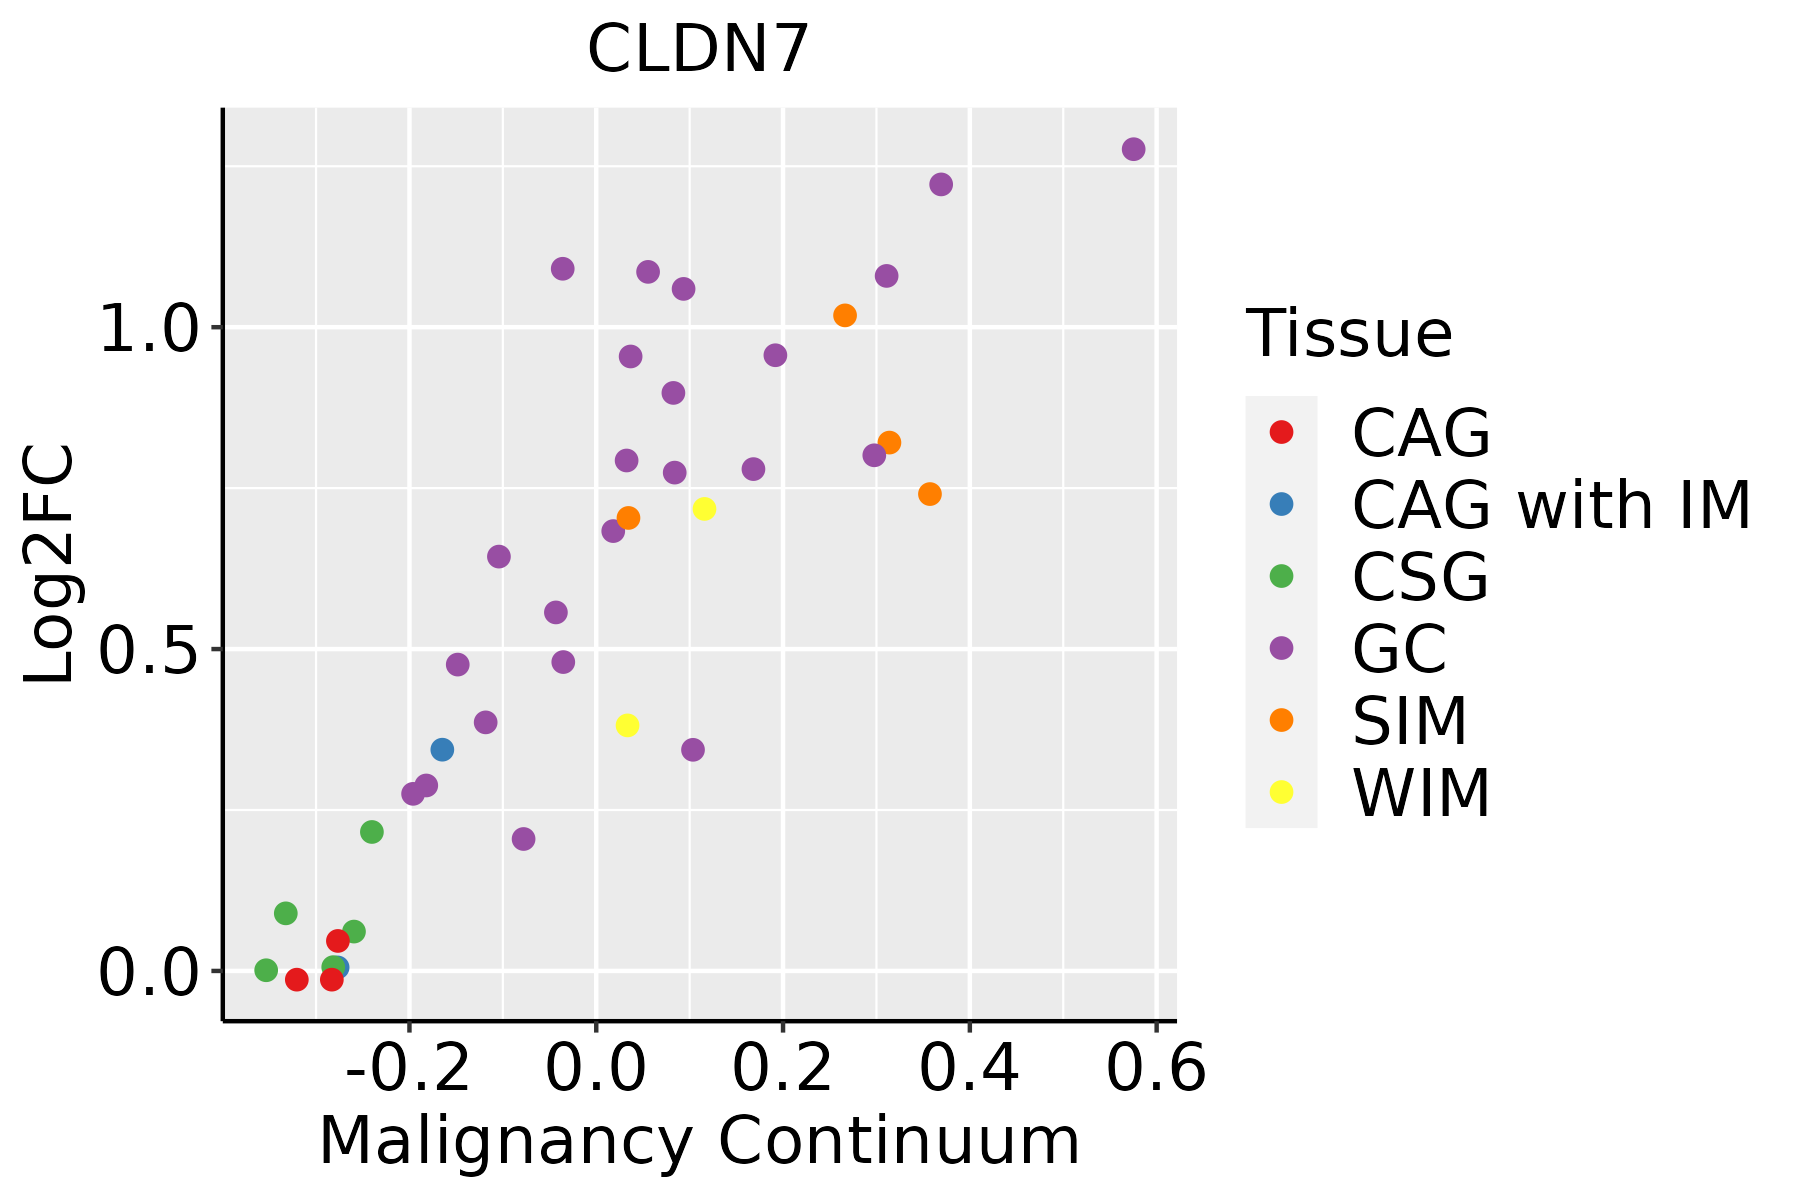 | CAG: Chronic atrophic gastritis |
| CAG with IM: Chronic atrophic gastritis with intestinal metaplasia | ||
| CSG: Chronic superficial gastritis | ||
| GC: Gastric cancer | ||
| SIM: Severe intestinal metaplasia | ||
| WIM: Wild intestinal metaplasia | ||
| Liver | 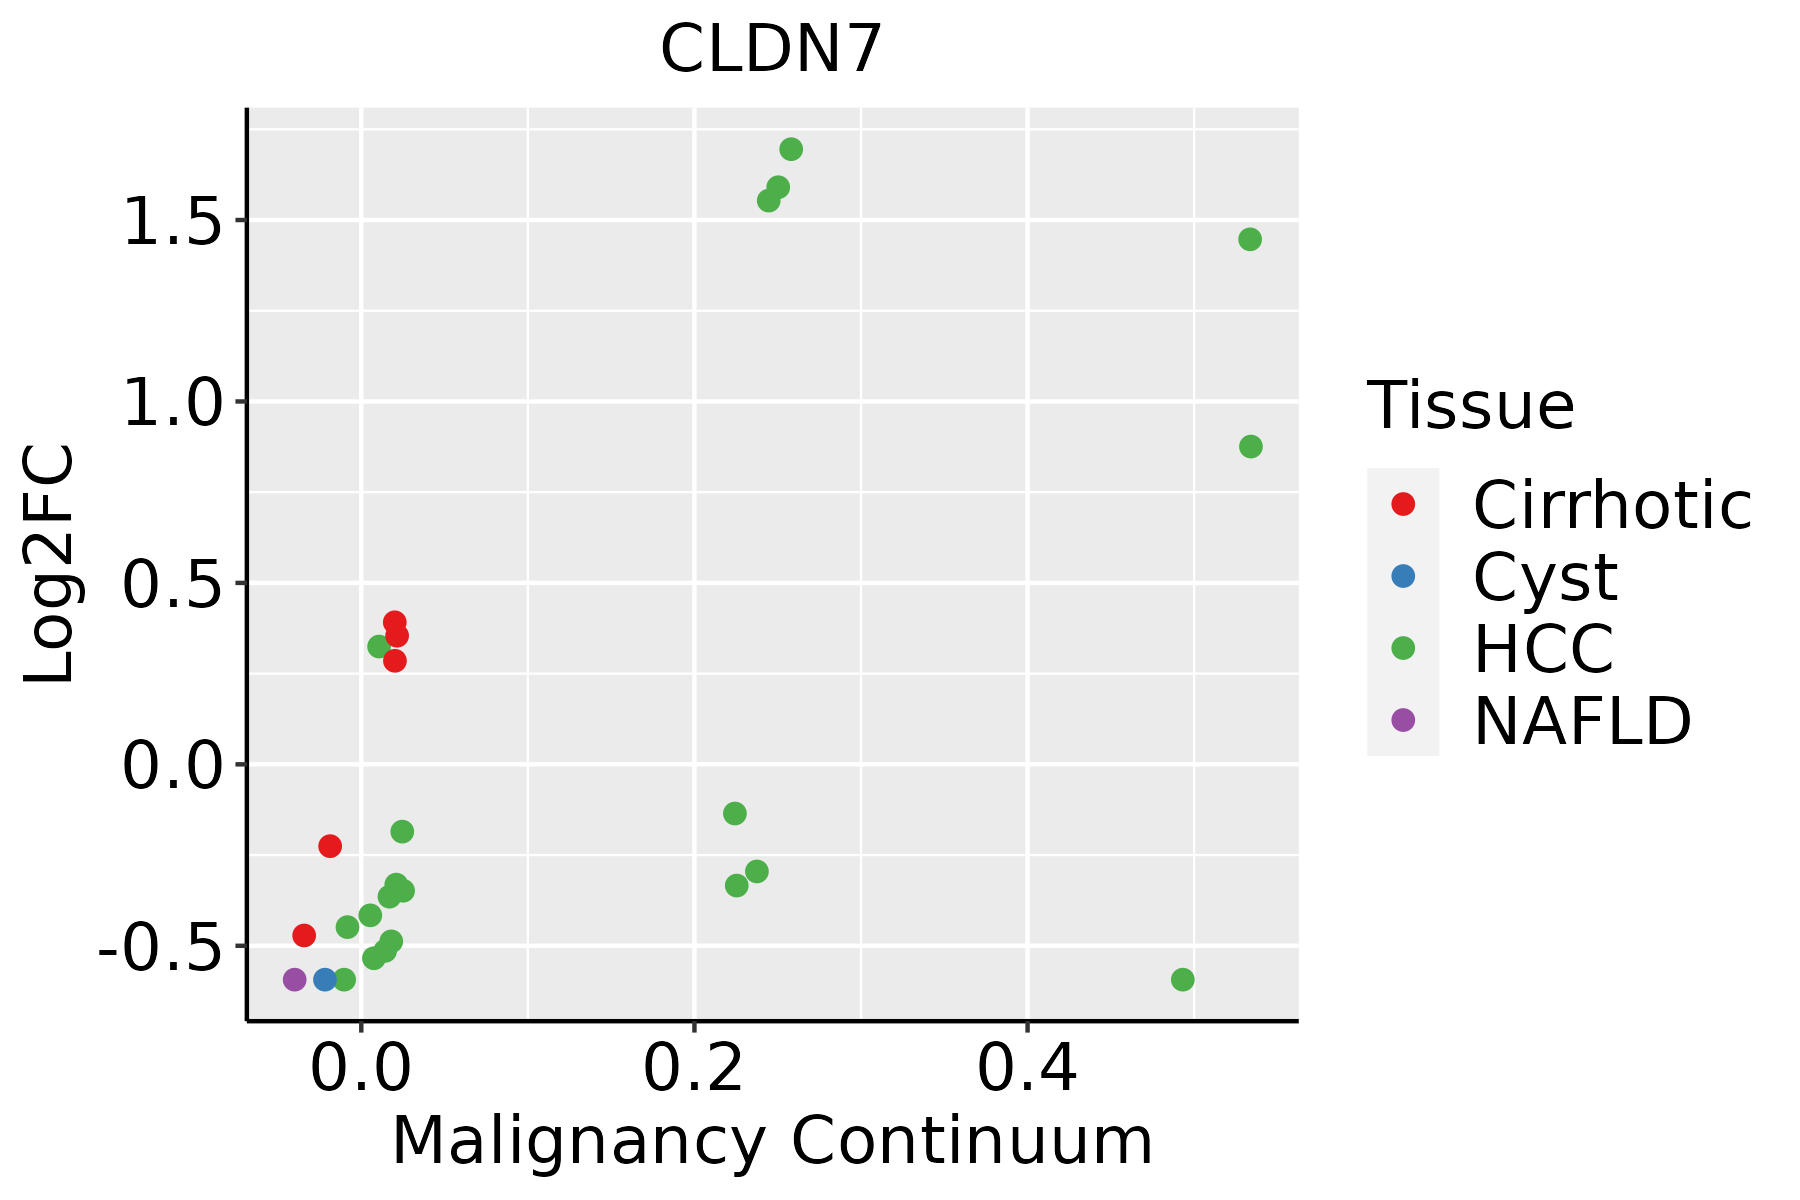 | HCC: Hepatocellular carcinoma |
| NAFLD: Non-alcoholic fatty liver disease | ||
| Oral Cavity | 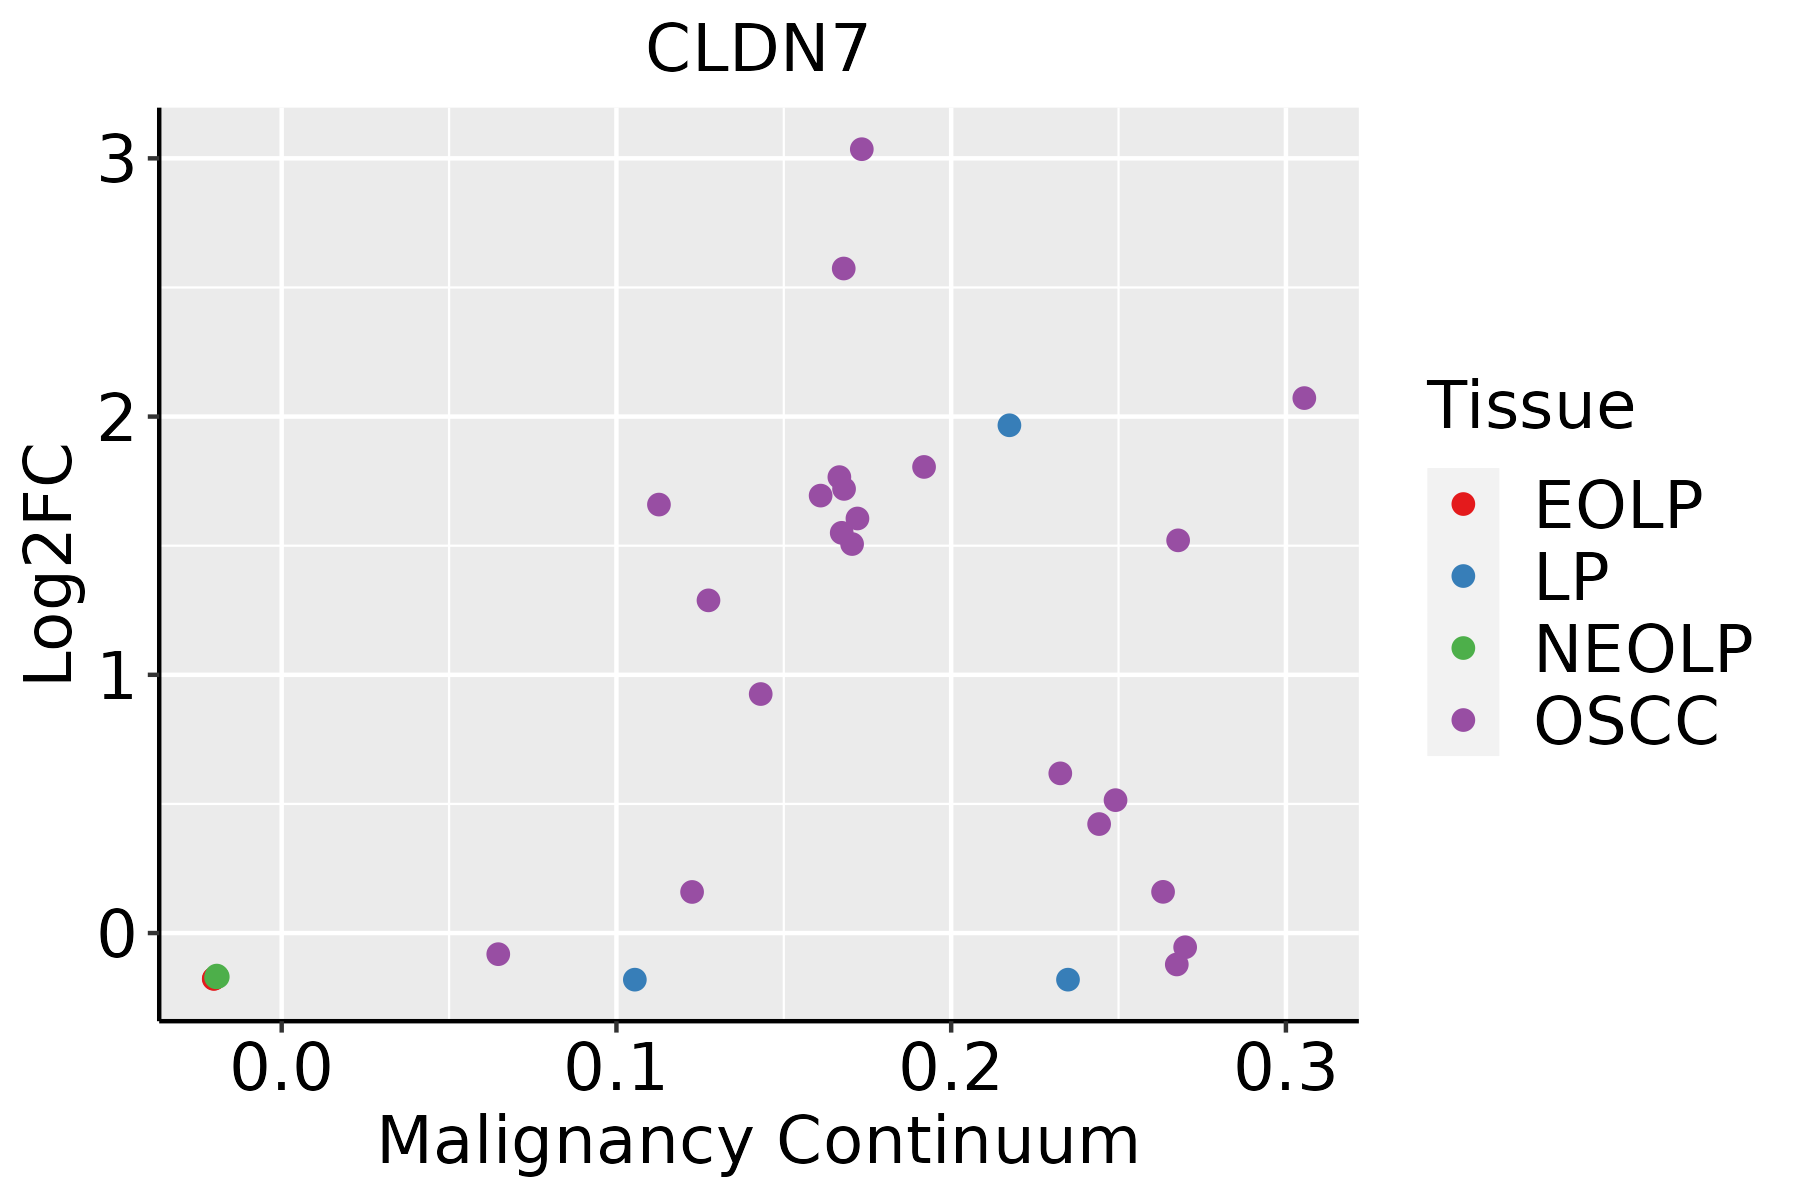 | EOLP: Erosive Oral lichen planus |
| LP: leukoplakia | ||
| NEOLP: Non-erosive oral lichen planus | ||
| OSCC: Oral squamous cell carcinoma | ||
| Prostate |  | BPH: Benign Prostatic Hyperplasia |
| Thyroid |  | ATC: Anaplastic thyroid cancer |
| HT: Hashimoto's thyroiditis | ||
| PTC: Papillary thyroid cancer |
| ∗log2FC in expression of this searched gene in stem-like cells from each diseased tissue sample relative to stem-like cells in normal samples in each tissue plotted against the malignancy continuum. Samples are colored based on if they are from different disease stage. |
Top |
Malignant transformation related pathway analysis |
| Find out the enriched GO biological processes and KEGG pathways involved in transition from healthy to precancer to cancer |
| Tissue | Disease Stage | Enriched GO biological Processes |
| Colorectum | AD |  |
| Colorectum | SER |  |
| Colorectum | MSS |  |
| Colorectum | MSI-H |  |
| Colorectum | FAP |  |
| ∗Top 15 enriched GO BP terms are showed in the bar plot of each disease state in each tissue. Each row represents a significant GO biological process which is colored according to the -log10(p.adjust). |
| Page: 1 2 3 4 5 6 7 8 9 |
| GO ID | Tissue | Disease Stage | Description | Gene Ratio | Bg Ratio | pvalue | p.adjust | Count |
| GO:00452169 | Cervix | CC | cell-cell junction organization | 53/2311 | 200/18723 | 3.83e-08 | 2.53e-06 | 53 |
| GO:00343298 | Cervix | CC | cell junction assembly | 88/2311 | 420/18723 | 3.42e-07 | 1.38e-05 | 88 |
| GO:00070439 | Cervix | CC | cell-cell junction assembly | 39/2311 | 146/18723 | 1.86e-06 | 5.94e-05 | 39 |
| GO:00432978 | Cervix | CC | apical junction assembly | 24/2311 | 78/18723 | 1.36e-05 | 2.73e-04 | 24 |
| GO:01201927 | Cervix | CC | tight junction assembly | 21/2311 | 74/18723 | 1.69e-04 | 2.00e-03 | 21 |
| GO:01201937 | Cervix | CC | tight junction organization | 22/2311 | 80/18723 | 1.97e-04 | 2.26e-03 | 22 |
| GO:00708306 | Cervix | CC | bicellular tight junction assembly | 18/2311 | 70/18723 | 1.69e-03 | 1.29e-02 | 18 |
| GO:004521614 | Cervix | HSIL_HPV | cell-cell junction organization | 23/737 | 200/18723 | 4.21e-06 | 1.69e-04 | 23 |
| GO:000704314 | Cervix | HSIL_HPV | cell-cell junction assembly | 19/737 | 146/18723 | 4.72e-06 | 1.84e-04 | 19 |
| GO:004329714 | Cervix | HSIL_HPV | apical junction assembly | 11/737 | 78/18723 | 2.29e-04 | 4.03e-03 | 11 |
| GO:007083013 | Cervix | HSIL_HPV | bicellular tight junction assembly | 10/737 | 70/18723 | 3.94e-04 | 6.10e-03 | 10 |
| GO:012019213 | Cervix | HSIL_HPV | tight junction assembly | 10/737 | 74/18723 | 6.19e-04 | 8.62e-03 | 10 |
| GO:012019313 | Cervix | HSIL_HPV | tight junction organization | 10/737 | 80/18723 | 1.15e-03 | 1.38e-02 | 10 |
| GO:003432913 | Cervix | HSIL_HPV | cell junction assembly | 28/737 | 420/18723 | 4.82e-03 | 3.98e-02 | 28 |
| GO:004521624 | Cervix | N_HPV | cell-cell junction organization | 15/534 | 200/18723 | 6.41e-04 | 8.27e-03 | 15 |
| GO:0098742 | Cervix | N_HPV | cell-cell adhesion via plasma-membrane adhesion molecules | 17/534 | 273/18723 | 2.26e-03 | 2.11e-02 | 17 |
| GO:000704323 | Cervix | N_HPV | cell-cell junction assembly | 11/534 | 146/18723 | 3.15e-03 | 2.64e-02 | 11 |
| GO:012019323 | Cervix | N_HPV | tight junction organization | 7/534 | 80/18723 | 7.80e-03 | 4.97e-02 | 7 |
| GO:0045216 | Colorectum | AD | cell-cell junction organization | 80/3918 | 200/18723 | 5.57e-10 | 4.58e-08 | 80 |
| GO:0034329 | Colorectum | AD | cell junction assembly | 136/3918 | 420/18723 | 2.02e-08 | 1.15e-06 | 136 |
| Page: 1 2 3 4 5 6 7 |
| Pathway ID | Tissue | Disease Stage | Description | Gene Ratio | Bg Ratio | pvalue | p.adjust | qvalue | Count |
| hsa0513018 | Breast | Precancer | Pathogenic Escherichia coli infection | 38/684 | 197/8465 | 3.12e-07 | 5.81e-06 | 4.45e-06 | 38 |
| hsa0453018 | Breast | Precancer | Tight junction | 31/684 | 169/8465 | 1.13e-05 | 1.26e-04 | 9.64e-05 | 31 |
| hsa0467018 | Breast | Precancer | Leukocyte transendothelial migration | 20/684 | 114/8465 | 7.26e-04 | 5.33e-03 | 4.09e-03 | 20 |
| hsa0513019 | Breast | Precancer | Pathogenic Escherichia coli infection | 38/684 | 197/8465 | 3.12e-07 | 5.81e-06 | 4.45e-06 | 38 |
| hsa0453019 | Breast | Precancer | Tight junction | 31/684 | 169/8465 | 1.13e-05 | 1.26e-04 | 9.64e-05 | 31 |
| hsa0467019 | Breast | Precancer | Leukocyte transendothelial migration | 20/684 | 114/8465 | 7.26e-04 | 5.33e-03 | 4.09e-03 | 20 |
| hsa0453024 | Breast | IDC | Tight junction | 38/867 | 169/8465 | 2.07e-06 | 3.20e-05 | 2.39e-05 | 38 |
| hsa0513024 | Breast | IDC | Pathogenic Escherichia coli infection | 42/867 | 197/8465 | 2.66e-06 | 3.92e-05 | 2.94e-05 | 42 |
| hsa0467024 | Breast | IDC | Leukocyte transendothelial migration | 21/867 | 114/8465 | 5.41e-03 | 3.13e-02 | 2.34e-02 | 21 |
| hsa0453034 | Breast | IDC | Tight junction | 38/867 | 169/8465 | 2.07e-06 | 3.20e-05 | 2.39e-05 | 38 |
| hsa0513034 | Breast | IDC | Pathogenic Escherichia coli infection | 42/867 | 197/8465 | 2.66e-06 | 3.92e-05 | 2.94e-05 | 42 |
| hsa0467034 | Breast | IDC | Leukocyte transendothelial migration | 21/867 | 114/8465 | 5.41e-03 | 3.13e-02 | 2.34e-02 | 21 |
| hsa0513043 | Breast | DCIS | Pathogenic Escherichia coli infection | 42/846 | 197/8465 | 1.40e-06 | 2.15e-05 | 1.59e-05 | 42 |
| hsa0453044 | Breast | DCIS | Tight junction | 37/846 | 169/8465 | 3.07e-06 | 4.20e-05 | 3.09e-05 | 37 |
| hsa0467044 | Breast | DCIS | Leukocyte transendothelial migration | 21/846 | 114/8465 | 4.07e-03 | 2.31e-02 | 1.70e-02 | 21 |
| hsa0513053 | Breast | DCIS | Pathogenic Escherichia coli infection | 42/846 | 197/8465 | 1.40e-06 | 2.15e-05 | 1.59e-05 | 42 |
| hsa0453054 | Breast | DCIS | Tight junction | 37/846 | 169/8465 | 3.07e-06 | 4.20e-05 | 3.09e-05 | 37 |
| hsa0467054 | Breast | DCIS | Leukocyte transendothelial migration | 21/846 | 114/8465 | 4.07e-03 | 2.31e-02 | 1.70e-02 | 21 |
| hsa0513020 | Cervix | CC | Pathogenic Escherichia coli infection | 63/1267 | 197/8465 | 9.28e-10 | 2.00e-08 | 1.19e-08 | 63 |
| hsa0453020 | Cervix | CC | Tight junction | 49/1267 | 169/8465 | 1.87e-06 | 1.78e-05 | 1.05e-05 | 49 |
| Page: 1 2 3 4 5 6 7 8 9 10 |
Top |
Cell-cell communication analysis |
| Identification of potential cell-cell interactions between two cell types and their ligand-receptor pairs for different disease states |
| Ligand | Receptor | LRpair | Pathway | Tissue | Disease Stage |
| Page: 1 |
Top |
Single-cell gene regulatory network inference analysis |
| Find out the significant the regulons (TFs) and the target genes of each regulon across cell types for different disease states |
| TF | Cell Type | Tissue | Disease Stage | Target Gene | RSS | Regulon Activity |
| ∗The dot plots of a searched regulon are shown for all cell subpopulations in each disease state of each tissue based on the regulon specific score inferred using pySCENIC and by calculating the average expression. |
| Page: 1 |
Top |
Somatic mutation of malignant transformation related genes |
| Annotation of somatic variants for genes involved in malignant transformation |
| Hugo Symbol | Variant Class | Variant Classification | dbSNP RS | HGVSc | HGVSp | HGVSp Short | SWISSPROT | BIOTYPE | SIFT | PolyPhen | Tumor Sample Barcode | Tissue | Histology | Sex | Age | Stage | Therapy Types | Drugs | Outcome |
| CLDN7 | SNV | Missense_Mutation | novel | c.232N>G | p.Gln78Glu | p.Q78E | O95471 | protein_coding | deleterious(0) | probably_damaging(0.987) | TCGA-C5-A2LZ-01 | Cervix | cervical & endocervical cancer | Female | >=65 | III/IV | Unknown | Unknown | PD |
| CLDN7 | SNV | Missense_Mutation | c.439N>T | p.Asp147Tyr | p.D147Y | O95471 | protein_coding | deleterious(0) | probably_damaging(0.961) | TCGA-AA-3977-01 | Colorectum | colon adenocarcinoma | Male | >=65 | I/II | Unknown | Unknown | SD | |
| CLDN7 | SNV | Missense_Mutation | novel | c.373N>C | p.Ile125Leu | p.I125L | O95471 | protein_coding | tolerated(0.53) | benign(0.053) | TCGA-AA-3984-01 | Colorectum | colon adenocarcinoma | Female | <65 | I/II | Unknown | Unknown | SD |
| CLDN7 | SNV | Missense_Mutation | rs773251272 | c.596N>A | p.Arg199His | p.R199H | O95471 | protein_coding | tolerated(0.13) | benign(0.107) | TCGA-WS-AB45-01 | Colorectum | colon adenocarcinoma | Female | <65 | I/II | Unknown | Unknown | SD |
| CLDN7 | SNV | Missense_Mutation | novel | c.345N>T | p.Lys115Asn | p.K115N | O95471 | protein_coding | deleterious(0) | probably_damaging(0.998) | TCGA-AP-A059-01 | Endometrium | uterine corpus endometrioid carcinoma | Female | >=65 | I/II | Unknown | Unknown | SD |
| CLDN7 | SNV | Missense_Mutation | novel | c.227N>T | p.Ala76Val | p.A76V | O95471 | protein_coding | tolerated(0.34) | benign(0.185) | TCGA-AX-A2HD-01 | Endometrium | uterine corpus endometrioid carcinoma | Female | >=65 | III/IV | Unknown | Unknown | SD |
| CLDN7 | SNV | Missense_Mutation | novel | c.373N>G | p.Ile125Val | p.I125V | O95471 | protein_coding | tolerated(0.42) | benign(0.003) | TCGA-B5-A1MR-01 | Endometrium | uterine corpus endometrioid carcinoma | Female | >=65 | III/IV | Unknown | Unknown | SD |
| CLDN7 | SNV | Missense_Mutation | novel | c.160N>C | p.Cys54Arg | p.C54R | O95471 | protein_coding | tolerated(0.05) | probably_damaging(0.999) | TCGA-BG-A222-01 | Endometrium | uterine corpus endometrioid carcinoma | Female | <65 | I/II | Unknown | Unknown | SD |
| CLDN7 | SNV | Missense_Mutation | novel | c.382N>A | p.Val128Met | p.V128M | O95471 | protein_coding | tolerated(0.1) | benign(0.409) | TCGA-DF-A2KN-01 | Endometrium | uterine corpus endometrioid carcinoma | Female | Unknown | I/II | Unknown | Unknown | SD |
| CLDN7 | SNV | Missense_Mutation | novel | c.80T>C | p.Ile27Thr | p.I27T | O95471 | protein_coding | tolerated(0.08) | benign(0.159) | TCGA-21-1076-01 | Lung | lung squamous cell carcinoma | Female | <65 | I/II | Unknown | Unknown | PD |
| Page: 1 2 |
Top |
Related drugs of malignant transformation related genes |
| Identification of chemicals and drugs interact with genes involved in malignant transfromation |
| (DGIdb 4.0) |
| Entrez ID | Symbol | Category | Interaction Types | Drug Claim Name | Drug Name | PMIDs |
| Page: 1 |

Copyright 2023-Present -The University of Texas Health Science Center at Houston |