
|
|||||
|
 | |
| |
| |
| |
| |
| |
|
Gene: CLDN5 |
Gene summary for CLDN5 |
| Gene information | Species | Human | Gene symbol | CLDN5 | Gene ID | 7122 |
| Gene name | claudin 5 | |
| Gene Alias | AWAL | |
| Cytomap | 22q11.21 | |
| Gene Type | protein-coding | GO ID | GO:0001525 | UniProtAcc | D3DX19 |
Top |
Malignant transformation analysis |
| Identification of the aberrant gene expression in precancerous and cancerous lesions by comparing the gene expression of stem-like cells in diseased tissues with normal stem cells |
| Entrez ID | Symbol | Replicates | Species | Organ | Tissue | Adj P-value | Log2FC | Malignancy |
| 7122 | CLDN5 | P5T-E | Human | Esophagus | ESCC | 3.21e-14 | 4.89e-01 | 0.1327 |
| 7122 | CLDN5 | P9T-E | Human | Esophagus | ESCC | 1.28e-20 | 1.83e+00 | 0.1131 |
| 7122 | CLDN5 | P31T-E | Human | Esophagus | ESCC | 4.99e-46 | 1.69e+00 | 0.1251 |
| 7122 | CLDN5 | P52T-E | Human | Esophagus | ESCC | 1.16e-11 | 1.23e+00 | 0.1555 |
| 7122 | CLDN5 | P61T-E | Human | Esophagus | ESCC | 9.69e-03 | 2.93e-01 | 0.099 |
| 7122 | CLDN5 | C38 | Human | Oral cavity | OSCC | 2.54e-04 | 1.23e+00 | 0.172 |
| 7122 | CLDN5 | LN38 | Human | Oral cavity | OSCC | 3.72e-12 | 2.89e+00 | 0.168 |
| 7122 | CLDN5 | LP16 | Human | Oral cavity | LP | 2.72e-02 | 4.23e-01 | 0.1055 |
| 7122 | CLDN5 | LP17 | Human | Oral cavity | LP | 7.78e-05 | 6.37e-01 | 0.2349 |
| Page: 1 |
| Tissue | Expression Dynamics | Abbreviation |
| Esophagus |  | ESCC: Esophageal squamous cell carcinoma |
| HGIN: High-grade intraepithelial neoplasias | ||
| LGIN: Low-grade intraepithelial neoplasias | ||
| Oral Cavity | 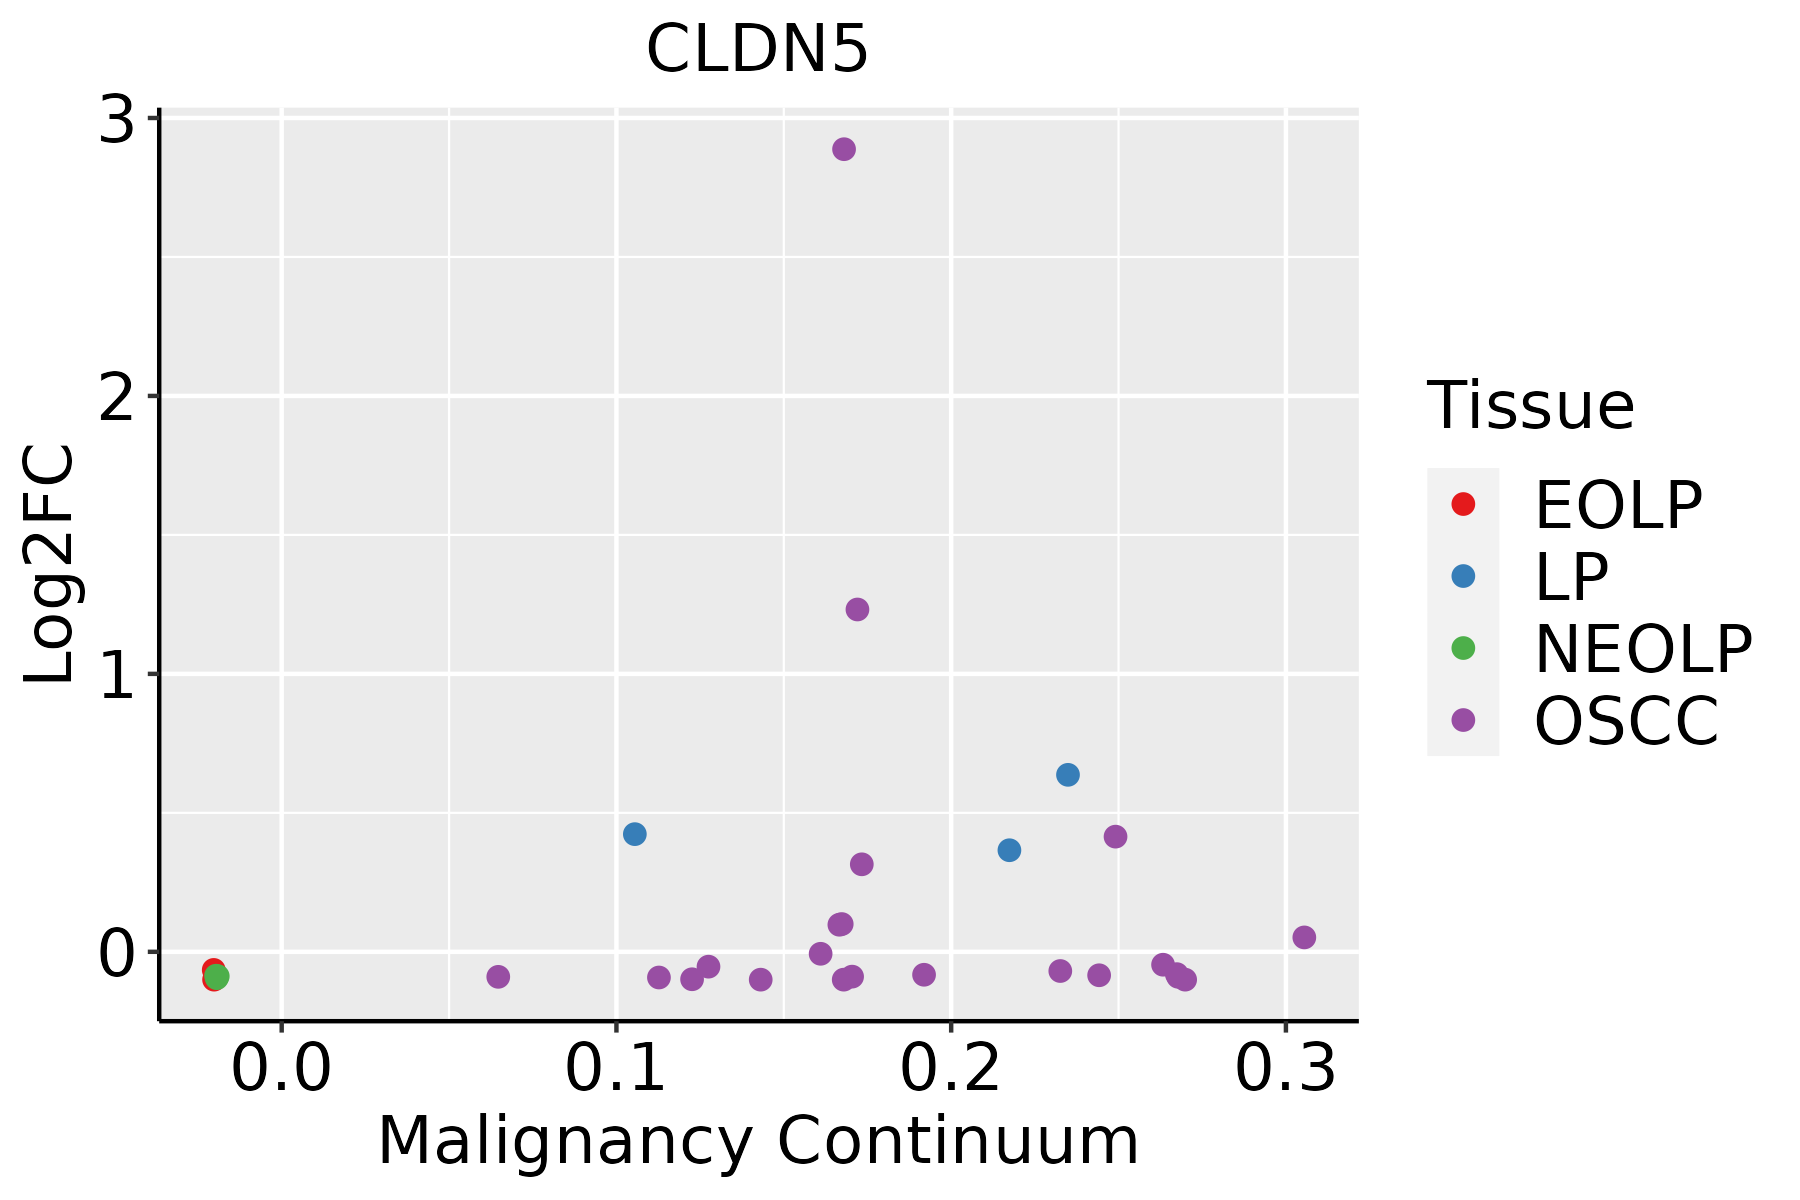 | EOLP: Erosive Oral lichen planus |
| LP: leukoplakia | ||
| NEOLP: Non-erosive oral lichen planus | ||
| OSCC: Oral squamous cell carcinoma |
| ∗log2FC in expression of this searched gene in stem-like cells from each diseased tissue sample relative to stem-like cells in normal samples in each tissue plotted against the malignancy continuum. Samples are colored based on if they are from different disease stage. |
Top |
Malignant transformation related pathway analysis |
| Find out the enriched GO biological processes and KEGG pathways involved in transition from healthy to precancer to cancer |
| Tissue | Disease Stage | Enriched GO biological Processes |
| Colorectum | AD |  |
| Colorectum | SER |  |
| Colorectum | MSS |  |
| Colorectum | MSI-H |  |
| Colorectum | FAP |  |
| ∗Top 15 enriched GO BP terms are showed in the bar plot of each disease state in each tissue. Each row represents a significant GO biological process which is colored according to the -log10(p.adjust). |
| Page: 1 2 3 4 5 6 7 8 9 |
| GO ID | Tissue | Disease Stage | Description | Gene Ratio | Bg Ratio | pvalue | p.adjust | Count |
| GO:0051098111 | Esophagus | ESCC | regulation of binding | 251/8552 | 363/18723 | 6.73e-20 | 8.46e-18 | 251 |
| GO:0051099111 | Esophagus | ESCC | positive regulation of binding | 122/8552 | 173/18723 | 2.79e-11 | 9.45e-10 | 122 |
| GO:004339320 | Esophagus | ESCC | regulation of protein binding | 135/8552 | 196/18723 | 3.69e-11 | 1.22e-09 | 135 |
| GO:00715599 | Esophagus | ESCC | response to transforming growth factor beta | 157/8552 | 256/18723 | 2.95e-07 | 4.23e-06 | 157 |
| GO:000206420 | Esophagus | ESCC | epithelial cell development | 136/8552 | 220/18723 | 9.50e-07 | 1.21e-05 | 136 |
| GO:00715609 | Esophagus | ESCC | cellular response to transforming growth factor beta stimulus | 151/8552 | 250/18723 | 1.78e-06 | 2.10e-05 | 151 |
| GO:003209216 | Esophagus | ESCC | positive regulation of protein binding | 60/8552 | 85/18723 | 2.83e-06 | 3.22e-05 | 60 |
| GO:00071799 | Esophagus | ESCC | transforming growth factor beta receptor signaling pathway | 121/8552 | 198/18723 | 8.26e-06 | 8.03e-05 | 121 |
| GO:001072010 | Esophagus | ESCC | positive regulation of cell development | 172/8552 | 298/18723 | 1.74e-05 | 1.55e-04 | 172 |
| GO:00603242 | Esophagus | ESCC | face development | 34/8552 | 44/18723 | 1.90e-05 | 1.67e-04 | 34 |
| GO:00425524 | Esophagus | ESCC | myelination | 85/8552 | 134/18723 | 2.51e-05 | 2.13e-04 | 85 |
| GO:00072724 | Esophagus | ESCC | ensheathment of neurons | 86/8552 | 136/18723 | 2.68e-05 | 2.24e-04 | 86 |
| GO:00083664 | Esophagus | ESCC | axon ensheathment | 86/8552 | 136/18723 | 2.68e-05 | 2.24e-04 | 86 |
| GO:000188510 | Esophagus | ESCC | endothelial cell development | 44/8552 | 64/18723 | 1.59e-04 | 1.05e-03 | 44 |
| GO:000717810 | Esophagus | ESCC | transmembrane receptor protein serine/threonine kinase signaling pathway | 195/8552 | 355/18723 | 2.58e-04 | 1.58e-03 | 195 |
| GO:003432918 | Esophagus | ESCC | cell junction assembly | 227/8552 | 420/18723 | 3.06e-04 | 1.83e-03 | 227 |
| GO:004521620 | Esophagus | ESCC | cell-cell junction organization | 114/8552 | 200/18723 | 8.04e-04 | 4.16e-03 | 114 |
| GO:006102818 | Esophagus | ESCC | establishment of endothelial barrier | 32/8552 | 46/18723 | 9.01e-04 | 4.61e-03 | 32 |
| GO:00101711 | Esophagus | ESCC | body morphogenesis | 30/8552 | 43/18723 | 1.21e-03 | 5.88e-03 | 30 |
| GO:00603253 | Esophagus | ESCC | face morphogenesis | 21/8552 | 28/18723 | 1.57e-03 | 7.33e-03 | 21 |
| Page: 1 2 3 |
| Pathway ID | Tissue | Disease Stage | Description | Gene Ratio | Bg Ratio | pvalue | p.adjust | qvalue | Count |
| hsa05130211 | Esophagus | ESCC | Pathogenic Escherichia coli infection | 142/4205 | 197/8465 | 8.21e-11 | 1.06e-09 | 5.42e-10 | 142 |
| hsa051609 | Esophagus | ESCC | Hepatitis C | 107/4205 | 157/8465 | 1.75e-06 | 1.08e-05 | 5.55e-06 | 107 |
| hsa04530211 | Esophagus | ESCC | Tight junction | 105/4205 | 169/8465 | 6.73e-04 | 2.23e-03 | 1.14e-03 | 105 |
| hsa05130310 | Esophagus | ESCC | Pathogenic Escherichia coli infection | 142/4205 | 197/8465 | 8.21e-11 | 1.06e-09 | 5.42e-10 | 142 |
| hsa0516016 | Esophagus | ESCC | Hepatitis C | 107/4205 | 157/8465 | 1.75e-06 | 1.08e-05 | 5.55e-06 | 107 |
| hsa04530310 | Esophagus | ESCC | Tight junction | 105/4205 | 169/8465 | 6.73e-04 | 2.23e-03 | 1.14e-03 | 105 |
| hsa0513030 | Oral cavity | OSCC | Pathogenic Escherichia coli infection | 129/3704 | 197/8465 | 4.32e-10 | 5.17e-09 | 2.63e-09 | 129 |
| hsa051608 | Oral cavity | OSCC | Hepatitis C | 103/3704 | 157/8465 | 2.17e-08 | 1.96e-07 | 9.99e-08 | 103 |
| hsa0453030 | Oral cavity | OSCC | Tight junction | 102/3704 | 169/8465 | 8.68e-06 | 3.93e-05 | 2.00e-05 | 102 |
| hsa0467030 | Oral cavity | OSCC | Leukocyte transendothelial migration | 63/3704 | 114/8465 | 8.46e-03 | 1.96e-02 | 9.95e-03 | 63 |
| hsa05130114 | Oral cavity | OSCC | Pathogenic Escherichia coli infection | 129/3704 | 197/8465 | 4.32e-10 | 5.17e-09 | 2.63e-09 | 129 |
| hsa0516015 | Oral cavity | OSCC | Hepatitis C | 103/3704 | 157/8465 | 2.17e-08 | 1.96e-07 | 9.99e-08 | 103 |
| hsa04530114 | Oral cavity | OSCC | Tight junction | 102/3704 | 169/8465 | 8.68e-06 | 3.93e-05 | 2.00e-05 | 102 |
| hsa04670113 | Oral cavity | OSCC | Leukocyte transendothelial migration | 63/3704 | 114/8465 | 8.46e-03 | 1.96e-02 | 9.95e-03 | 63 |
| hsa0516024 | Oral cavity | LP | Hepatitis C | 73/2418 | 157/8465 | 1.14e-06 | 1.36e-05 | 8.74e-06 | 73 |
| hsa05130210 | Oral cavity | LP | Pathogenic Escherichia coli infection | 87/2418 | 197/8465 | 1.71e-06 | 1.78e-05 | 1.15e-05 | 87 |
| hsa0516034 | Oral cavity | LP | Hepatitis C | 73/2418 | 157/8465 | 1.14e-06 | 1.36e-05 | 8.74e-06 | 73 |
| hsa0513038 | Oral cavity | LP | Pathogenic Escherichia coli infection | 87/2418 | 197/8465 | 1.71e-06 | 1.78e-05 | 1.15e-05 | 87 |
| Page: 1 |
Top |
Cell-cell communication analysis |
| Identification of potential cell-cell interactions between two cell types and their ligand-receptor pairs for different disease states |
| Ligand | Receptor | LRpair | Pathway | Tissue | Disease Stage |
| Page: 1 |
Top |
Single-cell gene regulatory network inference analysis |
| Find out the significant the regulons (TFs) and the target genes of each regulon across cell types for different disease states |
| TF | Cell Type | Tissue | Disease Stage | Target Gene | RSS | Regulon Activity |
| ∗The dot plots of a searched regulon are shown for all cell subpopulations in each disease state of each tissue based on the regulon specific score inferred using pySCENIC and by calculating the average expression. |
| Page: 1 |
Top |
Somatic mutation of malignant transformation related genes |
| Annotation of somatic variants for genes involved in malignant transformation |
| Hugo Symbol | Variant Class | Variant Classification | dbSNP RS | HGVSc | HGVSp | HGVSp Short | SWISSPROT | BIOTYPE | SIFT | PolyPhen | Tumor Sample Barcode | Tissue | Histology | Sex | Age | Stage | Therapy Types | Drugs | Outcome |
| CLDN5 | SNV | Missense_Mutation | c.415N>C | p.Cys139Arg | p.C139R | protein_coding | deleterious(0) | probably_damaging(1) | TCGA-BH-A0DL-01 | Breast | breast invasive carcinoma | Female | <65 | I/II | Chemotherapy | cytoxan | CR | ||
| CLDN5 | SNV | Missense_Mutation | novel | c.10N>A | p.Ala4Thr | p.A4T | protein_coding | deleterious_low_confidence(0) | benign(0) | TCGA-AA-A010-01 | Colorectum | colon adenocarcinoma | Female | <65 | I/II | Chemotherapy | folinic | CR | |
| CLDN5 | SNV | Missense_Mutation | c.217N>A | p.Gly73Ser | p.G73S | protein_coding | tolerated_low_confidence(0.89) | benign(0) | TCGA-DY-A1DG-01 | Colorectum | rectum adenocarcinoma | Male | >=65 | I/II | Unknown | Unknown | PD | ||
| CLDN5 | insertion | Frame_Shift_Ins | novel | c.90_91insC | p.Gly31ArgfsTer307 | p.G31Rfs*307 | protein_coding | TCGA-AD-6889-01 | Colorectum | colon adenocarcinoma | Male | >=65 | I/II | Chemotherapy | xeloda | PD | |||
| CLDN5 | SNV | Missense_Mutation | novel | c.470N>T | p.Ala157Val | p.A157V | protein_coding | deleterious(0.01) | possibly_damaging(0.771) | TCGA-AP-A1DK-01 | Endometrium | uterine corpus endometrioid carcinoma | Female | <65 | I/II | Unknown | Unknown | SD | |
| CLDN5 | SNV | Missense_Mutation | novel | c.187N>A | p.Ala63Thr | p.A63T | protein_coding | tolerated_low_confidence(0.19) | benign(0.001) | TCGA-AP-A1DK-01 | Endometrium | uterine corpus endometrioid carcinoma | Female | <65 | I/II | Unknown | Unknown | SD | |
| CLDN5 | insertion | Frame_Shift_Ins | rs768198935 | c.314dupG | p.Leu106SerfsTer232 | p.L106Sfs*232 | protein_coding | TCGA-SL-A6JA-01 | Endometrium | uterine corpus endometrioid carcinoma | Female | >=65 | I/II | Unknown | Unknown | SD | |||
| CLDN5 | SNV | Missense_Mutation | novel | c.575N>A | p.Cys192Tyr | p.C192Y | protein_coding | deleterious(0) | probably_damaging(0.952) | TCGA-ZP-A9D0-01 | Liver | liver hepatocellular carcinoma | Female | >=65 | I/II | Unknown | Unknown | SD | |
| CLDN5 | SNV | Missense_Mutation | novel | c.434N>T | p.Gly145Val | p.G145V | protein_coding | deleterious(0) | probably_damaging(0.999) | TCGA-55-6972-01 | Lung | lung adenocarcinoma | Male | >=65 | I/II | Unknown | Unknown | SD | |
| CLDN5 | SNV | Missense_Mutation | c.487C>A | p.Gln163Lys | p.Q163K | protein_coding | deleterious(0.01) | probably_damaging(0.921) | TCGA-46-3769-01 | Lung | lung squamous cell carcinoma | Male | <65 | III/IV | Chemotherapy | cisplatin | SD |
| Page: 1 2 |
Top |
Related drugs of malignant transformation related genes |
| Identification of chemicals and drugs interact with genes involved in malignant transfromation |
| (DGIdb 4.0) |
| Entrez ID | Symbol | Category | Interaction Types | Drug Claim Name | Drug Name | PMIDs |
| Page: 1 |

Copyright 2023-Present -The University of Texas Health Science Center at Houston |