
|
|||||
|
 | |
| |
| |
| |
| |
| |
|
Gene: CLDN23 |
Gene summary for CLDN23 |
| Gene information | Species | Human | Gene symbol | CLDN23 | Gene ID | 137075 |
| Gene name | claudin 23 | |
| Gene Alias | CLDNL | |
| Cytomap | 8p23.1 | |
| Gene Type | protein-coding | GO ID | GO:0007043 | UniProtAcc | Q96B33 |
Top |
Malignant transformation analysis |
| Identification of the aberrant gene expression in precancerous and cancerous lesions by comparing the gene expression of stem-like cells in diseased tissues with normal stem cells |
| Entrez ID | Symbol | Replicates | Species | Organ | Tissue | Adj P-value | Log2FC | Malignancy |
| 137075 | CLDN23 | LZE24T | Human | Esophagus | ESCC | 9.19e-06 | 1.90e-01 | 0.0596 |
| 137075 | CLDN23 | P1T-E | Human | Esophagus | ESCC | 4.62e-03 | 2.51e-01 | 0.0875 |
| 137075 | CLDN23 | P8T-E | Human | Esophagus | ESCC | 2.05e-07 | 1.64e-01 | 0.0889 |
| 137075 | CLDN23 | P9T-E | Human | Esophagus | ESCC | 1.11e-03 | 1.34e-01 | 0.1131 |
| 137075 | CLDN23 | P12T-E | Human | Esophagus | ESCC | 9.02e-11 | 2.65e-01 | 0.1122 |
| 137075 | CLDN23 | P16T-E | Human | Esophagus | ESCC | 4.44e-08 | 1.91e-01 | 0.1153 |
| 137075 | CLDN23 | P23T-E | Human | Esophagus | ESCC | 1.48e-05 | 1.91e-01 | 0.108 |
| 137075 | CLDN23 | P24T-E | Human | Esophagus | ESCC | 8.40e-04 | 1.24e-01 | 0.1287 |
| 137075 | CLDN23 | P26T-E | Human | Esophagus | ESCC | 1.78e-03 | 7.82e-02 | 0.1276 |
| 137075 | CLDN23 | P28T-E | Human | Esophagus | ESCC | 4.19e-25 | 4.69e-01 | 0.1149 |
| 137075 | CLDN23 | P30T-E | Human | Esophagus | ESCC | 1.89e-05 | 2.47e-01 | 0.137 |
| 137075 | CLDN23 | P32T-E | Human | Esophagus | ESCC | 8.84e-05 | 1.03e-01 | 0.1666 |
| 137075 | CLDN23 | P39T-E | Human | Esophagus | ESCC | 4.17e-05 | 9.47e-02 | 0.0894 |
| 137075 | CLDN23 | P47T-E | Human | Esophagus | ESCC | 1.97e-10 | 2.15e-01 | 0.1067 |
| 137075 | CLDN23 | P48T-E | Human | Esophagus | ESCC | 3.97e-04 | 1.10e-01 | 0.0959 |
| 137075 | CLDN23 | P52T-E | Human | Esophagus | ESCC | 1.71e-04 | 1.39e-01 | 0.1555 |
| 137075 | CLDN23 | P57T-E | Human | Esophagus | ESCC | 2.06e-08 | 1.77e-01 | 0.0926 |
| 137075 | CLDN23 | P62T-E | Human | Esophagus | ESCC | 9.51e-16 | 3.62e-01 | 0.1302 |
| 137075 | CLDN23 | P74T-E | Human | Esophagus | ESCC | 8.25e-13 | 3.58e-01 | 0.1479 |
| 137075 | CLDN23 | P75T-E | Human | Esophagus | ESCC | 2.05e-07 | 1.80e-01 | 0.1125 |
| Page: 1 2 |
| Tissue | Expression Dynamics | Abbreviation |
| Esophagus | 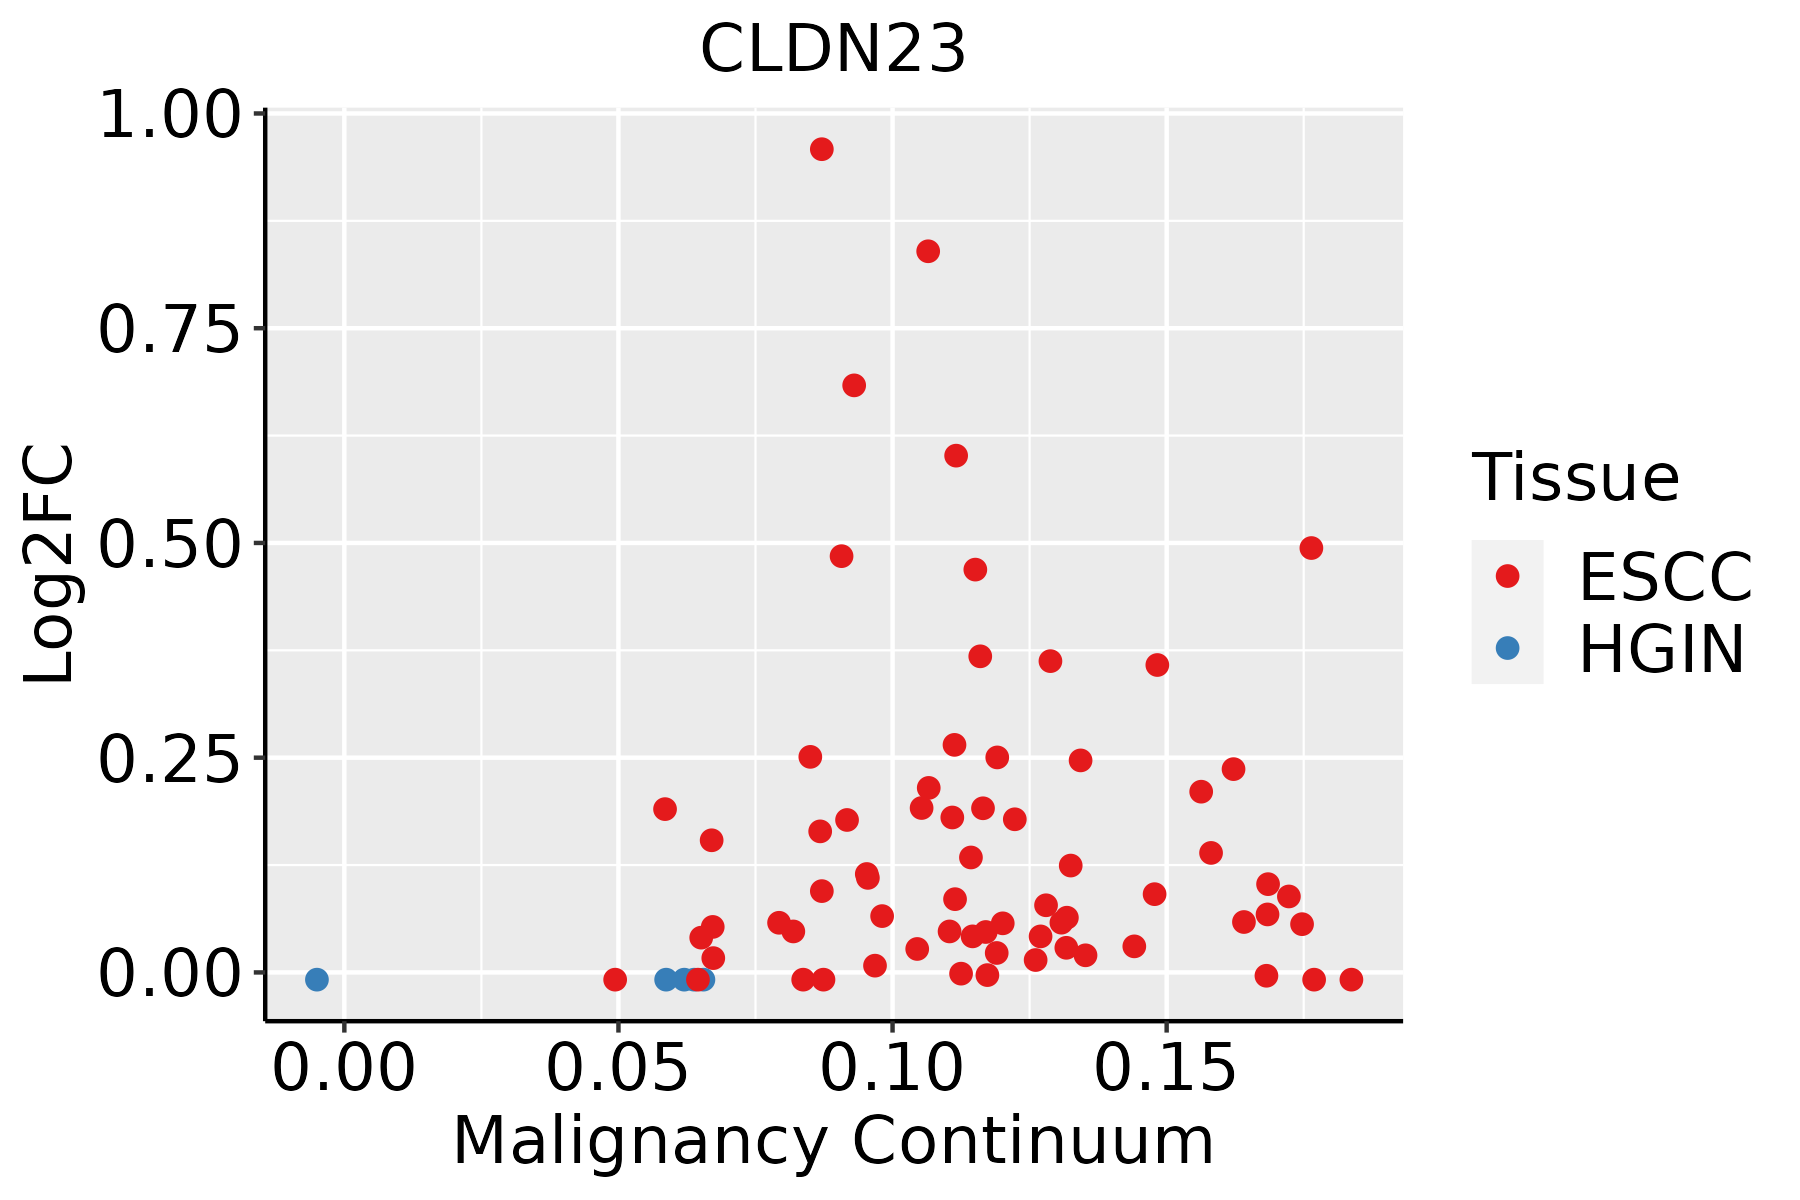 | ESCC: Esophageal squamous cell carcinoma |
| HGIN: High-grade intraepithelial neoplasias | ||
| LGIN: Low-grade intraepithelial neoplasias |
| ∗log2FC in expression of this searched gene in stem-like cells from each diseased tissue sample relative to stem-like cells in normal samples in each tissue plotted against the malignancy continuum. Samples are colored based on if they are from different disease stage. |
Top |
Malignant transformation related pathway analysis |
| Find out the enriched GO biological processes and KEGG pathways involved in transition from healthy to precancer to cancer |
| Tissue | Disease Stage | Enriched GO biological Processes |
| Colorectum | AD |  |
| Colorectum | SER |  |
| Colorectum | MSS |  |
| Colorectum | MSI-H |  |
| Colorectum | FAP |  |
| ∗Top 15 enriched GO BP terms are showed in the bar plot of each disease state in each tissue. Each row represents a significant GO biological process which is colored according to the -log10(p.adjust). |
| Page: 1 2 3 4 5 6 7 8 9 |
| GO ID | Tissue | Disease Stage | Description | Gene Ratio | Bg Ratio | pvalue | p.adjust | Count |
| GO:003432918 | Esophagus | ESCC | cell junction assembly | 227/8552 | 420/18723 | 3.06e-04 | 1.83e-03 | 227 |
| GO:004521620 | Esophagus | ESCC | cell-cell junction organization | 114/8552 | 200/18723 | 8.04e-04 | 4.16e-03 | 114 |
| GO:004329718 | Esophagus | ESCC | apical junction assembly | 48/8552 | 78/18723 | 3.45e-03 | 1.41e-02 | 48 |
| Page: 1 |
| Pathway ID | Tissue | Disease Stage | Description | Gene Ratio | Bg Ratio | pvalue | p.adjust | qvalue | Count |
| hsa05130211 | Esophagus | ESCC | Pathogenic Escherichia coli infection | 142/4205 | 197/8465 | 8.21e-11 | 1.06e-09 | 5.42e-10 | 142 |
| hsa051609 | Esophagus | ESCC | Hepatitis C | 107/4205 | 157/8465 | 1.75e-06 | 1.08e-05 | 5.55e-06 | 107 |
| hsa04530211 | Esophagus | ESCC | Tight junction | 105/4205 | 169/8465 | 6.73e-04 | 2.23e-03 | 1.14e-03 | 105 |
| hsa05130310 | Esophagus | ESCC | Pathogenic Escherichia coli infection | 142/4205 | 197/8465 | 8.21e-11 | 1.06e-09 | 5.42e-10 | 142 |
| hsa0516016 | Esophagus | ESCC | Hepatitis C | 107/4205 | 157/8465 | 1.75e-06 | 1.08e-05 | 5.55e-06 | 107 |
| hsa04530310 | Esophagus | ESCC | Tight junction | 105/4205 | 169/8465 | 6.73e-04 | 2.23e-03 | 1.14e-03 | 105 |
| Page: 1 |
Top |
Cell-cell communication analysis |
| Identification of potential cell-cell interactions between two cell types and their ligand-receptor pairs for different disease states |
| Ligand | Receptor | LRpair | Pathway | Tissue | Disease Stage |
| Page: 1 |
Top |
Single-cell gene regulatory network inference analysis |
| Find out the significant the regulons (TFs) and the target genes of each regulon across cell types for different disease states |
| TF | Cell Type | Tissue | Disease Stage | Target Gene | RSS | Regulon Activity |
| ∗The dot plots of a searched regulon are shown for all cell subpopulations in each disease state of each tissue based on the regulon specific score inferred using pySCENIC and by calculating the average expression. |
| Page: 1 |
Top |
Somatic mutation of malignant transformation related genes |
| Annotation of somatic variants for genes involved in malignant transformation |
| Hugo Symbol | Variant Class | Variant Classification | dbSNP RS | HGVSc | HGVSp | HGVSp Short | SWISSPROT | BIOTYPE | SIFT | PolyPhen | Tumor Sample Barcode | Tissue | Histology | Sex | Age | Stage | Therapy Types | Drugs | Outcome |
| CLDN23 | SNV | Missense_Mutation | novel | c.847G>A | p.Asp283Asn | p.D283N | Q96B33 | protein_coding | tolerated_low_confidence(0.48) | benign(0.003) | TCGA-EA-A410-01 | Cervix | cervical & endocervical cancer | Female | <65 | I/II | Unknown | Unknown | SD |
| CLDN23 | SNV | Missense_Mutation | c.414N>A | p.Phe138Leu | p.F138L | Q96B33 | protein_coding | tolerated(0.66) | benign(0.022) | TCGA-AA-3510-01 | Colorectum | colon adenocarcinoma | Male | >=65 | I/II | Unknown | Unknown | SD | |
| CLDN23 | SNV | Missense_Mutation | novel | c.854N>T | p.Ser285Leu | p.S285L | Q96B33 | protein_coding | tolerated_low_confidence(0.06) | benign(0.001) | TCGA-AX-A1C4-01 | Endometrium | uterine corpus endometrioid carcinoma | Female | <65 | I/II | Unknown | Unknown | SD |
| CLDN23 | SNV | Missense_Mutation | rs373434191 | c.575N>A | p.Arg192His | p.R192H | Q96B33 | protein_coding | tolerated(0.17) | benign(0) | TCGA-BG-A0MQ-01 | Endometrium | uterine corpus endometrioid carcinoma | Female | >=65 | I/II | Unknown | Unknown | SD |
| CLDN23 | SNV | Missense_Mutation | c.545N>T | p.Ala182Val | p.A182V | Q96B33 | protein_coding | tolerated(0.5) | benign(0.003) | TCGA-CV-7253-01 | Oral cavity | head & neck squamous cell carcinoma | Male | <65 | I/II | Unknown | Unknown | PD | |
| CLDN23 | SNV | Missense_Mutation | novel | c.382N>A | p.Gly128Ser | p.G128S | Q96B33 | protein_coding | tolerated(1) | benign(0.005) | TCGA-XJ-A9DX-01 | Prostate | prostate adenocarcinoma | Male | <65 | 9 | Hormone Therapy | casodex | SD |
| CLDN23 | SNV | Missense_Mutation | c.403N>C | p.Tyr135His | p.Y135H | Q96B33 | protein_coding | deleterious(0) | probably_damaging(1) | TCGA-BR-4361-01 | Stomach | stomach adenocarcinoma | Female | >=65 | III/IV | Unknown | Unknown | SD | |
| CLDN23 | SNV | Missense_Mutation | c.545N>T | p.Ala182Val | p.A182V | Q96B33 | protein_coding | tolerated(0.5) | benign(0.003) | TCGA-CD-8536-01 | Stomach | stomach adenocarcinoma | Male | >=65 | I/II | Chemotherapy | epirubicin | CR | |
| CLDN23 | SNV | Missense_Mutation | novel | c.395N>G | p.Val132Gly | p.V132G | Q96B33 | protein_coding | deleterious(0) | possibly_damaging(0.516) | TCGA-CG-5721-01 | Stomach | stomach adenocarcinoma | Male | <65 | III/IV | Unknown | Unknown | SD |
| Page: 1 |
Top |
Related drugs of malignant transformation related genes |
| Identification of chemicals and drugs interact with genes involved in malignant transfromation |
| (DGIdb 4.0) |
| Entrez ID | Symbol | Category | Interaction Types | Drug Claim Name | Drug Name | PMIDs |
| Page: 1 |

Copyright 2023-Present -The University of Texas Health Science Center at Houston |