
|
|||||
|
 | |
| |
| |
| |
| |
| |
|
Gene: CLDN19 |
Gene summary for CLDN19 |
| Gene information | Species | Human | Gene symbol | CLDN19 | Gene ID | 149461 |
| Gene name | claudin 19 | |
| Gene Alias | HOMG5 | |
| Cytomap | 1p34.2 | |
| Gene Type | protein-coding | GO ID | GO:0001508 | UniProtAcc | Q8N6F1 |
Top |
Malignant transformation analysis |
| Identification of the aberrant gene expression in precancerous and cancerous lesions by comparing the gene expression of stem-like cells in diseased tissues with normal stem cells |
| Entrez ID | Symbol | Replicates | Species | Organ | Tissue | Adj P-value | Log2FC | Malignancy |
| 149461 | CLDN19 | HCC1 | Human | Liver | HCC | 2.10e-06 | 7.08e-01 | 0.5336 |
| 149461 | CLDN19 | HCC2 | Human | Liver | HCC | 1.30e-15 | 1.42e+00 | 0.5341 |
| 149461 | CLDN19 | HCC5 | Human | Liver | HCC | 8.91e-07 | 6.20e-01 | 0.4932 |
| 149461 | CLDN19 | S014 | Human | Liver | HCC | 1.99e-11 | 3.73e-01 | 0.2254 |
| 149461 | CLDN19 | S015 | Human | Liver | HCC | 3.09e-24 | 7.62e-01 | 0.2375 |
| 149461 | CLDN19 | S016 | Human | Liver | HCC | 5.17e-21 | 5.44e-01 | 0.2243 |
| Page: 1 |
| Tissue | Expression Dynamics | Abbreviation |
| Liver | 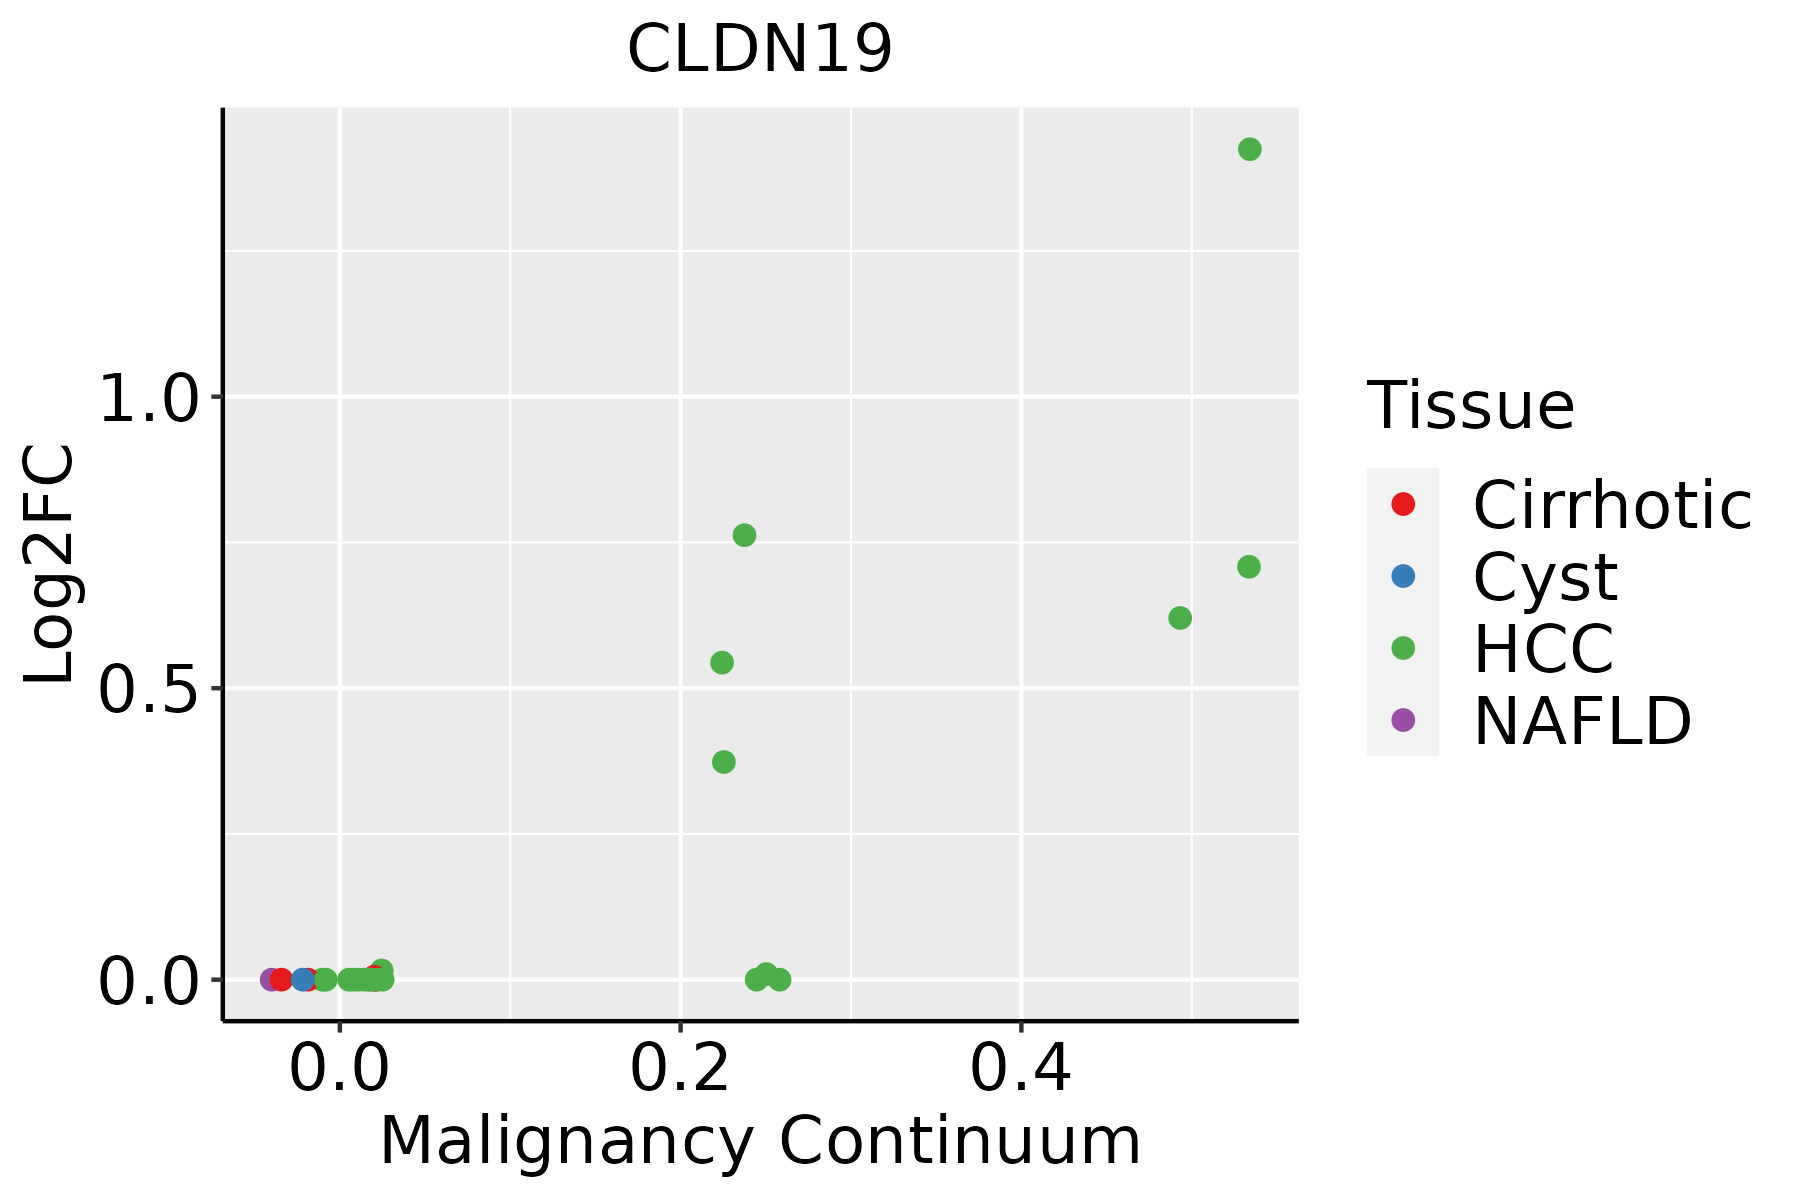 | HCC: Hepatocellular carcinoma |
| NAFLD: Non-alcoholic fatty liver disease |
| ∗log2FC in expression of this searched gene in stem-like cells from each diseased tissue sample relative to stem-like cells in normal samples in each tissue plotted against the malignancy continuum. Samples are colored based on if they are from different disease stage. |
Top |
Malignant transformation related pathway analysis |
| Find out the enriched GO biological processes and KEGG pathways involved in transition from healthy to precancer to cancer |
| Tissue | Disease Stage | Enriched GO biological Processes |
| Colorectum | AD |  |
| Colorectum | SER |  |
| Colorectum | MSS |  |
| Colorectum | MSI-H |  |
| Colorectum | FAP |  |
| ∗Top 15 enriched GO BP terms are showed in the bar plot of each disease state in each tissue. Each row represents a significant GO biological process which is colored according to the -log10(p.adjust). |
| Page: 1 2 3 4 5 6 7 8 9 |
| GO ID | Tissue | Disease Stage | Description | Gene Ratio | Bg Ratio | pvalue | p.adjust | Count |
| GO:004206022 | Liver | HCC | wound healing | 219/7958 | 422/18723 | 5.34e-05 | 5.04e-04 | 219 |
| GO:006104122 | Liver | HCC | regulation of wound healing | 78/7958 | 134/18723 | 1.73e-04 | 1.36e-03 | 78 |
| GO:190303421 | Liver | HCC | regulation of response to wounding | 94/7958 | 167/18723 | 2.19e-04 | 1.66e-03 | 94 |
| GO:004521622 | Liver | HCC | cell-cell junction organization | 107/7958 | 200/18723 | 1.06e-03 | 6.11e-03 | 107 |
| GO:004329712 | Liver | HCC | apical junction assembly | 45/7958 | 78/18723 | 4.83e-03 | 2.03e-02 | 45 |
| GO:003153212 | Liver | HCC | actin cytoskeleton reorganization | 59/7958 | 107/18723 | 5.57e-03 | 2.32e-02 | 59 |
| GO:01201935 | Liver | HCC | tight junction organization | 45/7958 | 80/18723 | 9.02e-03 | 3.48e-02 | 45 |
| GO:01201925 | Liver | HCC | tight junction assembly | 42/7958 | 74/18723 | 9.32e-03 | 3.57e-02 | 42 |
| GO:000704312 | Liver | HCC | cell-cell junction assembly | 76/7958 | 146/18723 | 1.23e-02 | 4.47e-02 | 76 |
| Page: 1 |
| Pathway ID | Tissue | Disease Stage | Description | Gene Ratio | Bg Ratio | pvalue | p.adjust | qvalue | Count |
| hsa0513042 | Liver | HCC | Pathogenic Escherichia coli infection | 129/4020 | 197/8465 | 2.02e-07 | 2.50e-06 | 1.39e-06 | 129 |
| hsa0453042 | Liver | HCC | Tight junction | 110/4020 | 169/8465 | 2.45e-06 | 2.28e-05 | 1.27e-05 | 110 |
| hsa0516021 | Liver | HCC | Hepatitis C | 94/4020 | 157/8465 | 1.11e-03 | 4.10e-03 | 2.28e-03 | 94 |
| hsa0467042 | Liver | HCC | Leukocyte transendothelial migration | 68/4020 | 114/8465 | 5.79e-03 | 1.64e-02 | 9.15e-03 | 68 |
| hsa0513052 | Liver | HCC | Pathogenic Escherichia coli infection | 129/4020 | 197/8465 | 2.02e-07 | 2.50e-06 | 1.39e-06 | 129 |
| hsa0453052 | Liver | HCC | Tight junction | 110/4020 | 169/8465 | 2.45e-06 | 2.28e-05 | 1.27e-05 | 110 |
| hsa0516031 | Liver | HCC | Hepatitis C | 94/4020 | 157/8465 | 1.11e-03 | 4.10e-03 | 2.28e-03 | 94 |
| hsa0467052 | Liver | HCC | Leukocyte transendothelial migration | 68/4020 | 114/8465 | 5.79e-03 | 1.64e-02 | 9.15e-03 | 68 |
| Page: 1 |
Top |
Cell-cell communication analysis |
| Identification of potential cell-cell interactions between two cell types and their ligand-receptor pairs for different disease states |
| Ligand | Receptor | LRpair | Pathway | Tissue | Disease Stage |
| Page: 1 |
Top |
Single-cell gene regulatory network inference analysis |
| Find out the significant the regulons (TFs) and the target genes of each regulon across cell types for different disease states |
| TF | Cell Type | Tissue | Disease Stage | Target Gene | RSS | Regulon Activity |
| ∗The dot plots of a searched regulon are shown for all cell subpopulations in each disease state of each tissue based on the regulon specific score inferred using pySCENIC and by calculating the average expression. |
| Page: 1 |
Top |
Somatic mutation of malignant transformation related genes |
| Annotation of somatic variants for genes involved in malignant transformation |
| Hugo Symbol | Variant Class | Variant Classification | dbSNP RS | HGVSc | HGVSp | HGVSp Short | SWISSPROT | BIOTYPE | SIFT | PolyPhen | Tumor Sample Barcode | Tissue | Histology | Sex | Age | Stage | Therapy Types | Drugs | Outcome |
| CLDN19 | SNV | Missense_Mutation | c.629N>A | p.Pro210Gln | p.P210Q | Q8N6F1 | protein_coding | tolerated(0.48) | benign(0) | TCGA-AN-A0XN-01 | Breast | breast invasive carcinoma | Female | >=65 | III/IV | Unknown | Unknown | SD | |
| CLDN19 | SNV | Missense_Mutation | novel | c.281C>T | p.Ala94Val | p.A94V | Q8N6F1 | protein_coding | deleterious(0) | possibly_damaging(0.868) | TCGA-AA-3949-01 | Colorectum | colon adenocarcinoma | Female | >=65 | III/IV | Unknown | Unknown | SD |
| CLDN19 | SNV | Missense_Mutation | c.548N>A | p.Cys183Tyr | p.C183Y | Q8N6F1 | protein_coding | deleterious(0) | possibly_damaging(0.905) | TCGA-AD-6889-01 | Colorectum | colon adenocarcinoma | Male | >=65 | I/II | Chemotherapy | xeloda | PD | |
| CLDN19 | SNV | Missense_Mutation | c.242G>A | p.Arg81Gln | p.R81Q | Q8N6F1 | protein_coding | deleterious(0) | probably_damaging(1) | TCGA-CM-6162-01 | Colorectum | colon adenocarcinoma | Female | <65 | III/IV | Chemotherapy | oxaliplatin | SD | |
| CLDN19 | SNV | Missense_Mutation | rs571067526 | c.214N>A | p.Ala72Thr | p.A72T | Q8N6F1 | protein_coding | tolerated(0.24) | benign(0.322) | TCGA-AP-A059-01 | Endometrium | uterine corpus endometrioid carcinoma | Female | >=65 | I/II | Unknown | Unknown | SD |
| CLDN19 | SNV | Missense_Mutation | rs118203979 | c.59N>A | p.Gly20Asp | p.G20D | Q8N6F1 | protein_coding | deleterious(0) | probably_damaging(0.991) | TCGA-AP-A1DV-01 | Endometrium | uterine corpus endometrioid carcinoma | Female | <65 | I/II | Unknown | Unknown | SD |
| CLDN19 | SNV | Missense_Mutation | novel | c.233A>G | p.Gln78Arg | p.Q78R | Q8N6F1 | protein_coding | deleterious(0) | probably_damaging(1) | TCGA-B5-A11E-01 | Endometrium | uterine corpus endometrioid carcinoma | Female | <65 | I/II | Unknown | Unknown | SD |
| CLDN19 | SNV | Missense_Mutation | rs768309387 | c.239C>T | p.Ala80Val | p.A80V | Q8N6F1 | protein_coding | deleterious(0.01) | benign(0.327) | TCGA-B5-A3FC-01 | Endometrium | uterine corpus endometrioid carcinoma | Female | <65 | I/II | Unknown | Unknown | SD |
| CLDN19 | SNV | Missense_Mutation | novel | c.394N>C | p.Cys132Arg | p.C132R | Q8N6F1 | protein_coding | deleterious(0.01) | possibly_damaging(0.889) | TCGA-BG-A222-01 | Endometrium | uterine corpus endometrioid carcinoma | Female | <65 | I/II | Unknown | Unknown | SD |
| CLDN19 | SNV | Missense_Mutation | novel | c.327N>G | p.Asp109Glu | p.D109E | Q8N6F1 | protein_coding | tolerated(1) | benign(0.017) | TCGA-39-5040-01 | Lung | lung squamous cell carcinoma | Male | <65 | III/IV | Chemotherapy | cisplatin | PD |
| Page: 1 2 |
Top |
Related drugs of malignant transformation related genes |
| Identification of chemicals and drugs interact with genes involved in malignant transfromation |
| (DGIdb 4.0) |
| Entrez ID | Symbol | Category | Interaction Types | Drug Claim Name | Drug Name | PMIDs |
| Page: 1 |

Copyright 2023-Present -The University of Texas Health Science Center at Houston |