
|
|||||
|
 | |
| |
| |
| |
| |
| |
|
Gene: CLDN18 |
Gene summary for CLDN18 |
| Gene information | Species | Human | Gene symbol | CLDN18 | Gene ID | 51208 |
| Gene name | claudin 18 | |
| Gene Alias | SFTA5 | |
| Cytomap | 3q22.3 | |
| Gene Type | protein-coding | GO ID | GO:0001501 | UniProtAcc | P56856 |
Top |
Malignant transformation analysis |
| Identification of the aberrant gene expression in precancerous and cancerous lesions by comparing the gene expression of stem-like cells in diseased tissues with normal stem cells |
| Entrez ID | Symbol | Replicates | Species | Organ | Tissue | Adj P-value | Log2FC | Malignancy |
| 51208 | CLDN18 | RNA-P25T1-P25T1-1 | Human | Lung | AIS | 3.08e-13 | -1.83e-01 | -0.2116 |
| 51208 | CLDN18 | RNA-P25T1-P25T1-2 | Human | Lung | AIS | 2.85e-02 | -2.18e-01 | -0.1941 |
| 51208 | CLDN18 | RNA-P25T1-P25T1-3 | Human | Lung | AIS | 4.78e-07 | -4.26e-01 | -0.2107 |
| 51208 | CLDN18 | RNA-P25T1-P25T1-4 | Human | Lung | AIS | 3.19e-07 | -1.80e-01 | -0.2119 |
| 51208 | CLDN18 | RNA-P3T-P3T-1 | Human | Lung | IAC | 6.88e-06 | -1.14e+00 | 0.1829 |
| 51208 | CLDN18 | RNA-P3T-P3T-2 | Human | Lung | IAC | 2.10e-06 | -1.14e+00 | 0.1835 |
| 51208 | CLDN18 | RNA-P3T-P3T-4 | Human | Lung | IAC | 9.59e-07 | -1.14e+00 | 0.1859 |
| 51208 | CLDN18 | RNA-P6T2-P6T2-1 | Human | Lung | IAC | 2.34e-19 | -1.10e+00 | -0.0166 |
| 51208 | CLDN18 | RNA-P6T2-P6T2-2 | Human | Lung | IAC | 2.85e-19 | -1.12e+00 | -0.0132 |
| 51208 | CLDN18 | RNA-P6T2-P6T2-3 | Human | Lung | IAC | 1.80e-19 | -1.13e+00 | -0.013 |
| 51208 | CLDN18 | RNA-P6T2-P6T2-4 | Human | Lung | IAC | 3.15e-21 | -1.14e+00 | -0.0121 |
| 51208 | CLDN18 | RNA-P7T1-P7T1-4 | Human | Lung | AIS | 4.84e-02 | -1.08e+00 | -0.0809 |
| 51208 | CLDN18 | Pat01-B | Human | Stomach | GC | 3.67e-114 | -1.76e+00 | 0.5754 |
| 51208 | CLDN18 | Pat02-B | Human | Stomach | GC | 8.33e-99 | -8.27e-01 | 0.0368 |
| 51208 | CLDN18 | Pat03-B | Human | Stomach | GC | 4.21e-108 | -1.47e+00 | 0.3693 |
| 51208 | CLDN18 | Pat04-B | Human | Stomach | GC | 1.87e-61 | -7.70e-01 | -0.1483 |
| 51208 | CLDN18 | Pat05-B | Human | Stomach | GC | 2.80e-53 | -8.00e-01 | -0.0353 |
| 51208 | CLDN18 | Pat06-B | Human | Stomach | GC | 1.55e-91 | -4.60e-01 | -0.1961 |
| 51208 | CLDN18 | Pat07-B | Human | Stomach | GC | 1.06e-42 | -1.28e+00 | 0.0935 |
| 51208 | CLDN18 | Pat08-B | Human | Stomach | GC | 3.50e-44 | -1.45e+00 | 0.0182 |
| Page: 1 2 3 |
| Tissue | Expression Dynamics | Abbreviation |
| GC | 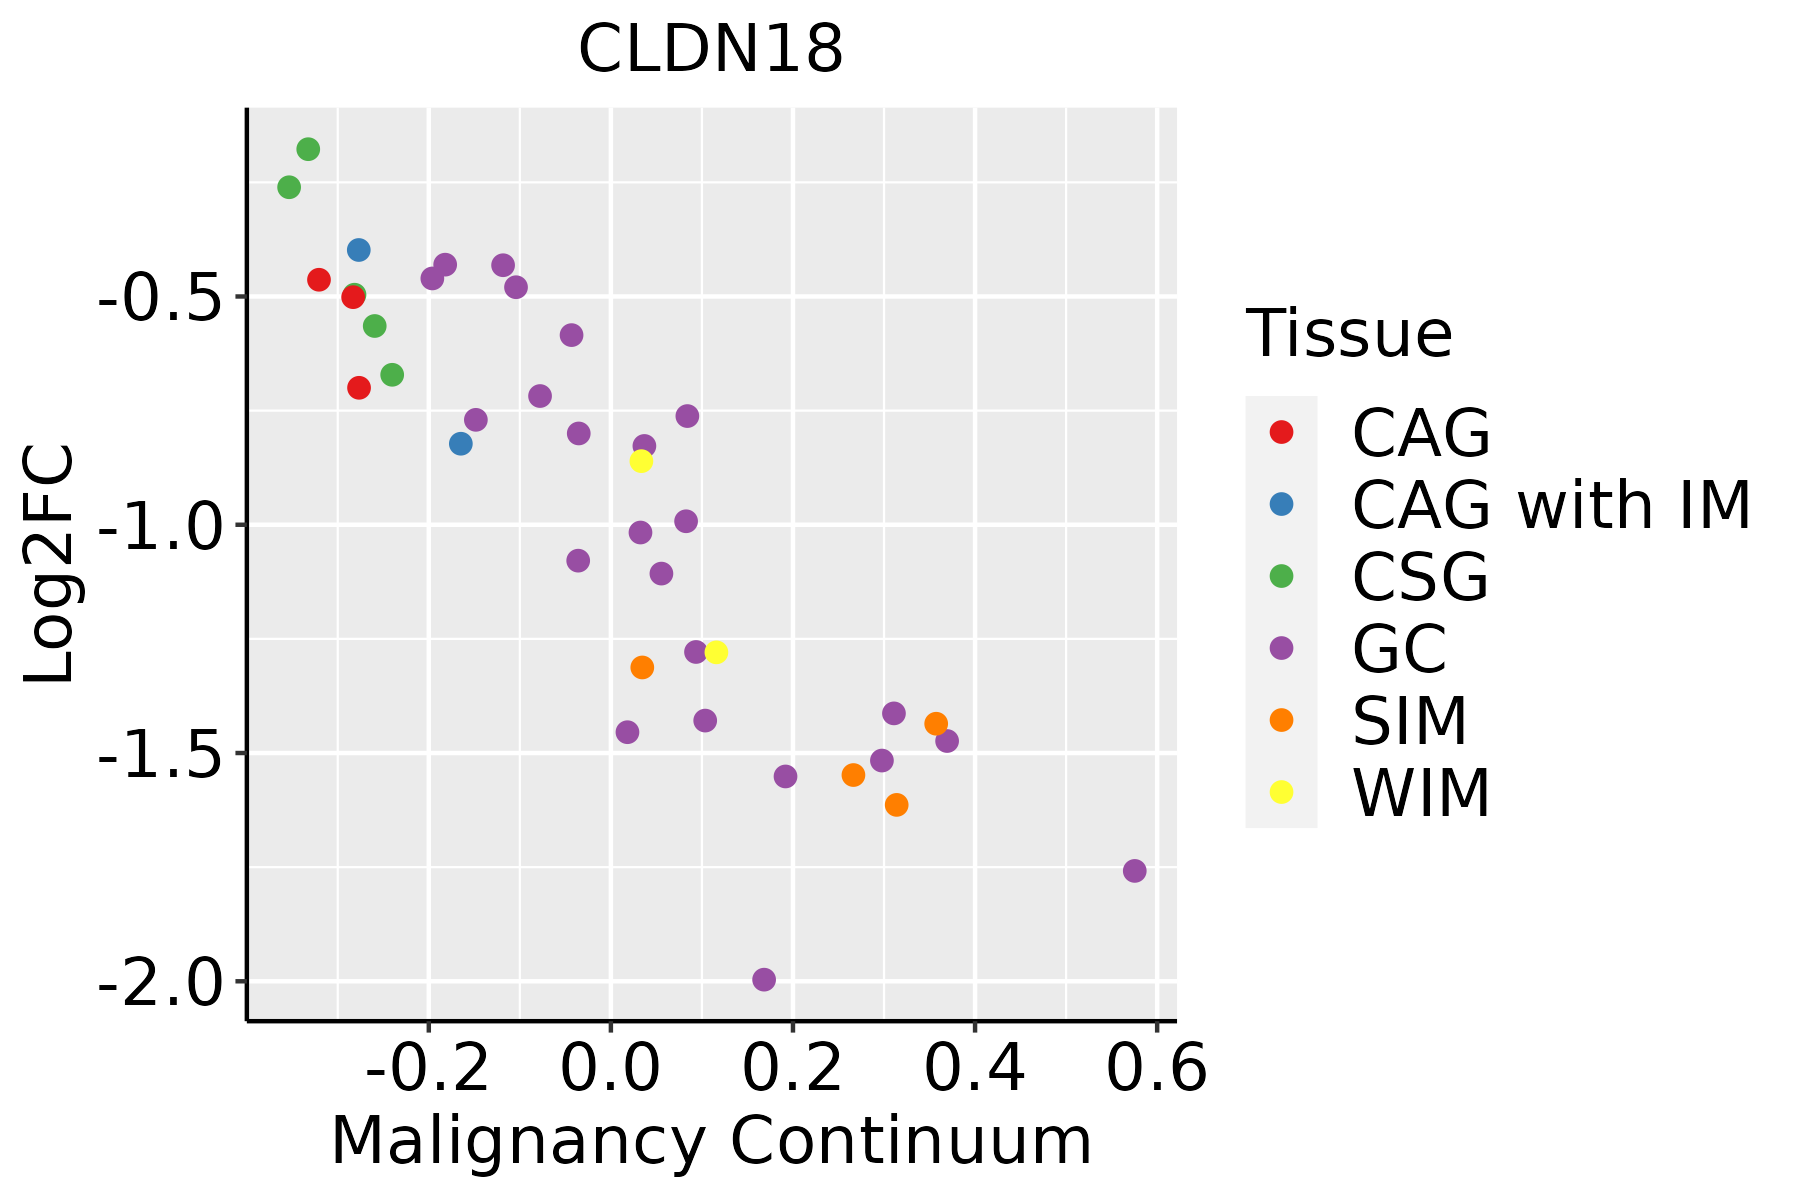 | CAG: Chronic atrophic gastritis |
| CAG with IM: Chronic atrophic gastritis with intestinal metaplasia | ||
| CSG: Chronic superficial gastritis | ||
| GC: Gastric cancer | ||
| SIM: Severe intestinal metaplasia | ||
| WIM: Wild intestinal metaplasia | ||
| Lung | 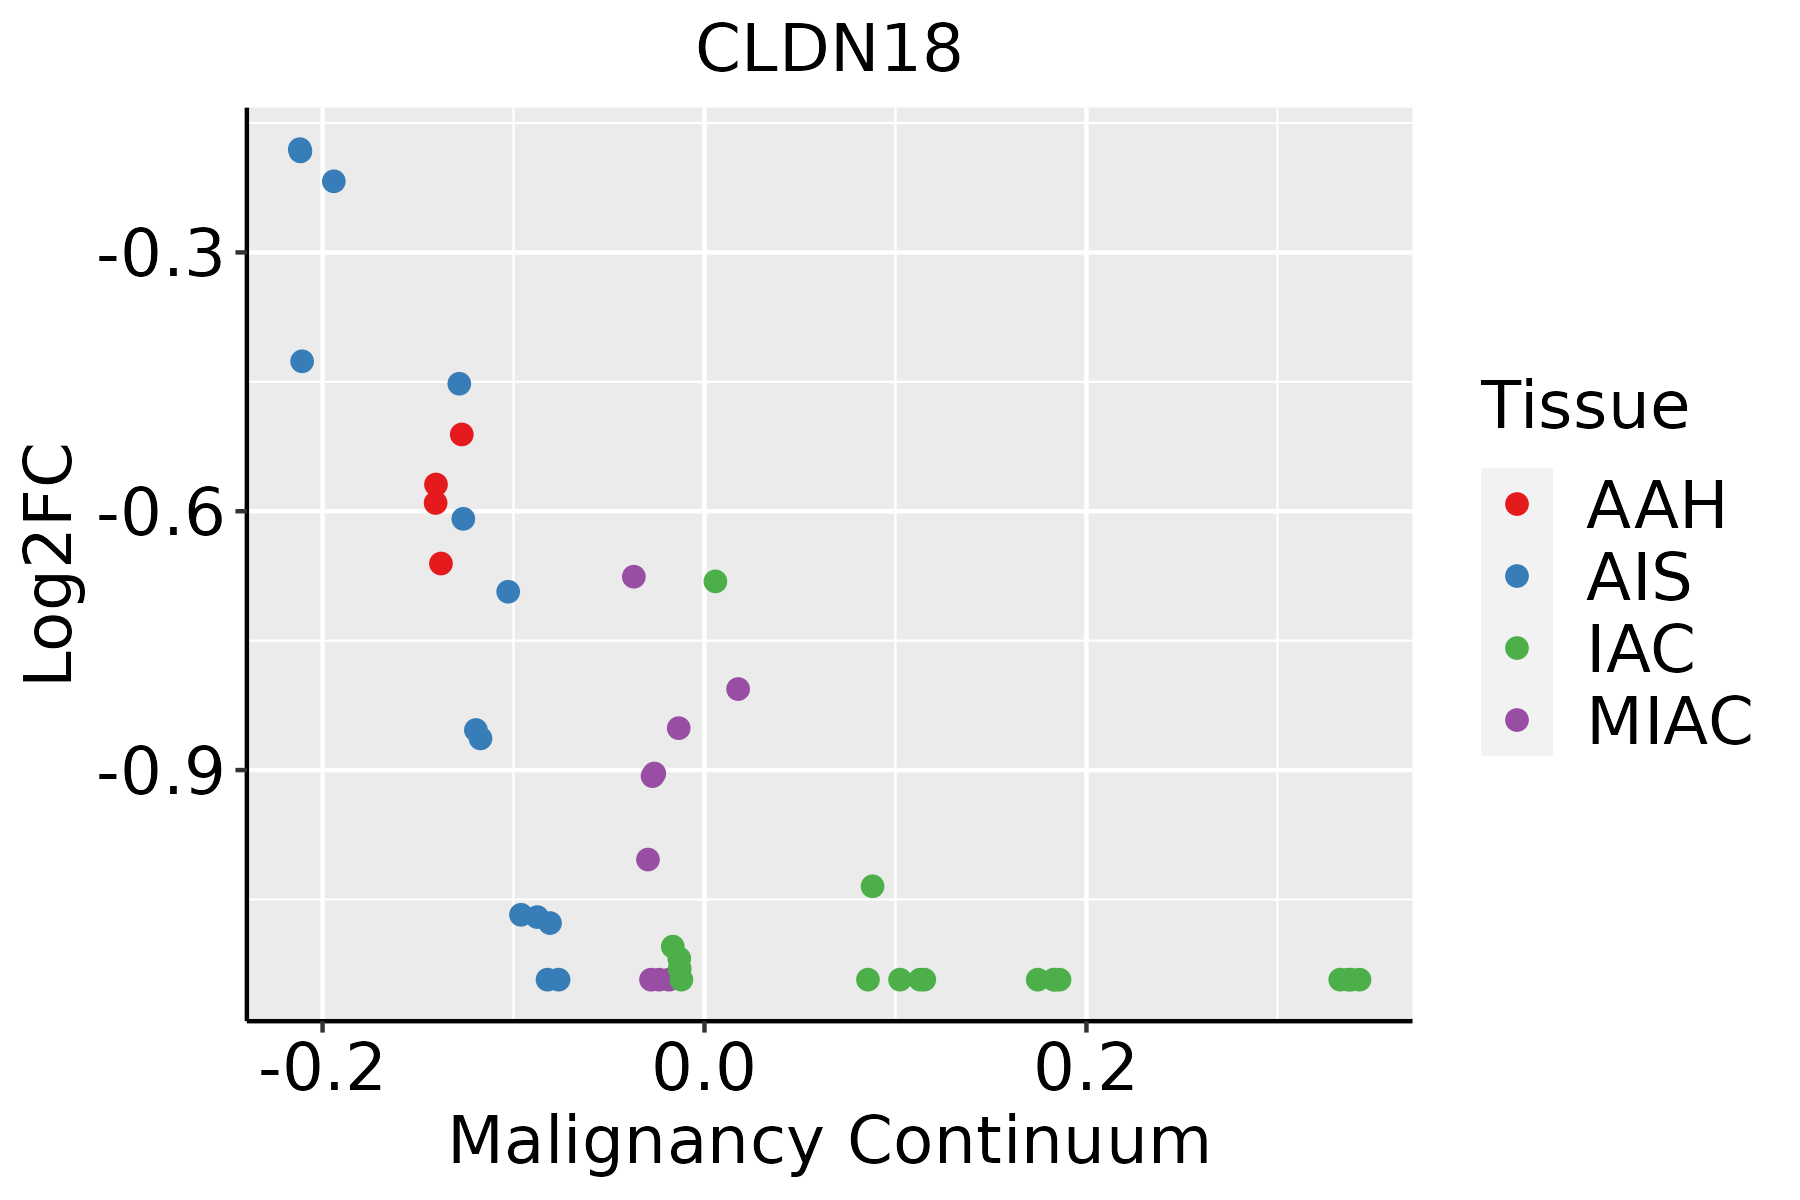 | AAH: Atypical adenomatous hyperplasia |
| AIS: Adenocarcinoma in situ | ||
| IAC: Invasive lung adenocarcinoma | ||
| MIA: Minimally invasive adenocarcinoma |
| ∗log2FC in expression of this searched gene in stem-like cells from each diseased tissue sample relative to stem-like cells in normal samples in each tissue plotted against the malignancy continuum. Samples are colored based on if they are from different disease stage. |
Top |
Malignant transformation related pathway analysis |
| Find out the enriched GO biological processes and KEGG pathways involved in transition from healthy to precancer to cancer |
| Tissue | Disease Stage | Enriched GO biological Processes |
| Colorectum | AD |  |
| Colorectum | SER |  |
| Colorectum | MSS |  |
| Colorectum | MSI-H |  |
| Colorectum | FAP |  |
| ∗Top 15 enriched GO BP terms are showed in the bar plot of each disease state in each tissue. Each row represents a significant GO biological process which is colored according to the -log10(p.adjust). |
| Page: 1 2 3 4 5 6 7 8 9 |
| GO ID | Tissue | Disease Stage | Description | Gene Ratio | Bg Ratio | pvalue | p.adjust | Count |
| GO:00343297 | Lung | IAC | cell junction assembly | 86/2061 | 420/18723 | 7.98e-09 | 1.10e-06 | 86 |
| GO:00300998 | Lung | IAC | myeloid cell differentiation | 70/2061 | 381/18723 | 1.12e-05 | 3.45e-04 | 70 |
| GO:00452168 | Lung | IAC | cell-cell junction organization | 43/2061 | 200/18723 | 1.21e-05 | 3.64e-04 | 43 |
| GO:00432977 | Lung | IAC | apical junction assembly | 22/2061 | 78/18723 | 2.31e-05 | 6.34e-04 | 22 |
| GO:01201926 | Lung | IAC | tight junction assembly | 20/2061 | 74/18723 | 1.03e-04 | 2.02e-03 | 20 |
| GO:01201936 | Lung | IAC | tight junction organization | 21/2061 | 80/18723 | 1.11e-04 | 2.14e-03 | 21 |
| GO:00070438 | Lung | IAC | cell-cell junction assembly | 31/2061 | 146/18723 | 2.38e-04 | 4.06e-03 | 31 |
| GO:00346127 | Lung | IAC | response to tumor necrosis factor | 46/2061 | 253/18723 | 4.28e-04 | 6.37e-03 | 46 |
| GO:00708305 | Lung | IAC | bicellular tight junction assembly | 18/2061 | 70/18723 | 4.40e-04 | 6.51e-03 | 18 |
| GO:00345047 | Lung | IAC | protein localization to nucleus | 50/2061 | 290/18723 | 8.71e-04 | 1.11e-02 | 50 |
| GO:00713567 | Lung | IAC | cellular response to tumor necrosis factor | 41/2061 | 229/18723 | 1.16e-03 | 1.35e-02 | 41 |
| GO:00018947 | Lung | IAC | tissue homeostasis | 46/2061 | 268/18723 | 1.50e-03 | 1.60e-02 | 46 |
| GO:00602497 | Lung | IAC | anatomical structure homeostasis | 51/2061 | 314/18723 | 2.91e-03 | 2.61e-02 | 51 |
| GO:00456378 | Lung | IAC | regulation of myeloid cell differentiation | 36/2061 | 210/18723 | 4.70e-03 | 3.68e-02 | 36 |
| GO:00025736 | Lung | IAC | myeloid leukocyte differentiation | 35/2061 | 208/18723 | 7.05e-03 | 4.83e-02 | 35 |
| GO:19037068 | Lung | IAC | regulation of hemopoiesis | 56/2061 | 367/18723 | 7.23e-03 | 4.94e-02 | 56 |
| GO:003432912 | Lung | AIS | cell junction assembly | 84/1849 | 420/18723 | 2.16e-10 | 5.71e-08 | 84 |
| GO:004521613 | Lung | AIS | cell-cell junction organization | 41/1849 | 200/18723 | 4.66e-06 | 2.31e-04 | 41 |
| GO:004329713 | Lung | AIS | apical junction assembly | 21/1849 | 78/18723 | 1.48e-05 | 5.40e-04 | 21 |
| GO:003009913 | Lung | AIS | myeloid cell differentiation | 63/1849 | 381/18723 | 3.05e-05 | 9.70e-04 | 63 |
| Page: 1 2 3 4 5 6 7 |
| Pathway ID | Tissue | Disease Stage | Description | Gene Ratio | Bg Ratio | pvalue | p.adjust | qvalue | Count |
| hsa0453016 | Lung | IAC | Tight junction | 43/1053 | 169/8465 | 2.44e-06 | 8.81e-05 | 5.85e-05 | 43 |
| hsa0513016 | Lung | IAC | Pathogenic Escherichia coli infection | 45/1053 | 197/8465 | 2.93e-05 | 6.14e-04 | 4.08e-04 | 45 |
| hsa0467016 | Lung | IAC | Leukocyte transendothelial migration | 30/1053 | 114/8465 | 4.03e-05 | 6.55e-04 | 4.35e-04 | 30 |
| hsa051606 | Lung | IAC | Hepatitis C | 33/1053 | 157/8465 | 1.53e-03 | 9.23e-03 | 6.13e-03 | 33 |
| hsa045146 | Lung | IAC | Cell adhesion molecules | 30/1053 | 157/8465 | 1.03e-02 | 3.83e-02 | 2.54e-02 | 30 |
| hsa0453017 | Lung | IAC | Tight junction | 43/1053 | 169/8465 | 2.44e-06 | 8.81e-05 | 5.85e-05 | 43 |
| hsa0513017 | Lung | IAC | Pathogenic Escherichia coli infection | 45/1053 | 197/8465 | 2.93e-05 | 6.14e-04 | 4.08e-04 | 45 |
| hsa0467017 | Lung | IAC | Leukocyte transendothelial migration | 30/1053 | 114/8465 | 4.03e-05 | 6.55e-04 | 4.35e-04 | 30 |
| hsa0516013 | Lung | IAC | Hepatitis C | 33/1053 | 157/8465 | 1.53e-03 | 9.23e-03 | 6.13e-03 | 33 |
| hsa0451411 | Lung | IAC | Cell adhesion molecules | 30/1053 | 157/8465 | 1.03e-02 | 3.83e-02 | 2.54e-02 | 30 |
| hsa0453023 | Lung | AIS | Tight junction | 46/961 | 169/8465 | 7.79e-09 | 4.33e-07 | 2.77e-07 | 46 |
| hsa0467023 | Lung | AIS | Leukocyte transendothelial migration | 29/961 | 114/8465 | 1.92e-05 | 4.08e-04 | 2.61e-04 | 29 |
| hsa0513023 | Lung | AIS | Pathogenic Escherichia coli infection | 42/961 | 197/8465 | 3.43e-05 | 5.62e-04 | 3.59e-04 | 42 |
| hsa0516022 | Lung | AIS | Hepatitis C | 29/961 | 157/8465 | 5.33e-03 | 2.61e-02 | 1.67e-02 | 29 |
| hsa0453033 | Lung | AIS | Tight junction | 46/961 | 169/8465 | 7.79e-09 | 4.33e-07 | 2.77e-07 | 46 |
| hsa0467033 | Lung | AIS | Leukocyte transendothelial migration | 29/961 | 114/8465 | 1.92e-05 | 4.08e-04 | 2.61e-04 | 29 |
| hsa0513033 | Lung | AIS | Pathogenic Escherichia coli infection | 42/961 | 197/8465 | 3.43e-05 | 5.62e-04 | 3.59e-04 | 42 |
| hsa0516032 | Lung | AIS | Hepatitis C | 29/961 | 157/8465 | 5.33e-03 | 2.61e-02 | 1.67e-02 | 29 |
| hsa0513012 | Stomach | GC | Pathogenic Escherichia coli infection | 43/708 | 197/8465 | 2.99e-09 | 6.39e-08 | 4.50e-08 | 43 |
| hsa0453012 | Stomach | GC | Tight junction | 33/708 | 169/8465 | 3.03e-06 | 4.65e-05 | 3.28e-05 | 33 |
| Page: 1 2 3 4 |
Top |
Cell-cell communication analysis |
| Identification of potential cell-cell interactions between two cell types and their ligand-receptor pairs for different disease states |
| Ligand | Receptor | LRpair | Pathway | Tissue | Disease Stage |
| Page: 1 |
Top |
Single-cell gene regulatory network inference analysis |
| Find out the significant the regulons (TFs) and the target genes of each regulon across cell types for different disease states |
| TF | Cell Type | Tissue | Disease Stage | Target Gene | RSS | Regulon Activity |
| ∗The dot plots of a searched regulon are shown for all cell subpopulations in each disease state of each tissue based on the regulon specific score inferred using pySCENIC and by calculating the average expression. |
| Page: 1 |
Top |
Somatic mutation of malignant transformation related genes |
| Annotation of somatic variants for genes involved in malignant transformation |
| Hugo Symbol | Variant Class | Variant Classification | dbSNP RS | HGVSc | HGVSp | HGVSp Short | SWISSPROT | BIOTYPE | SIFT | PolyPhen | Tumor Sample Barcode | Tissue | Histology | Sex | Age | Stage | Therapy Types | Drugs | Outcome |
| CLDN18 | SNV | Missense_Mutation | novel | c.164G>T | p.Arg55Leu | p.R55L | P56856 | protein_coding | tolerated(0.38) | benign(0.198) | TCGA-A7-A4SE-01 | Breast | breast invasive carcinoma | Female | <65 | I/II | Chemotherapy | adriamycin | CR |
| CLDN18 | SNV | Missense_Mutation | novel | c.593G>A | p.Gly198Asp | p.G198D | P56856 | protein_coding | tolerated(0.22) | possibly_damaging(0.764) | TCGA-E9-A5FL-01 | Breast | breast invasive carcinoma | Female | >=65 | I/II | Unknown | Unknown | SD |
| CLDN18 | insertion | Frame_Shift_Ins | novel | c.144_154dupGCTGTGGCGCT | p.Ser52CysfsTer35 | p.S52Cfs*35 | P56856 | protein_coding | TCGA-B6-A0RS-01 | Breast | breast invasive carcinoma | Female | <65 | I/II | Unknown | Unknown | PD | ||
| CLDN18 | SNV | Missense_Mutation | novel | c.41N>T | p.Ser14Leu | p.S14L | P56856 | protein_coding | deleterious(0.01) | benign(0.353) | TCGA-C5-A1MK-01 | Cervix | cervical & endocervical cancer | Female | >=65 | III/IV | Chemotherapy | carboplatin | PD |
| CLDN18 | SNV | Missense_Mutation | novel | c.7G>A | p.Val3Met | p.V3M | P56856 | protein_coding | tolerated(0.08) | benign(0.339) | TCGA-DG-A2KL-01 | Cervix | cervical & endocervical cancer | Female | <65 | I/II | Chemotherapy | cisplatin | SD |
| CLDN18 | SNV | Missense_Mutation | rs768414784 | c.184N>A | p.Glu62Lys | p.E62K | P56856 | protein_coding | deleterious(0.01) | probably_damaging(0.98) | TCGA-VS-A8EL-01 | Cervix | cervical & endocervical cancer | Female | <65 | I/II | Chemotherapy | cisplatin | CR |
| CLDN18 | SNV | Missense_Mutation | c.145C>T | p.Leu49Phe | p.L49F | P56856 | protein_coding | deleterious(0) | probably_damaging(1) | TCGA-AA-A010-01 | Colorectum | colon adenocarcinoma | Female | <65 | I/II | Chemotherapy | folinic | CR | |
| CLDN18 | SNV | Missense_Mutation | novel | c.421N>G | p.Asn141Asp | p.N141D | P56856 | protein_coding | tolerated(0.08) | benign(0.378) | TCGA-AD-6964-01 | Colorectum | colon adenocarcinoma | Male | <65 | III/IV | Chemotherapy | folfox | PD |
| CLDN18 | SNV | Missense_Mutation | c.77N>A | p.Gly26Glu | p.G26E | P56856 | protein_coding | tolerated(0.77) | benign(0.01) | TCGA-AD-A5EJ-01 | Colorectum | colon adenocarcinoma | Female | >=65 | I/II | Unknown | Unknown | SD | |
| CLDN18 | SNV | Missense_Mutation | novel | c.401N>T | p.Ala134Val | p.A134V | P56856 | protein_coding | tolerated(0.77) | benign(0.006) | TCGA-CA-6717-01 | Colorectum | colon adenocarcinoma | Male | <65 | I/II | Chemotherapy | oxaliplatin | CR |
| Page: 1 2 3 4 5 |
Top |
Related drugs of malignant transformation related genes |
| Identification of chemicals and drugs interact with genes involved in malignant transfromation |
| (DGIdb 4.0) |
| Entrez ID | Symbol | Category | Interaction Types | Drug Claim Name | Drug Name | PMIDs |
| 51208 | CLDN18 | KINASE, DRUGGABLE GENOME | antibody | 315661285 | ZOLBETUXIMAB | |
| 51208 | CLDN18 | KINASE, DRUGGABLE GENOME | CHEMBL2109427 | ZOLBETUXIMAB | ||
| 51208 | CLDN18 | KINASE, DRUGGABLE GENOME | Claudiximab | ZOLBETUXIMAB | ||
| 51208 | CLDN18 | KINASE, DRUGGABLE GENOME | CAR-CLD18 T cell |
| Page: 1 |

Copyright 2023-Present -The University of Texas Health Science Center at Houston |