
|
|||||
|
 | |
| |
| |
| |
| |
| |
|
Gene: CLDN16 |
Gene summary for CLDN16 |
| Gene information | Species | Human | Gene symbol | CLDN16 | Gene ID | 10686 |
| Gene name | claudin 16 | |
| Gene Alias | HOMG3 | |
| Cytomap | 3q28 | |
| Gene Type | protein-coding | GO ID | GO:0003008 | UniProtAcc | Q9Y5I7 |
Top |
Malignant transformation analysis |
| Identification of the aberrant gene expression in precancerous and cancerous lesions by comparing the gene expression of stem-like cells in diseased tissues with normal stem cells |
| Entrez ID | Symbol | Replicates | Species | Organ | Tissue | Adj P-value | Log2FC | Malignancy |
| 10686 | CLDN16 | HCC1 | Human | Liver | HCC | 5.61e-08 | 2.17e+00 | 0.5336 |
| 10686 | CLDN16 | HCC2 | Human | Liver | HCC | 3.33e-21 | 1.76e+00 | 0.5341 |
| 10686 | CLDN16 | HCC5 | Human | Liver | HCC | 3.84e-09 | 1.00e+00 | 0.4932 |
| 10686 | CLDN16 | male-WTA | Human | Thyroid | PTC | 6.09e-51 | 7.38e-01 | 0.1037 |
| 10686 | CLDN16 | PTC01 | Human | Thyroid | PTC | 2.57e-29 | 6.45e-01 | 0.1899 |
| 10686 | CLDN16 | PTC04 | Human | Thyroid | PTC | 5.17e-18 | 6.77e-01 | 0.1927 |
| 10686 | CLDN16 | PTC05 | Human | Thyroid | PTC | 1.56e-39 | 1.57e+00 | 0.2065 |
| 10686 | CLDN16 | PTC06 | Human | Thyroid | PTC | 1.46e-74 | 2.12e+00 | 0.2057 |
| 10686 | CLDN16 | PTC07 | Human | Thyroid | PTC | 2.71e-09 | 2.12e-01 | 0.2044 |
| Page: 1 |
| Tissue | Expression Dynamics | Abbreviation |
| Liver |  | HCC: Hepatocellular carcinoma |
| NAFLD: Non-alcoholic fatty liver disease | ||
| Thyroid | 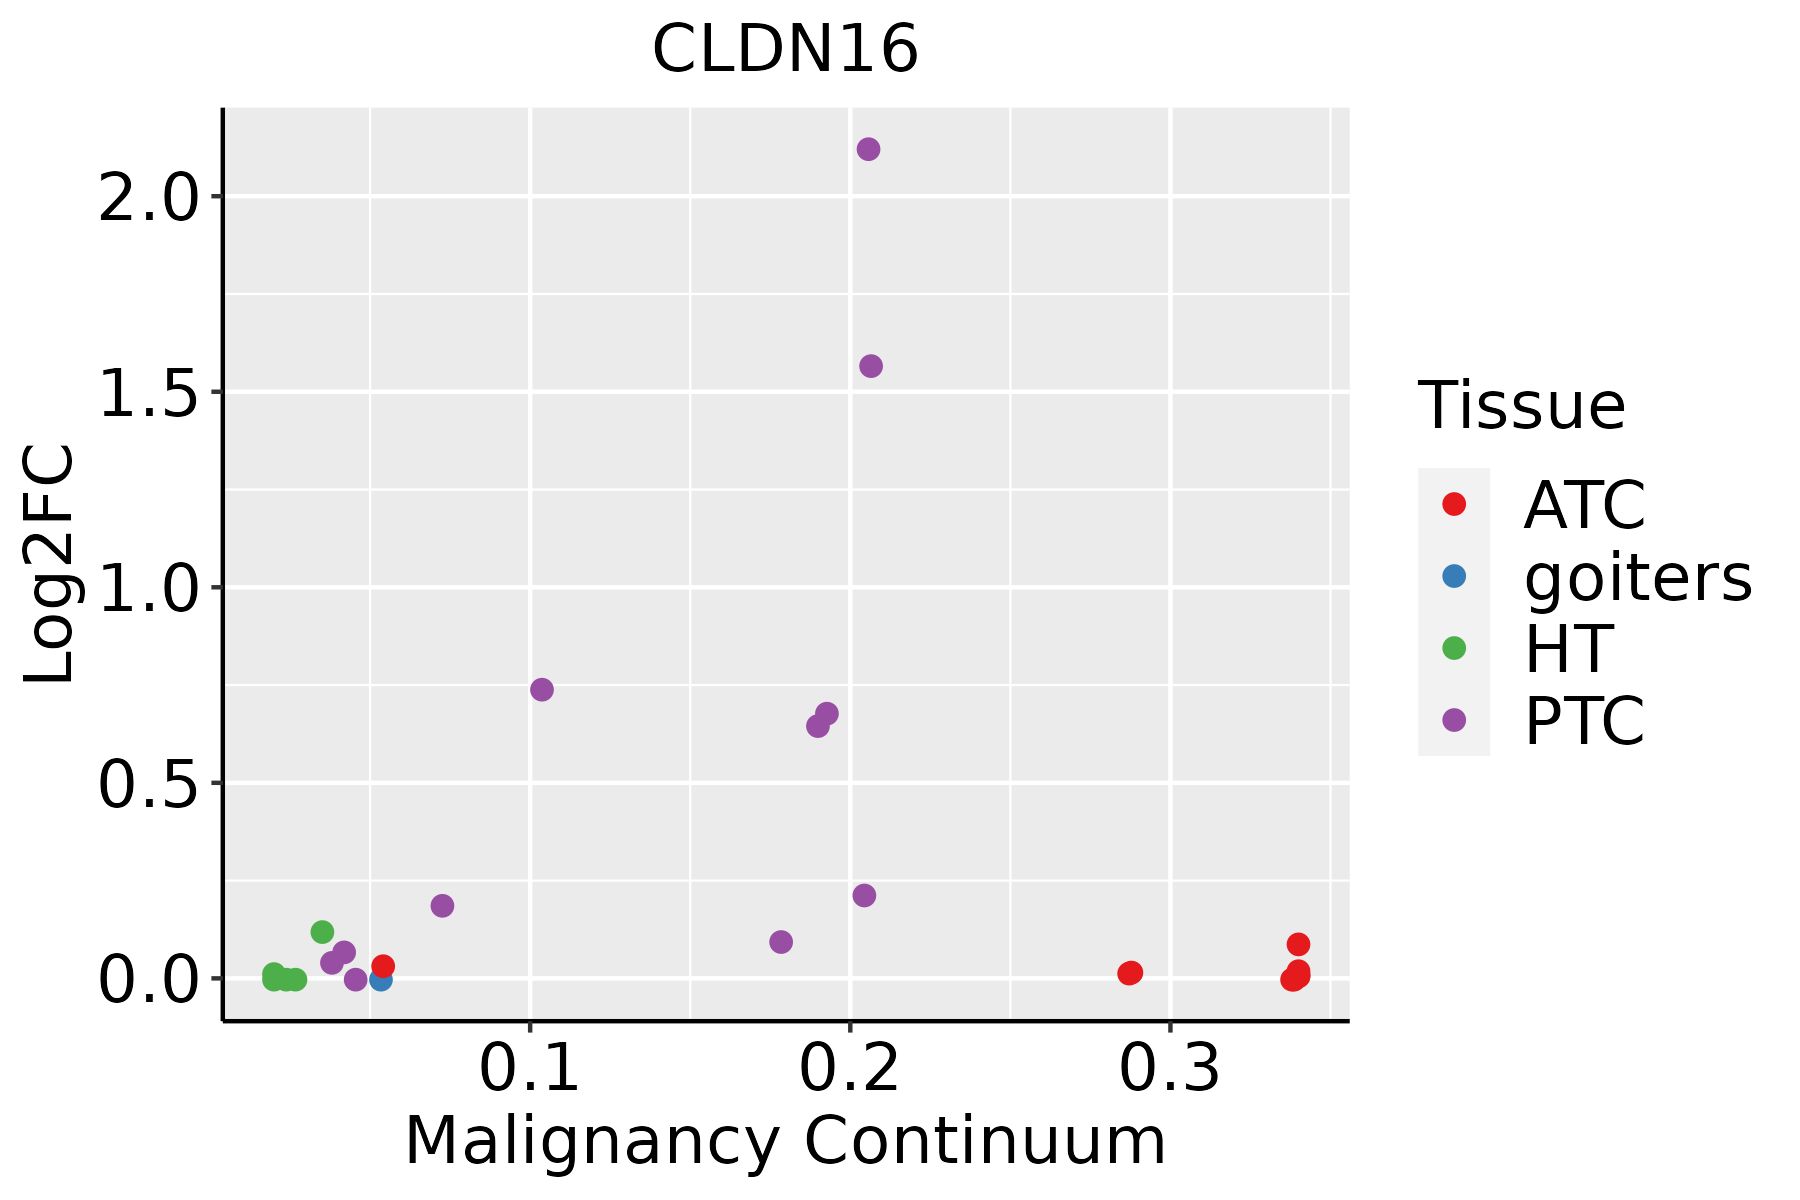 | ATC: Anaplastic thyroid cancer |
| HT: Hashimoto's thyroiditis | ||
| PTC: Papillary thyroid cancer |
| ∗log2FC in expression of this searched gene in stem-like cells from each diseased tissue sample relative to stem-like cells in normal samples in each tissue plotted against the malignancy continuum. Samples are colored based on if they are from different disease stage. |
Top |
Malignant transformation related pathway analysis |
| Find out the enriched GO biological processes and KEGG pathways involved in transition from healthy to precancer to cancer |
| Tissue | Disease Stage | Enriched GO biological Processes |
| Colorectum | AD |  |
| Colorectum | SER |  |
| Colorectum | MSS |  |
| Colorectum | MSI-H |  |
| Colorectum | FAP |  |
| ∗Top 15 enriched GO BP terms are showed in the bar plot of each disease state in each tissue. Each row represents a significant GO biological process which is colored according to the -log10(p.adjust). |
| Page: 1 2 3 4 5 6 7 8 9 |
| GO ID | Tissue | Disease Stage | Description | Gene Ratio | Bg Ratio | pvalue | p.adjust | Count |
| GO:004521622 | Liver | HCC | cell-cell junction organization | 107/7958 | 200/18723 | 1.06e-03 | 6.11e-03 | 107 |
| GO:004329712 | Liver | HCC | apical junction assembly | 45/7958 | 78/18723 | 4.83e-03 | 2.03e-02 | 45 |
| GO:01201935 | Liver | HCC | tight junction organization | 45/7958 | 80/18723 | 9.02e-03 | 3.48e-02 | 45 |
| GO:01201925 | Liver | HCC | tight junction assembly | 42/7958 | 74/18723 | 9.32e-03 | 3.57e-02 | 42 |
| GO:000704312 | Liver | HCC | cell-cell junction assembly | 76/7958 | 146/18723 | 1.23e-02 | 4.47e-02 | 76 |
| GO:0034329111 | Thyroid | PTC | cell junction assembly | 180/5968 | 420/18723 | 1.17e-06 | 1.69e-05 | 180 |
| GO:0045216111 | Thyroid | PTC | cell-cell junction organization | 93/5968 | 200/18723 | 1.01e-05 | 1.12e-04 | 93 |
| GO:0043297110 | Thyroid | PTC | apical junction assembly | 38/5968 | 78/18723 | 1.40e-03 | 7.87e-03 | 38 |
| GO:0007043111 | Thyroid | PTC | cell-cell junction assembly | 64/5968 | 146/18723 | 1.56e-03 | 8.63e-03 | 64 |
| GO:012019317 | Thyroid | PTC | tight junction organization | 38/5968 | 80/18723 | 2.49e-03 | 1.29e-02 | 38 |
| GO:012019216 | Thyroid | PTC | tight junction assembly | 35/5968 | 74/18723 | 3.95e-03 | 1.89e-02 | 35 |
| Page: 1 |
| Pathway ID | Tissue | Disease Stage | Description | Gene Ratio | Bg Ratio | pvalue | p.adjust | qvalue | Count |
| hsa0513042 | Liver | HCC | Pathogenic Escherichia coli infection | 129/4020 | 197/8465 | 2.02e-07 | 2.50e-06 | 1.39e-06 | 129 |
| hsa0453042 | Liver | HCC | Tight junction | 110/4020 | 169/8465 | 2.45e-06 | 2.28e-05 | 1.27e-05 | 110 |
| hsa0516021 | Liver | HCC | Hepatitis C | 94/4020 | 157/8465 | 1.11e-03 | 4.10e-03 | 2.28e-03 | 94 |
| hsa0467042 | Liver | HCC | Leukocyte transendothelial migration | 68/4020 | 114/8465 | 5.79e-03 | 1.64e-02 | 9.15e-03 | 68 |
| hsa0513052 | Liver | HCC | Pathogenic Escherichia coli infection | 129/4020 | 197/8465 | 2.02e-07 | 2.50e-06 | 1.39e-06 | 129 |
| hsa0453052 | Liver | HCC | Tight junction | 110/4020 | 169/8465 | 2.45e-06 | 2.28e-05 | 1.27e-05 | 110 |
| hsa0516031 | Liver | HCC | Hepatitis C | 94/4020 | 157/8465 | 1.11e-03 | 4.10e-03 | 2.28e-03 | 94 |
| hsa0467052 | Liver | HCC | Leukocyte transendothelial migration | 68/4020 | 114/8465 | 5.79e-03 | 1.64e-02 | 9.15e-03 | 68 |
| Page: 1 |
Top |
Cell-cell communication analysis |
| Identification of potential cell-cell interactions between two cell types and their ligand-receptor pairs for different disease states |
| Ligand | Receptor | LRpair | Pathway | Tissue | Disease Stage |
| Page: 1 |
Top |
Single-cell gene regulatory network inference analysis |
| Find out the significant the regulons (TFs) and the target genes of each regulon across cell types for different disease states |
| TF | Cell Type | Tissue | Disease Stage | Target Gene | RSS | Regulon Activity |
| ∗The dot plots of a searched regulon are shown for all cell subpopulations in each disease state of each tissue based on the regulon specific score inferred using pySCENIC and by calculating the average expression. |
| Page: 1 |
Top |
Somatic mutation of malignant transformation related genes |
| Annotation of somatic variants for genes involved in malignant transformation |
| Hugo Symbol | Variant Class | Variant Classification | dbSNP RS | HGVSc | HGVSp | HGVSp Short | SWISSPROT | BIOTYPE | SIFT | PolyPhen | Tumor Sample Barcode | Tissue | Histology | Sex | Age | Stage | Therapy Types | Drugs | Outcome |
| CLDN16 | SNV | Missense_Mutation | rs762831659 | c.386N>A | p.Arg129His | p.R129H | Q9Y5I7 | protein_coding | tolerated(0.21) | probably_damaging(0.947) | TCGA-AN-A0AK-01 | Breast | breast invasive carcinoma | Female | >=65 | I/II | Unknown | Unknown | SD |
| CLDN16 | SNV | Missense_Mutation | c.280N>T | p.Thr94Ser | p.T94S | Q9Y5I7 | protein_coding | deleterious(0.01) | probably_damaging(0.998) | TCGA-D8-A1XQ-01 | Breast | breast invasive carcinoma | Female | >=65 | I/II | Unknown | Unknown | SD | |
| CLDN16 | SNV | Missense_Mutation | novel | c.39N>T | p.Leu13Phe | p.L13F | Q9Y5I7 | protein_coding | tolerated_low_confidence(0.79) | benign(0) | TCGA-E9-A22E-01 | Breast | breast invasive carcinoma | Female | <65 | III/IV | Chemotherapy | cyclophosphane | SD |
| CLDN16 | SNV | Missense_Mutation | novel | c.243N>G | p.Phe81Leu | p.F81L | Q9Y5I7 | protein_coding | tolerated(0.15) | benign(0.011) | TCGA-XX-A89A-01 | Breast | breast invasive carcinoma | Female | >=65 | I/II | Unknown | Unknown | SD |
| CLDN16 | insertion | Frame_Shift_Ins | novel | c.290_291insTATAGAAGTCTAC | p.Cys98IlefsTer11 | p.C98Ifs*11 | Q9Y5I7 | protein_coding | TCGA-A2-A0ER-01 | Breast | breast invasive carcinoma | Female | <65 | I/II | Chemotherapy | cytoxan | SD | ||
| CLDN16 | deletion | Frame_Shift_Del | novel | c.293_296delNNNN | p.Cys98Ter | p.C98* | Q9Y5I7 | protein_coding | TCGA-A2-A0ER-01 | Breast | breast invasive carcinoma | Female | <65 | I/II | Chemotherapy | cytoxan | SD | ||
| CLDN16 | deletion | Frame_Shift_Del | novel | c.265delN | p.Leu90Ter | p.L90* | Q9Y5I7 | protein_coding | TCGA-D8-A27V-01 | Breast | breast invasive carcinoma | Female | <65 | I/II | Hormone Therapy | tamoxiphen | SD | ||
| CLDN16 | SNV | Missense_Mutation | c.47C>G | p.Ser16Cys | p.S16C | Q9Y5I7 | protein_coding | deleterious_low_confidence(0.01) | benign(0.005) | TCGA-EK-A2PL-01 | Cervix | cervical & endocervical cancer | Female | <65 | III/IV | Unknown | Unknown | SD | |
| CLDN16 | SNV | Missense_Mutation | rs759868163 | c.270N>T | p.Leu90Phe | p.L90F | Q9Y5I7 | protein_coding | deleterious(0) | probably_damaging(0.998) | TCGA-EK-A2RB-01 | Cervix | cervical & endocervical cancer | Female | <65 | I/II | Unknown | Unknown | SD |
| CLDN16 | SNV | Missense_Mutation | rs374751726 | c.884N>T | p.Thr295Met | p.T295M | Q9Y5I7 | protein_coding | deleterious(0) | probably_damaging(0.998) | TCGA-AA-3710-01 | Colorectum | colon adenocarcinoma | Female | >=65 | I/II | Unknown | Unknown | SD |
| Page: 1 2 3 4 5 6 |
Top |
Related drugs of malignant transformation related genes |
| Identification of chemicals and drugs interact with genes involved in malignant transfromation |
| (DGIdb 4.0) |
| Entrez ID | Symbol | Category | Interaction Types | Drug Claim Name | Drug Name | PMIDs |
| Page: 1 |

Copyright 2023-Present -The University of Texas Health Science Center at Houston |