
|
|||||
|
 | |
| |
| |
| |
| |
| |
|
Gene: CLDN15 |
Gene summary for CLDN15 |
| Gene information | Species | Human | Gene symbol | CLDN15 | Gene ID | 24146 |
| Gene name | claudin 15 | |
| Gene Alias | CLDN15 | |
| Cytomap | 7q22.1 | |
| Gene Type | protein-coding | GO ID | GO:0006810 | UniProtAcc | P56746 |
Top |
Malignant transformation analysis |
| Identification of the aberrant gene expression in precancerous and cancerous lesions by comparing the gene expression of stem-like cells in diseased tissues with normal stem cells |
| Entrez ID | Symbol | Replicates | Species | Organ | Tissue | Adj P-value | Log2FC | Malignancy |
| 24146 | CLDN15 | HTA11_1938_2000001011 | Human | Colorectum | AD | 6.73e-08 | 6.58e-01 | -0.0811 |
| 24146 | CLDN15 | HTA11_347_2000001011 | Human | Colorectum | AD | 9.86e-07 | 3.99e-01 | -0.1954 |
| 24146 | CLDN15 | HTA11_83_2000001011 | Human | Colorectum | SER | 2.56e-08 | 6.11e-01 | -0.1526 |
| 24146 | CLDN15 | HTA11_1391_2000001011 | Human | Colorectum | AD | 2.83e-04 | 3.07e-01 | -0.059 |
| 24146 | CLDN15 | HTA11_546_2000001011 | Human | Colorectum | AD | 2.39e-03 | 5.70e-01 | -0.0842 |
| 24146 | CLDN15 | HTA11_8622_2000001021 | Human | Colorectum | SER | 5.44e-07 | 8.12e-01 | 0.0528 |
| 24146 | CLDN15 | HTA11_7469_2000001011 | Human | Colorectum | AD | 5.29e-04 | 5.24e-01 | -0.0124 |
| 24146 | CLDN15 | HTA11_99999965104_69814 | Human | Colorectum | MSS | 8.02e-08 | 6.44e-01 | 0.281 |
| 24146 | CLDN15 | HTA11_99999971662_82457 | Human | Colorectum | MSS | 2.30e-40 | 1.02e+00 | 0.3859 |
| 24146 | CLDN15 | HTA11_99999974143_84620 | Human | Colorectum | MSS | 2.00e-08 | 4.26e-01 | 0.3005 |
| 24146 | CLDN15 | A002-C-116 | Human | Colorectum | FAP | 1.71e-02 | -1.02e-01 | -0.0452 |
| 24146 | CLDN15 | A018-E-020 | Human | Colorectum | FAP | 1.04e-02 | -1.13e-01 | -0.2034 |
| 24146 | CLDN15 | HCC1_Meng | Human | Liver | HCC | 1.15e-39 | 8.79e-02 | 0.0246 |
| 24146 | CLDN15 | HCC2_Meng | Human | Liver | HCC | 1.26e-04 | 2.19e-02 | 0.0107 |
| 24146 | CLDN15 | HCC2 | Human | Liver | HCC | 1.59e-04 | 1.82e+00 | 0.5341 |
| 24146 | CLDN15 | S014 | Human | Liver | HCC | 3.41e-27 | 1.06e+00 | 0.2254 |
| 24146 | CLDN15 | S015 | Human | Liver | HCC | 7.96e-20 | 1.03e+00 | 0.2375 |
| 24146 | CLDN15 | S016 | Human | Liver | HCC | 3.10e-26 | 1.20e+00 | 0.2243 |
| 24146 | CLDN15 | C21 | Human | Oral cavity | OSCC | 2.87e-02 | 1.12e-01 | 0.2678 |
| 24146 | CLDN15 | C38 | Human | Oral cavity | OSCC | 5.28e-04 | 7.10e-01 | 0.172 |
| Page: 1 2 |
| Tissue | Expression Dynamics | Abbreviation |
| Colorectum (GSE201348) |  | FAP: Familial adenomatous polyposis |
| CRC: Colorectal cancer | ||
| Colorectum (HTA11) | 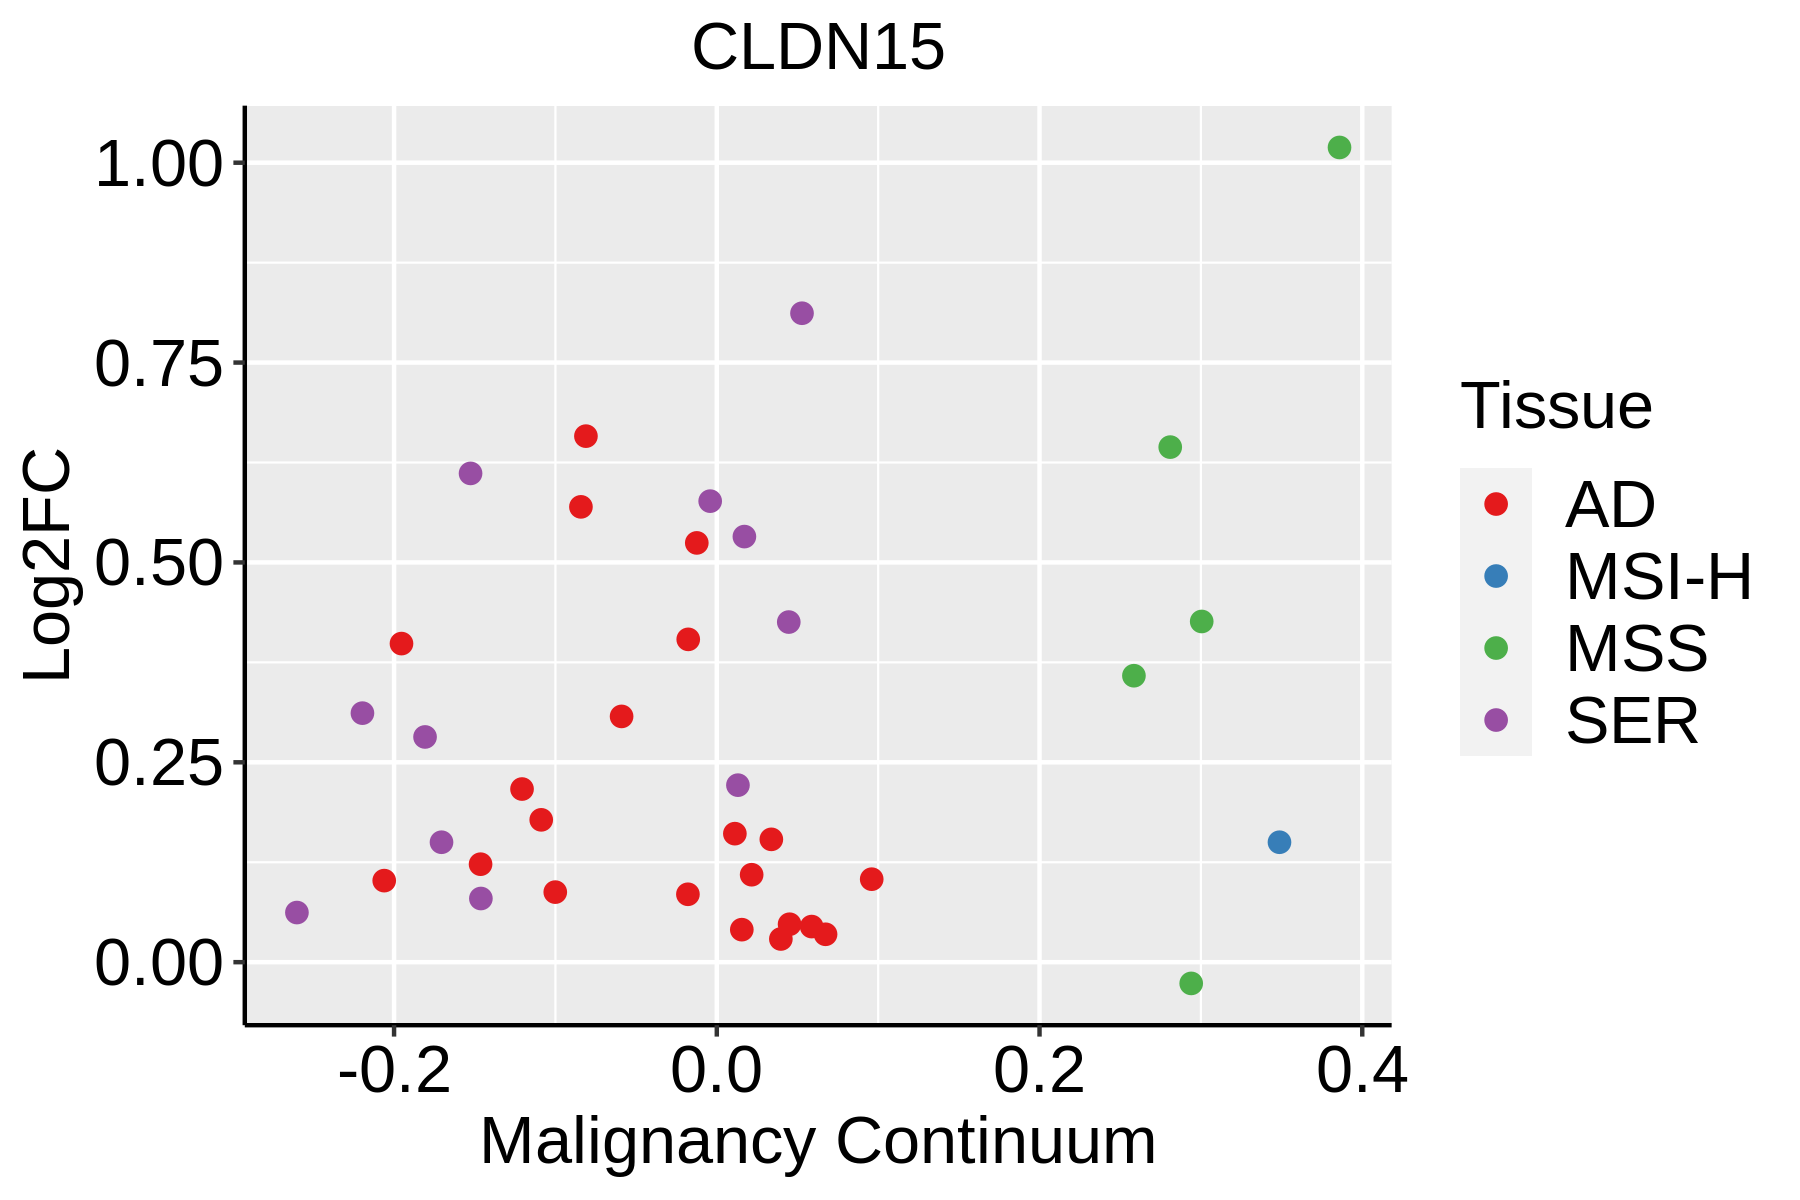 | AD: Adenomas |
| SER: Sessile serrated lesions | ||
| MSI-H: Microsatellite-high colorectal cancer | ||
| MSS: Microsatellite stable colorectal cancer | ||
| GC | 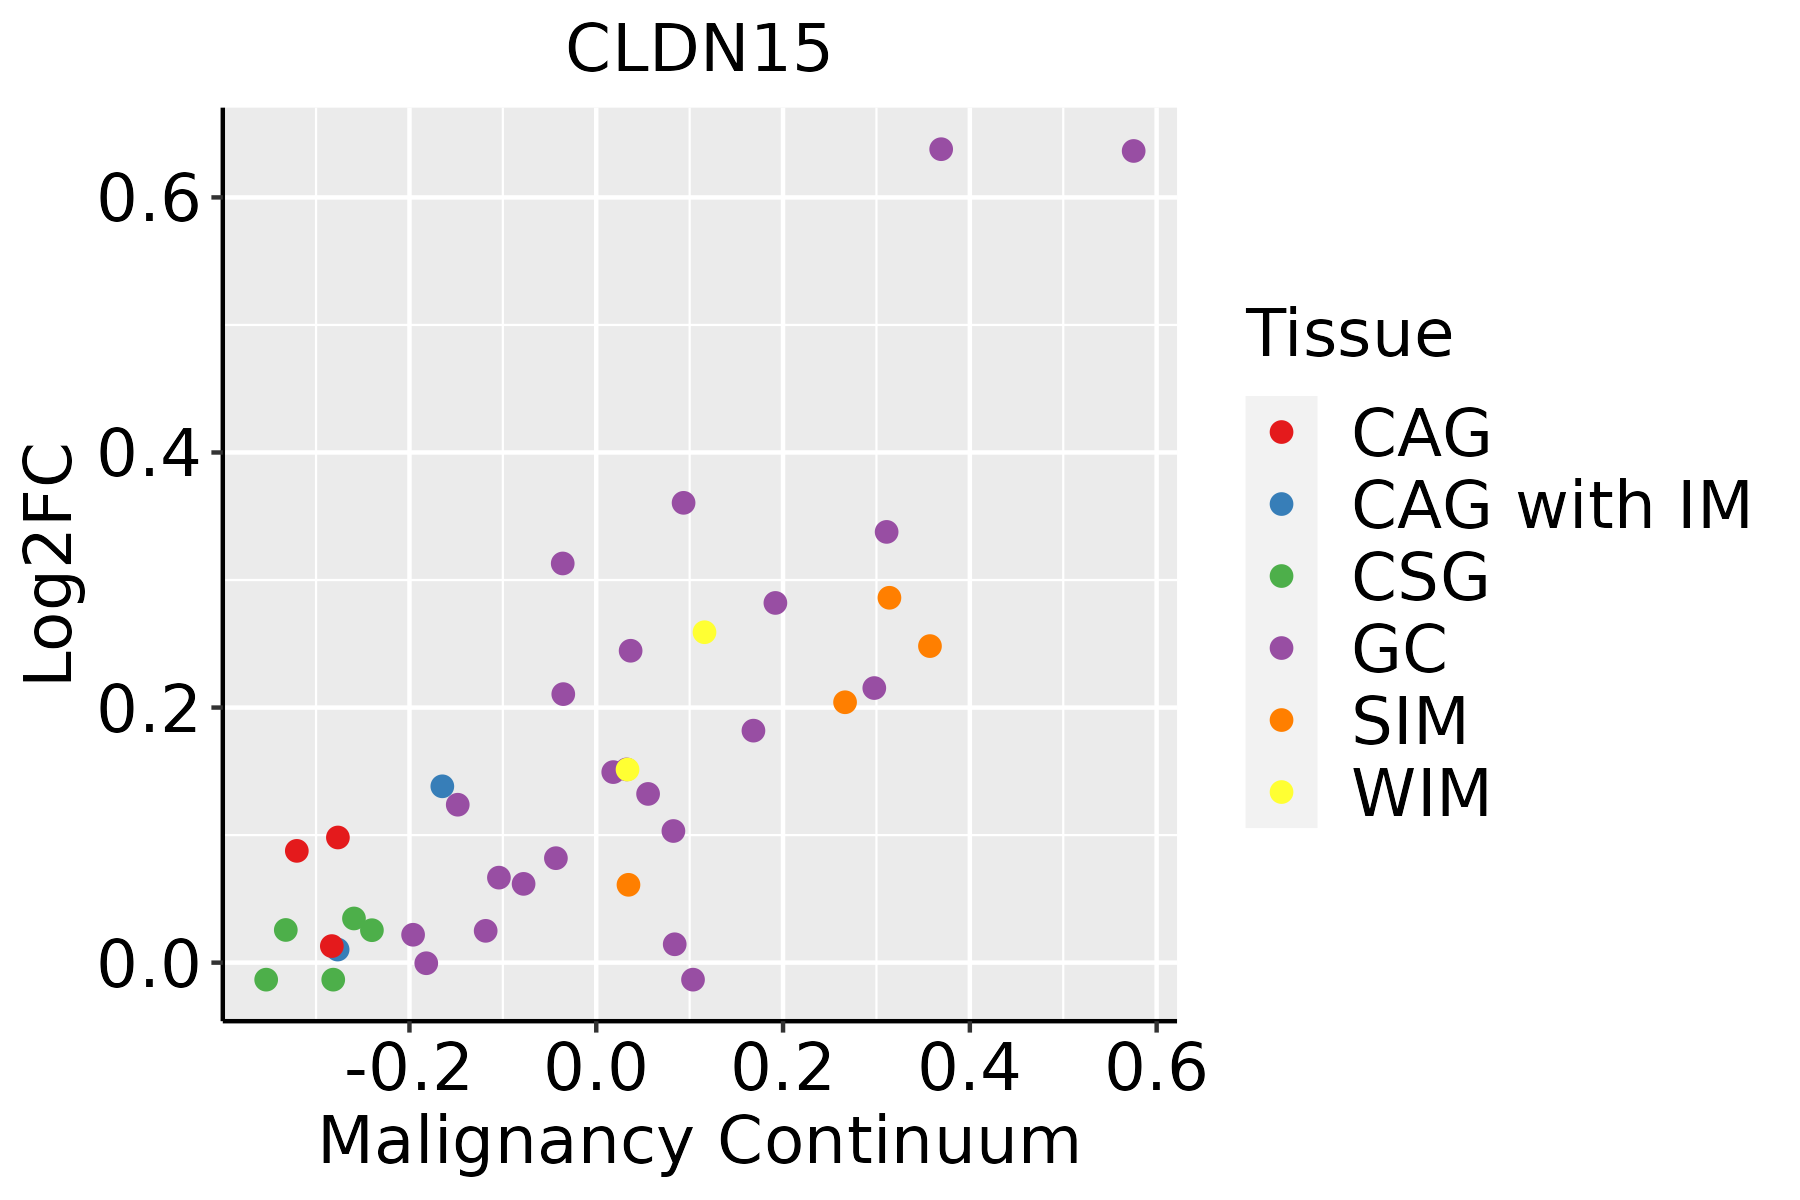 | CAG: Chronic atrophic gastritis |
| CAG with IM: Chronic atrophic gastritis with intestinal metaplasia | ||
| CSG: Chronic superficial gastritis | ||
| GC: Gastric cancer | ||
| SIM: Severe intestinal metaplasia | ||
| WIM: Wild intestinal metaplasia | ||
| Liver |  | HCC: Hepatocellular carcinoma |
| NAFLD: Non-alcoholic fatty liver disease | ||
| Oral Cavity | 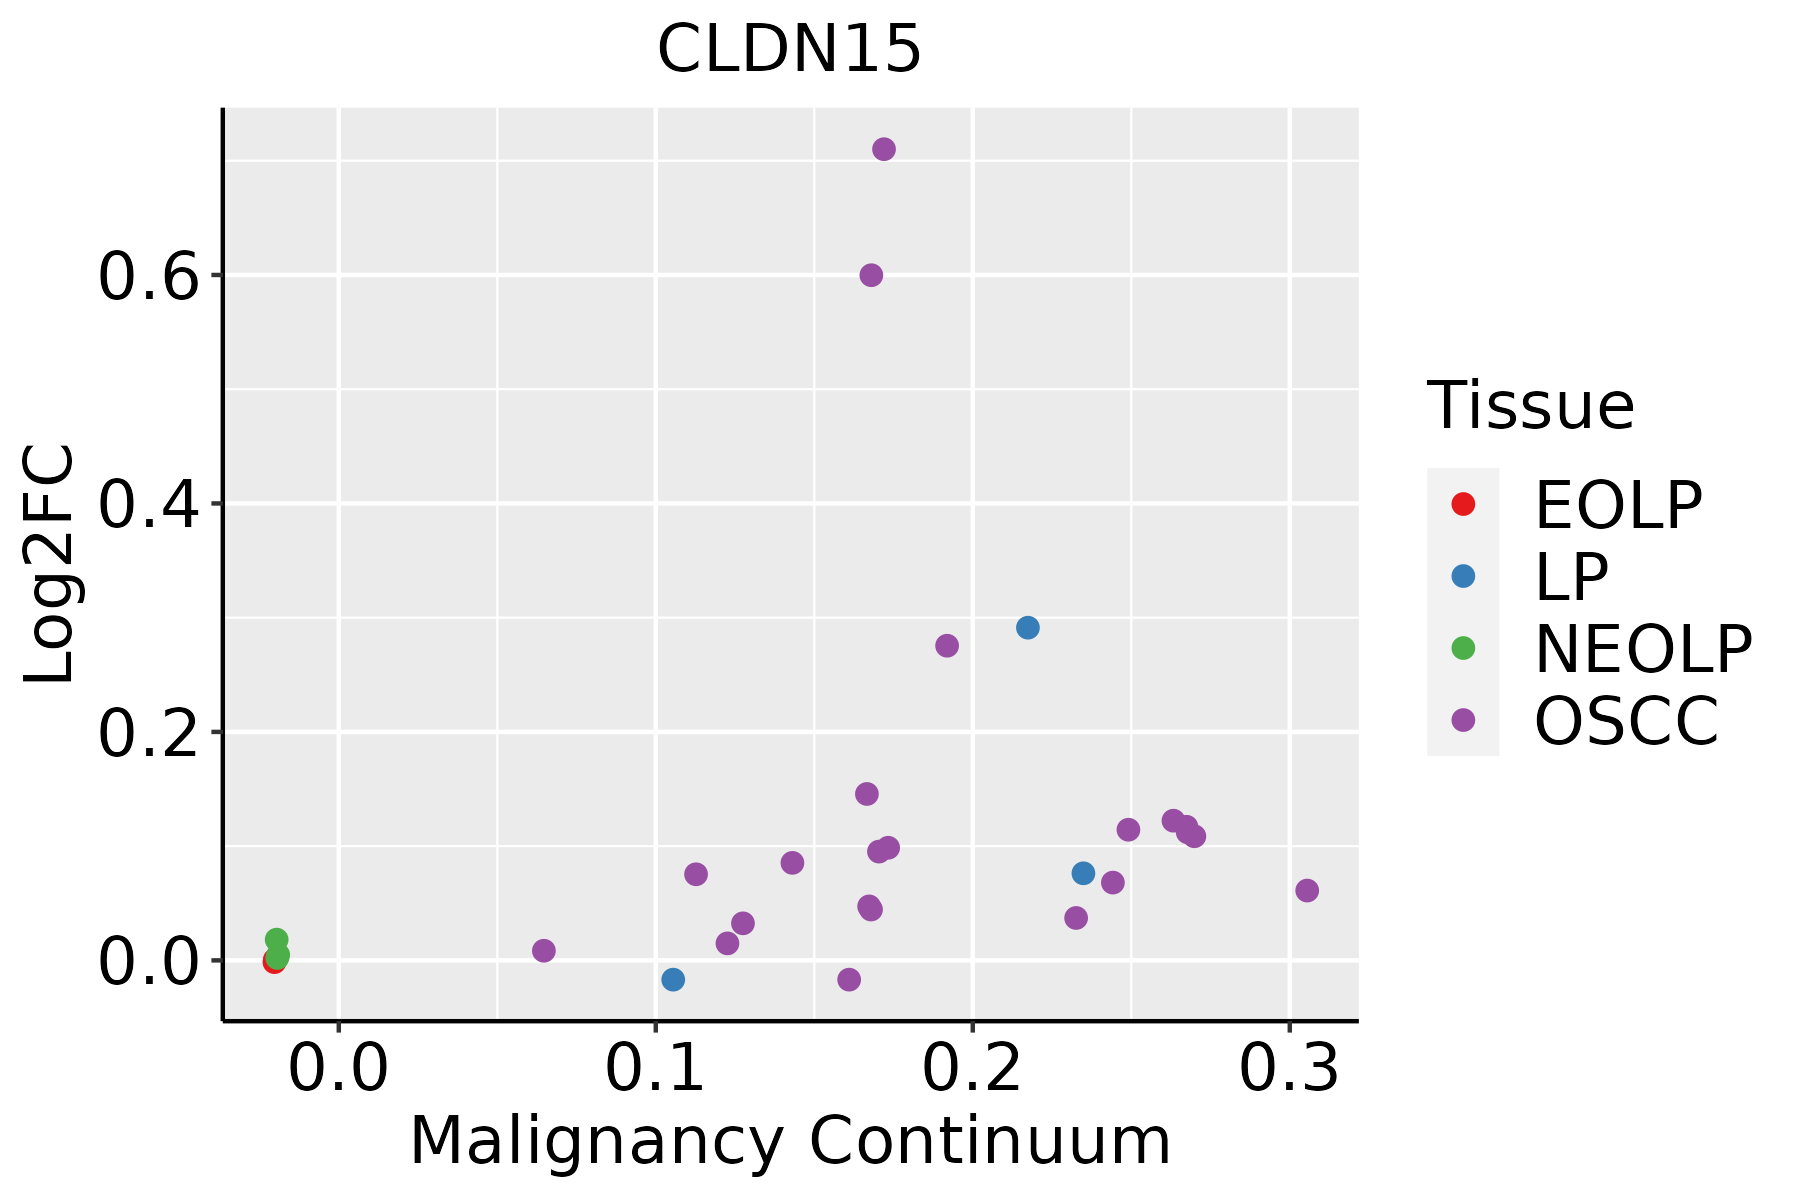 | EOLP: Erosive Oral lichen planus |
| LP: leukoplakia | ||
| NEOLP: Non-erosive oral lichen planus | ||
| OSCC: Oral squamous cell carcinoma |
| ∗log2FC in expression of this searched gene in stem-like cells from each diseased tissue sample relative to stem-like cells in normal samples in each tissue plotted against the malignancy continuum. Samples are colored based on if they are from different disease stage. |
Top |
Malignant transformation related pathway analysis |
| Find out the enriched GO biological processes and KEGG pathways involved in transition from healthy to precancer to cancer |
| Tissue | Disease Stage | Enriched GO biological Processes |
| Colorectum | AD |  |
| Colorectum | SER |  |
| Colorectum | MSS |  |
| Colorectum | MSI-H |  |
| Colorectum | FAP |  |
| ∗Top 15 enriched GO BP terms are showed in the bar plot of each disease state in each tissue. Each row represents a significant GO biological process which is colored according to the -log10(p.adjust). |
| Page: 1 2 3 4 5 6 7 8 9 |
| GO ID | Tissue | Disease Stage | Description | Gene Ratio | Bg Ratio | pvalue | p.adjust | Count |
| GO:0045216 | Colorectum | AD | cell-cell junction organization | 80/3918 | 200/18723 | 5.57e-10 | 4.58e-08 | 80 |
| GO:0034329 | Colorectum | AD | cell junction assembly | 136/3918 | 420/18723 | 2.02e-08 | 1.15e-06 | 136 |
| GO:0007043 | Colorectum | AD | cell-cell junction assembly | 57/3918 | 146/18723 | 4.18e-07 | 1.61e-05 | 57 |
| GO:0043297 | Colorectum | AD | apical junction assembly | 34/3918 | 78/18723 | 5.31e-06 | 1.37e-04 | 34 |
| GO:0120193 | Colorectum | AD | tight junction organization | 33/3918 | 80/18723 | 2.93e-05 | 5.42e-04 | 33 |
| GO:0120192 | Colorectum | AD | tight junction assembly | 31/3918 | 74/18723 | 3.53e-05 | 6.43e-04 | 31 |
| GO:0070830 | Colorectum | AD | bicellular tight junction assembly | 28/3918 | 70/18723 | 2.15e-04 | 2.83e-03 | 28 |
| GO:00452161 | Colorectum | SER | cell-cell junction organization | 63/2897 | 200/18723 | 9.15e-09 | 7.80e-07 | 63 |
| GO:00070431 | Colorectum | SER | cell-cell junction assembly | 45/2897 | 146/18723 | 2.23e-06 | 9.31e-05 | 45 |
| GO:00343291 | Colorectum | SER | cell junction assembly | 100/2897 | 420/18723 | 4.23e-06 | 1.61e-04 | 100 |
| GO:00432971 | Colorectum | SER | apical junction assembly | 27/2897 | 78/18723 | 2.36e-05 | 6.64e-04 | 27 |
| GO:01201931 | Colorectum | SER | tight junction organization | 27/2897 | 80/18723 | 3.95e-05 | 1.00e-03 | 27 |
| GO:01201921 | Colorectum | SER | tight junction assembly | 25/2897 | 74/18723 | 7.39e-05 | 1.66e-03 | 25 |
| GO:00708301 | Colorectum | SER | bicellular tight junction assembly | 22/2897 | 70/18723 | 6.16e-04 | 8.40e-03 | 22 |
| GO:00452162 | Colorectum | MSS | cell-cell junction organization | 69/3467 | 200/18723 | 5.07e-08 | 2.70e-06 | 69 |
| GO:00343292 | Colorectum | MSS | cell junction assembly | 120/3467 | 420/18723 | 2.51e-07 | 1.07e-05 | 120 |
| GO:00070432 | Colorectum | MSS | cell-cell junction assembly | 50/3467 | 146/18723 | 4.24e-06 | 1.21e-04 | 50 |
| GO:00432972 | Colorectum | MSS | apical junction assembly | 28/3467 | 78/18723 | 2.12e-04 | 2.95e-03 | 28 |
| GO:01201932 | Colorectum | MSS | tight junction organization | 27/3467 | 80/18723 | 8.31e-04 | 8.68e-03 | 27 |
| GO:01201922 | Colorectum | MSS | tight junction assembly | 25/3467 | 74/18723 | 1.25e-03 | 1.20e-02 | 25 |
| Page: 1 2 3 |
| Pathway ID | Tissue | Disease Stage | Description | Gene Ratio | Bg Ratio | pvalue | p.adjust | qvalue | Count |
| hsa04530 | Colorectum | AD | Tight junction | 76/2092 | 169/8465 | 5.49e-09 | 9.69e-08 | 6.18e-08 | 76 |
| hsa05130 | Colorectum | AD | Pathogenic Escherichia coli infection | 79/2092 | 197/8465 | 1.05e-06 | 1.36e-05 | 8.65e-06 | 79 |
| hsa05160 | Colorectum | AD | Hepatitis C | 54/2092 | 157/8465 | 3.87e-03 | 1.96e-02 | 1.25e-02 | 54 |
| hsa04670 | Colorectum | AD | Leukocyte transendothelial migration | 41/2092 | 114/8465 | 4.60e-03 | 2.20e-02 | 1.40e-02 | 41 |
| hsa045301 | Colorectum | AD | Tight junction | 76/2092 | 169/8465 | 5.49e-09 | 9.69e-08 | 6.18e-08 | 76 |
| hsa051301 | Colorectum | AD | Pathogenic Escherichia coli infection | 79/2092 | 197/8465 | 1.05e-06 | 1.36e-05 | 8.65e-06 | 79 |
| hsa051601 | Colorectum | AD | Hepatitis C | 54/2092 | 157/8465 | 3.87e-03 | 1.96e-02 | 1.25e-02 | 54 |
| hsa046701 | Colorectum | AD | Leukocyte transendothelial migration | 41/2092 | 114/8465 | 4.60e-03 | 2.20e-02 | 1.40e-02 | 41 |
| hsa045302 | Colorectum | SER | Tight junction | 59/1580 | 169/8465 | 3.24e-07 | 5.98e-06 | 4.34e-06 | 59 |
| hsa051302 | Colorectum | SER | Pathogenic Escherichia coli infection | 60/1580 | 197/8465 | 3.63e-05 | 4.31e-04 | 3.13e-04 | 60 |
| hsa046702 | Colorectum | SER | Leukocyte transendothelial migration | 37/1580 | 114/8465 | 2.77e-04 | 2.56e-03 | 1.86e-03 | 37 |
| hsa045303 | Colorectum | SER | Tight junction | 59/1580 | 169/8465 | 3.24e-07 | 5.98e-06 | 4.34e-06 | 59 |
| hsa051303 | Colorectum | SER | Pathogenic Escherichia coli infection | 60/1580 | 197/8465 | 3.63e-05 | 4.31e-04 | 3.13e-04 | 60 |
| hsa046703 | Colorectum | SER | Leukocyte transendothelial migration | 37/1580 | 114/8465 | 2.77e-04 | 2.56e-03 | 1.86e-03 | 37 |
| hsa045304 | Colorectum | MSS | Tight junction | 66/1875 | 169/8465 | 4.10e-07 | 6.25e-06 | 3.83e-06 | 66 |
| hsa051304 | Colorectum | MSS | Pathogenic Escherichia coli infection | 73/1875 | 197/8465 | 1.10e-06 | 1.48e-05 | 9.06e-06 | 73 |
| hsa051602 | Colorectum | MSS | Hepatitis C | 52/1875 | 157/8465 | 9.29e-04 | 5.58e-03 | 3.42e-03 | 52 |
| hsa046704 | Colorectum | MSS | Leukocyte transendothelial migration | 36/1875 | 114/8465 | 1.21e-02 | 4.02e-02 | 2.46e-02 | 36 |
| hsa045305 | Colorectum | MSS | Tight junction | 66/1875 | 169/8465 | 4.10e-07 | 6.25e-06 | 3.83e-06 | 66 |
| hsa051305 | Colorectum | MSS | Pathogenic Escherichia coli infection | 73/1875 | 197/8465 | 1.10e-06 | 1.48e-05 | 9.06e-06 | 73 |
| Page: 1 2 3 4 |
Top |
Cell-cell communication analysis |
| Identification of potential cell-cell interactions between two cell types and their ligand-receptor pairs for different disease states |
| Ligand | Receptor | LRpair | Pathway | Tissue | Disease Stage |
| Page: 1 |
Top |
Single-cell gene regulatory network inference analysis |
| Find out the significant the regulons (TFs) and the target genes of each regulon across cell types for different disease states |
| TF | Cell Type | Tissue | Disease Stage | Target Gene | RSS | Regulon Activity |
| ∗The dot plots of a searched regulon are shown for all cell subpopulations in each disease state of each tissue based on the regulon specific score inferred using pySCENIC and by calculating the average expression. |
| Page: 1 |
Top |
Somatic mutation of malignant transformation related genes |
| Annotation of somatic variants for genes involved in malignant transformation |
| Hugo Symbol | Variant Class | Variant Classification | dbSNP RS | HGVSc | HGVSp | HGVSp Short | SWISSPROT | BIOTYPE | SIFT | PolyPhen | Tumor Sample Barcode | Tissue | Histology | Sex | Age | Stage | Therapy Types | Drugs | Outcome |
| CLDN15 | SNV | Missense_Mutation | c.442N>C | p.Asp148His | p.D148H | P56746 | protein_coding | deleterious(0) | benign(0.32) | TCGA-BH-A0BW-01 | Breast | breast invasive carcinoma | Female | >=65 | I/II | Chemotherapy | adriamycin | CR | |
| CLDN15 | SNV | Missense_Mutation | c.11C>T | p.Ala4Val | p.A4V | P56746 | protein_coding | tolerated(0.31) | benign(0.381) | TCGA-AA-3710-01 | Colorectum | colon adenocarcinoma | Female | >=65 | I/II | Unknown | Unknown | SD | |
| CLDN15 | SNV | Missense_Mutation | rs374570698 | c.358N>A | p.Ala120Thr | p.A120T | P56746 | protein_coding | deleterious(0) | possibly_damaging(0.87) | TCGA-CK-4951-01 | Colorectum | colon adenocarcinoma | Female | >=65 | I/II | Unknown | Unknown | PD |
| CLDN15 | SNV | Missense_Mutation | c.328C>T | p.Leu110Phe | p.L110F | P56746 | protein_coding | tolerated(0.68) | benign(0.222) | TCGA-NH-A5IV-01 | Colorectum | colon adenocarcinoma | Female | >=65 | I/II | Unknown | Unknown | SD | |
| CLDN15 | SNV | Missense_Mutation | novel | c.256A>G | p.Ile86Val | p.I86V | P56746 | protein_coding | tolerated(0.61) | benign(0.254) | TCGA-A5-A0G2-01 | Endometrium | uterine corpus endometrioid carcinoma | Female | <65 | III/IV | Unknown | Unknown | SD |
| CLDN15 | SNV | Missense_Mutation | rs763488001 | c.236N>A | p.Arg79Gln | p.R79Q | P56746 | protein_coding | deleterious(0.03) | probably_damaging(1) | TCGA-AJ-A3EK-01 | Endometrium | uterine corpus endometrioid carcinoma | Female | <65 | I/II | Chemotherapy | carboplatin | CR |
| CLDN15 | SNV | Missense_Mutation | rs755717983 | c.364N>A | p.Ala122Thr | p.A122T | P56746 | protein_coding | tolerated(0.1) | benign(0.034) | TCGA-AP-A1DV-01 | Endometrium | uterine corpus endometrioid carcinoma | Female | <65 | I/II | Unknown | Unknown | SD |
| CLDN15 | SNV | Missense_Mutation | c.438C>A | p.Phe146Leu | p.F146L | P56746 | protein_coding | deleterious(0) | probably_damaging(0.989) | TCGA-AX-A05Z-01 | Endometrium | uterine corpus endometrioid carcinoma | Female | <65 | III/IV | Chemotherapy | adriamycin | SD | |
| CLDN15 | SNV | Missense_Mutation | c.11N>T | p.Ala4Val | p.A4V | P56746 | protein_coding | tolerated(0.31) | benign(0.381) | TCGA-BG-A220-01 | Endometrium | uterine corpus endometrioid carcinoma | Female | >=65 | I/II | Unknown | Unknown | SD | |
| CLDN15 | SNV | Missense_Mutation | c.349G>T | p.Ala117Ser | p.A117S | P56746 | protein_coding | deleterious(0.05) | benign(0.425) | TCGA-D1-A160-01 | Endometrium | uterine corpus endometrioid carcinoma | Female | >=65 | I/II | Unknown | Unknown | SD |
| Page: 1 2 3 |
Top |
Related drugs of malignant transformation related genes |
| Identification of chemicals and drugs interact with genes involved in malignant transfromation |
| (DGIdb 4.0) |
| Entrez ID | Symbol | Category | Interaction Types | Drug Claim Name | Drug Name | PMIDs |
| Page: 1 |

Copyright 2023-Present -The University of Texas Health Science Center at Houston |