
|
|||||
|
 | |
| |
| |
| |
| |
| |
|
Gene: CLDN10 |
Gene summary for CLDN10 |
| Gene information | Species | Human | Gene symbol | CLDN10 | Gene ID | 9071 |
| Gene name | claudin 10 | |
| Gene Alias | CPETRL3 | |
| Cytomap | 13q32.1 | |
| Gene Type | protein-coding | GO ID | GO:0006810 | UniProtAcc | P78369 |
Top |
Malignant transformation analysis |
| Identification of the aberrant gene expression in precancerous and cancerous lesions by comparing the gene expression of stem-like cells in diseased tissues with normal stem cells |
| Entrez ID | Symbol | Replicates | Species | Organ | Tissue | Adj P-value | Log2FC | Malignancy |
| 9071 | CLDN10 | CA_HPV_1 | Human | Cervix | CC | 9.00e-07 | -2.08e-01 | 0.0264 |
| 9071 | CLDN10 | CA_HPV_2 | Human | Cervix | CC | 4.20e-07 | -2.08e-01 | 0.0391 |
| 9071 | CLDN10 | CA_HPV_3 | Human | Cervix | CC | 5.82e-04 | -1.97e-01 | 0.0414 |
| 9071 | CLDN10 | N_HPV_1 | Human | Cervix | N_HPV | 7.89e-06 | -1.72e-01 | 0.0079 |
| 9071 | CLDN10 | H2 | Human | Cervix | HSIL_HPV | 3.48e-09 | 5.43e-01 | 0.0632 |
| 9071 | CLDN10 | T2 | Human | Cervix | CC | 4.48e-06 | 6.07e-01 | 0.0709 |
| 9071 | CLDN10 | P2T-E | Human | Esophagus | ESCC | 1.20e-36 | 8.31e-01 | 0.1177 |
| 9071 | CLDN10 | P5T-E | Human | Esophagus | ESCC | 8.45e-05 | -1.65e-01 | 0.1327 |
| 9071 | CLDN10 | P8T-E | Human | Esophagus | ESCC | 1.78e-03 | -2.75e-01 | 0.0889 |
| 9071 | CLDN10 | P9T-E | Human | Esophagus | ESCC | 2.72e-07 | -7.95e-02 | 0.1131 |
| 9071 | CLDN10 | P10T-E | Human | Esophagus | ESCC | 3.75e-03 | -2.75e-01 | 0.116 |
| 9071 | CLDN10 | P15T-E | Human | Esophagus | ESCC | 1.37e-23 | -8.31e-02 | 0.1149 |
| 9071 | CLDN10 | P20T-E | Human | Esophagus | ESCC | 4.39e-07 | 4.56e-01 | 0.1124 |
| 9071 | CLDN10 | P21T-E | Human | Esophagus | ESCC | 1.13e-02 | 7.70e-01 | 0.1617 |
| 9071 | CLDN10 | P22T-E | Human | Esophagus | ESCC | 1.66e-02 | -2.75e-01 | 0.1236 |
| 9071 | CLDN10 | P23T-E | Human | Esophagus | ESCC | 1.22e-10 | 1.69e+00 | 0.108 |
| 9071 | CLDN10 | P24T-E | Human | Esophagus | ESCC | 9.08e-12 | 6.48e-01 | 0.1287 |
| 9071 | CLDN10 | P26T-E | Human | Esophagus | ESCC | 3.50e-02 | -2.75e-01 | 0.1276 |
| 9071 | CLDN10 | P27T-E | Human | Esophagus | ESCC | 1.26e-15 | 5.03e-01 | 0.1055 |
| 9071 | CLDN10 | P39T-E | Human | Esophagus | ESCC | 1.33e-05 | 4.22e-01 | 0.0894 |
| Page: 1 2 3 4 |
| Tissue | Expression Dynamics | Abbreviation |
| Cervix |  | CC: Cervix cancer |
| HSIL_HPV: HPV-infected high-grade squamous intraepithelial lesions | ||
| N_HPV: HPV-infected normal cervix | ||
| Esophagus | 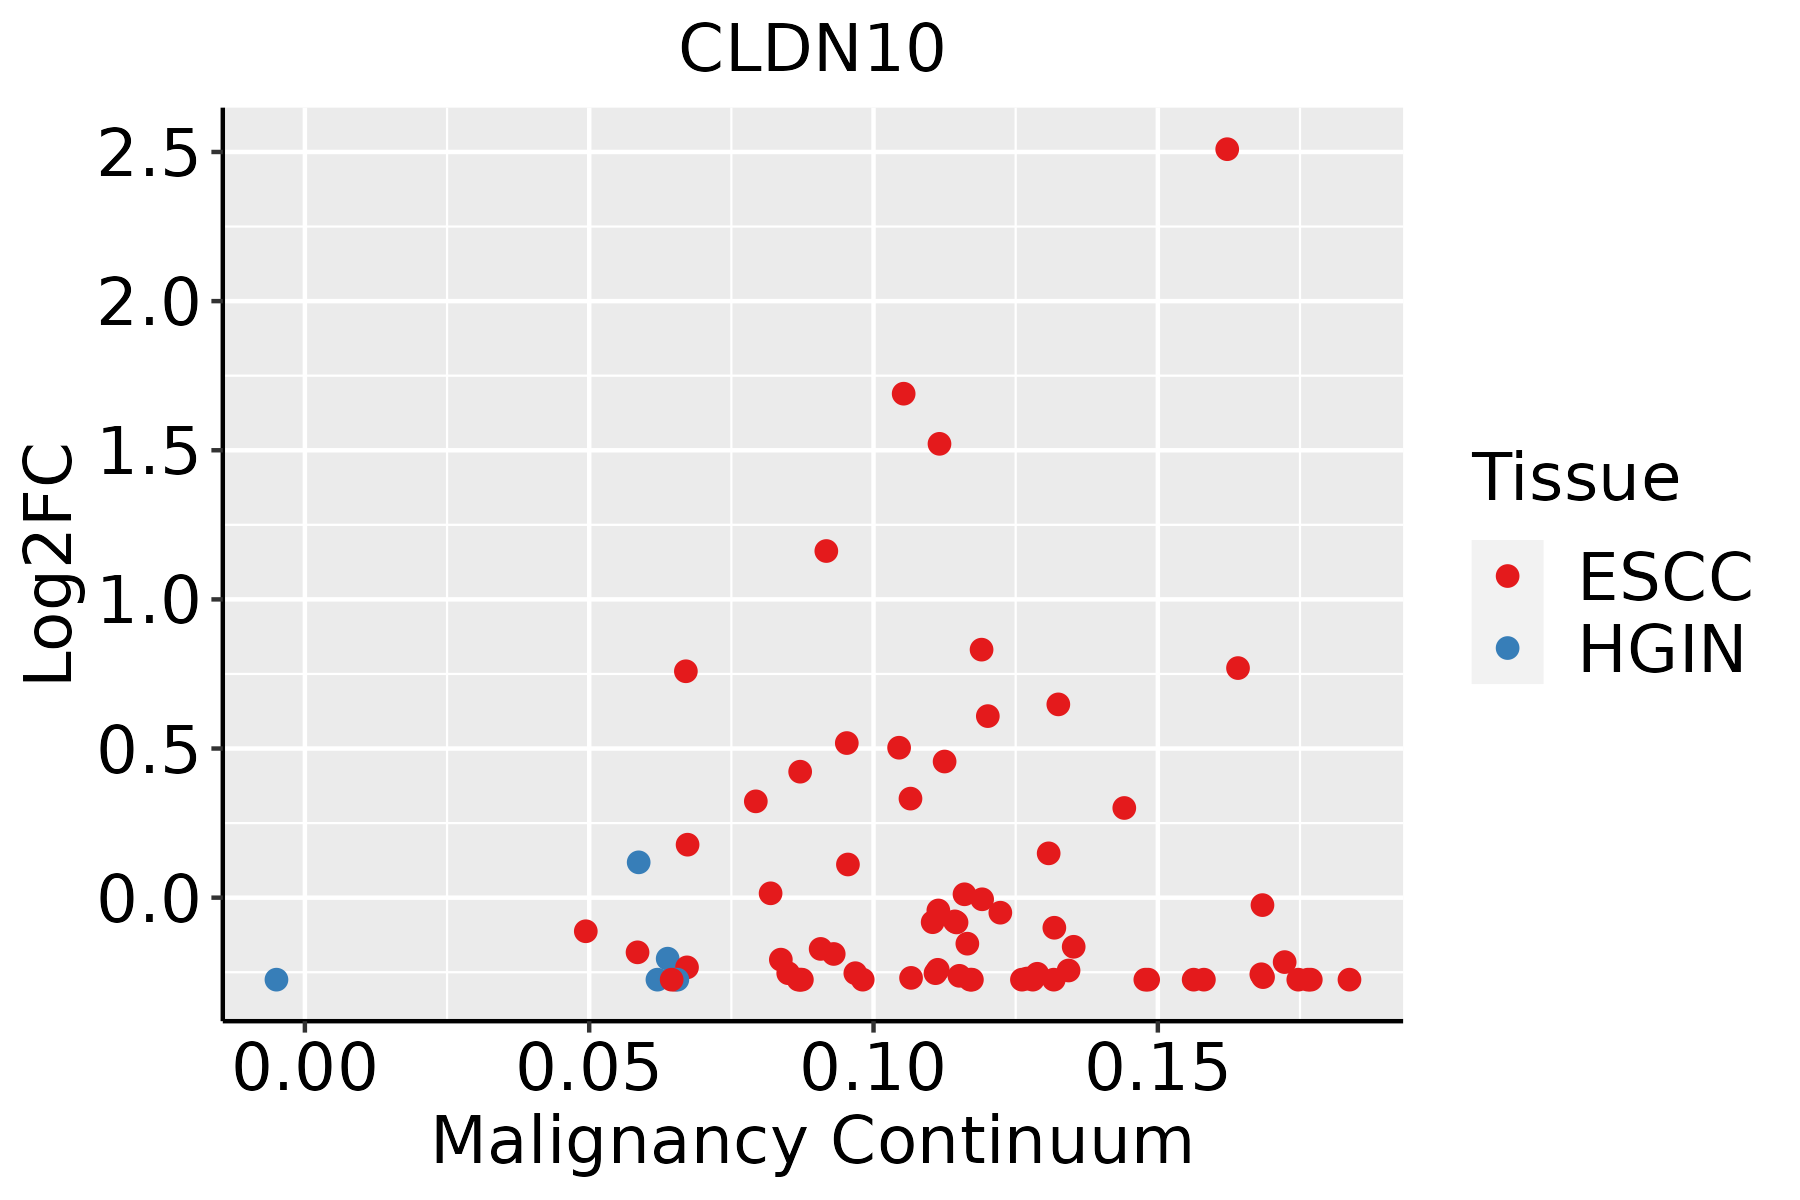 | ESCC: Esophageal squamous cell carcinoma |
| HGIN: High-grade intraepithelial neoplasias | ||
| LGIN: Low-grade intraepithelial neoplasias | ||
| Liver | 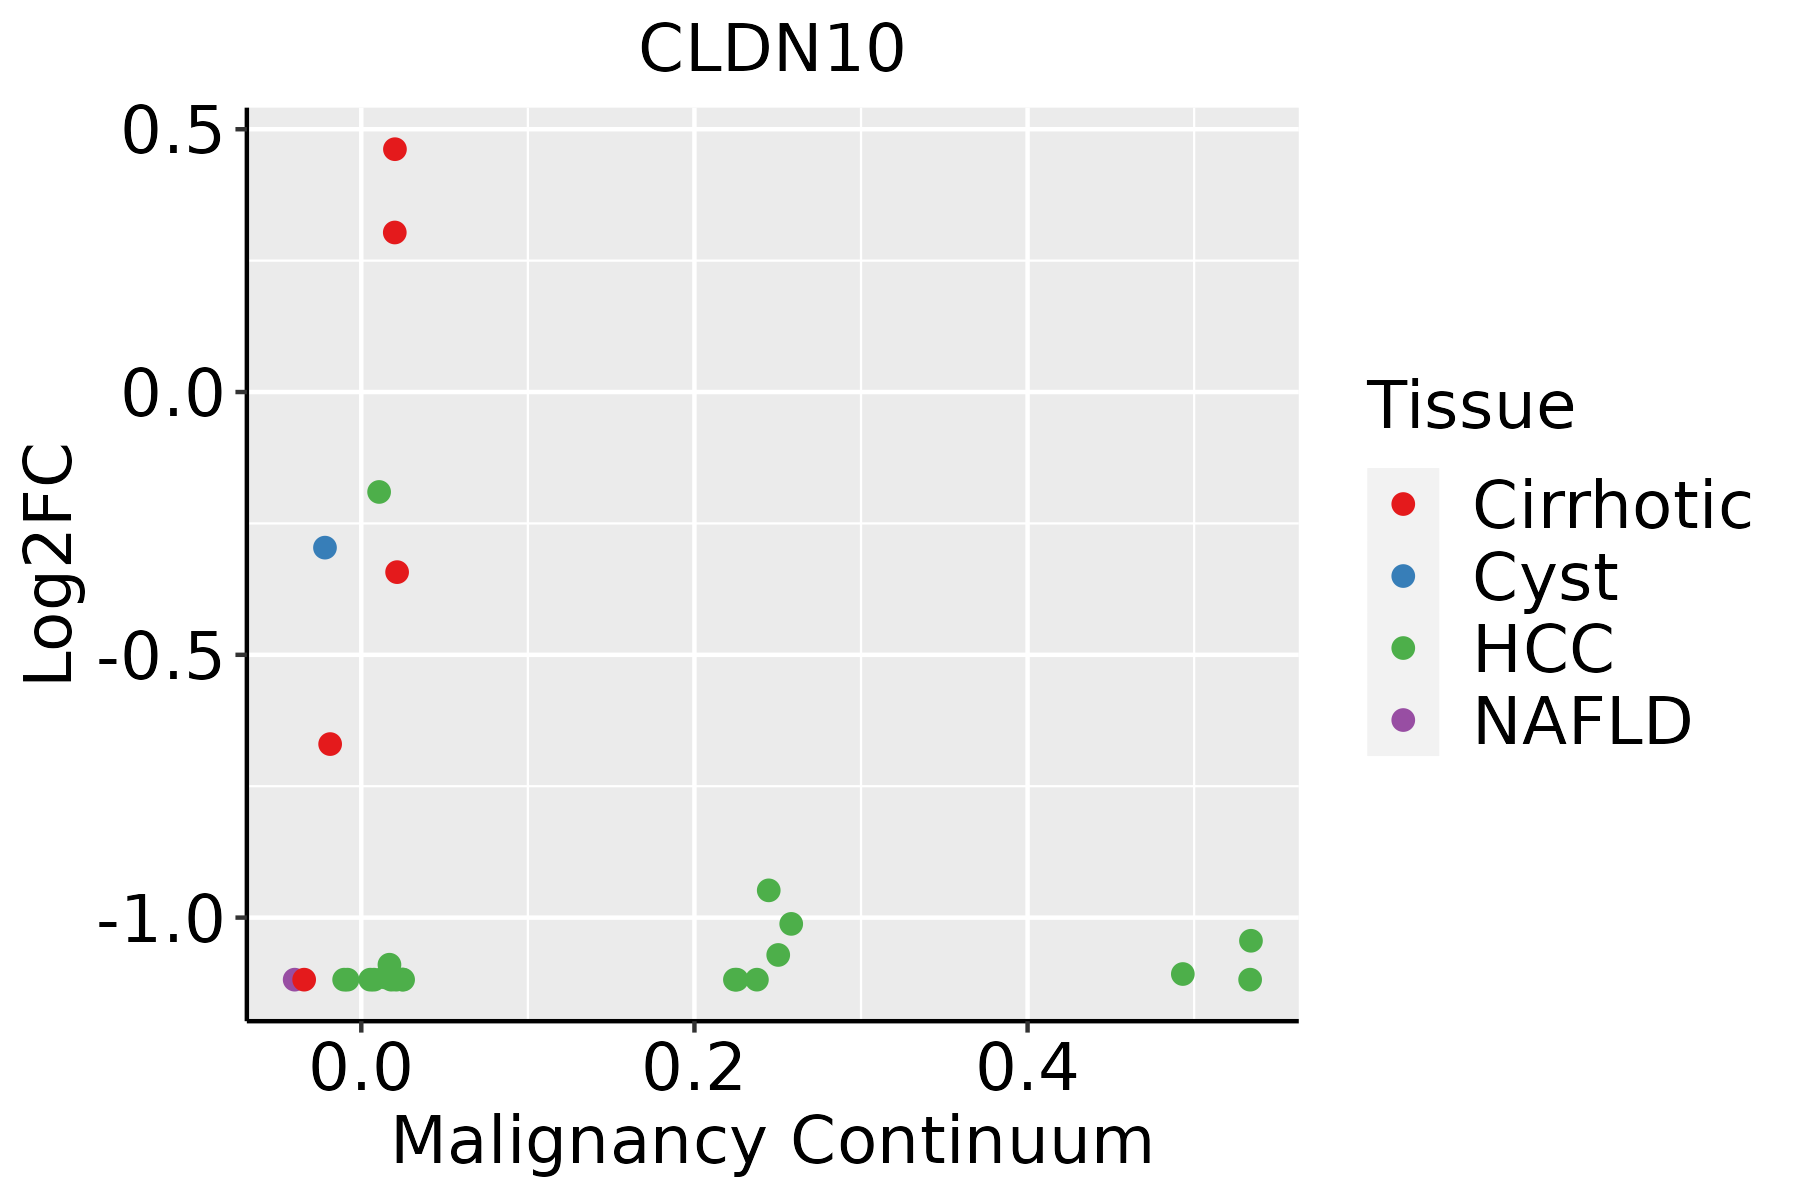 | HCC: Hepatocellular carcinoma |
| NAFLD: Non-alcoholic fatty liver disease | ||
| Lung |  | AAH: Atypical adenomatous hyperplasia |
| AIS: Adenocarcinoma in situ | ||
| IAC: Invasive lung adenocarcinoma | ||
| MIA: Minimally invasive adenocarcinoma | ||
| Oral Cavity | 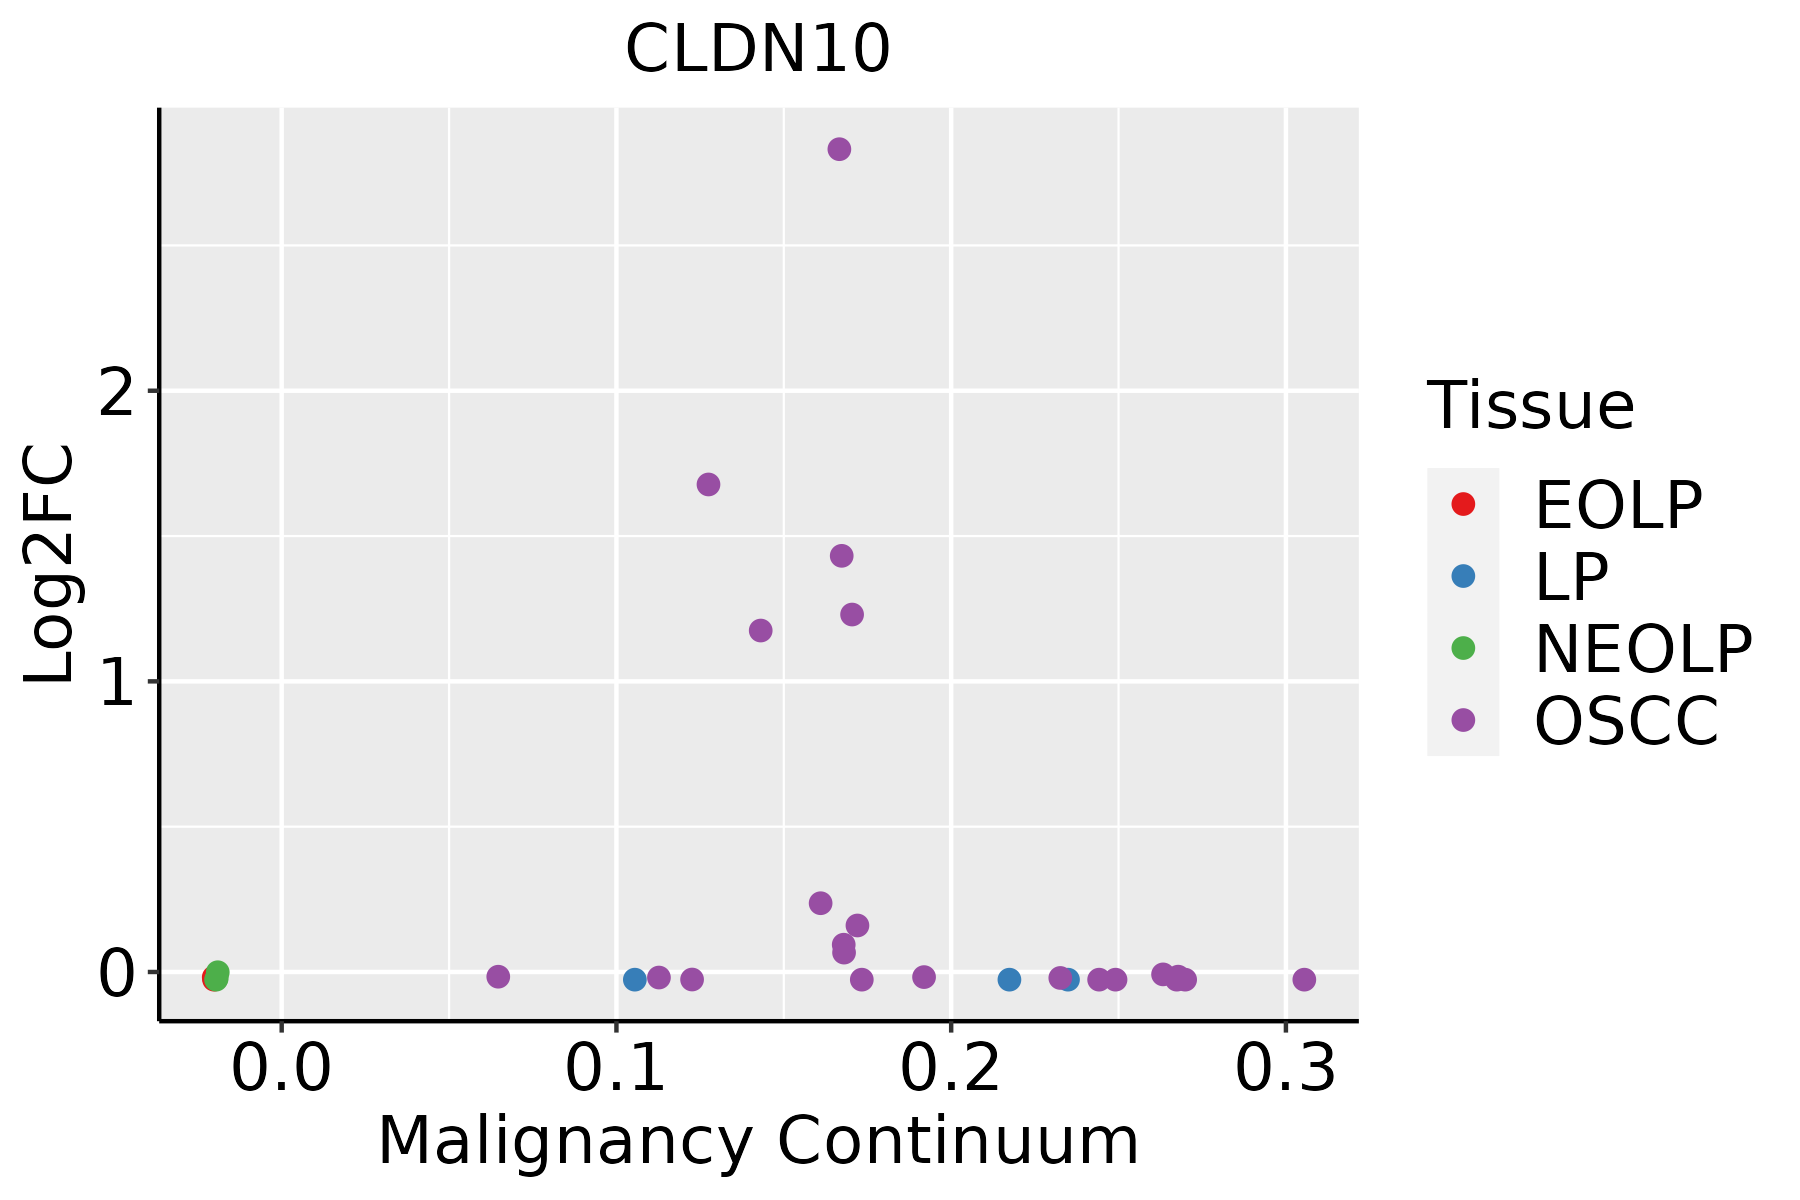 | EOLP: Erosive Oral lichen planus |
| LP: leukoplakia | ||
| NEOLP: Non-erosive oral lichen planus | ||
| OSCC: Oral squamous cell carcinoma | ||
| Thyroid | 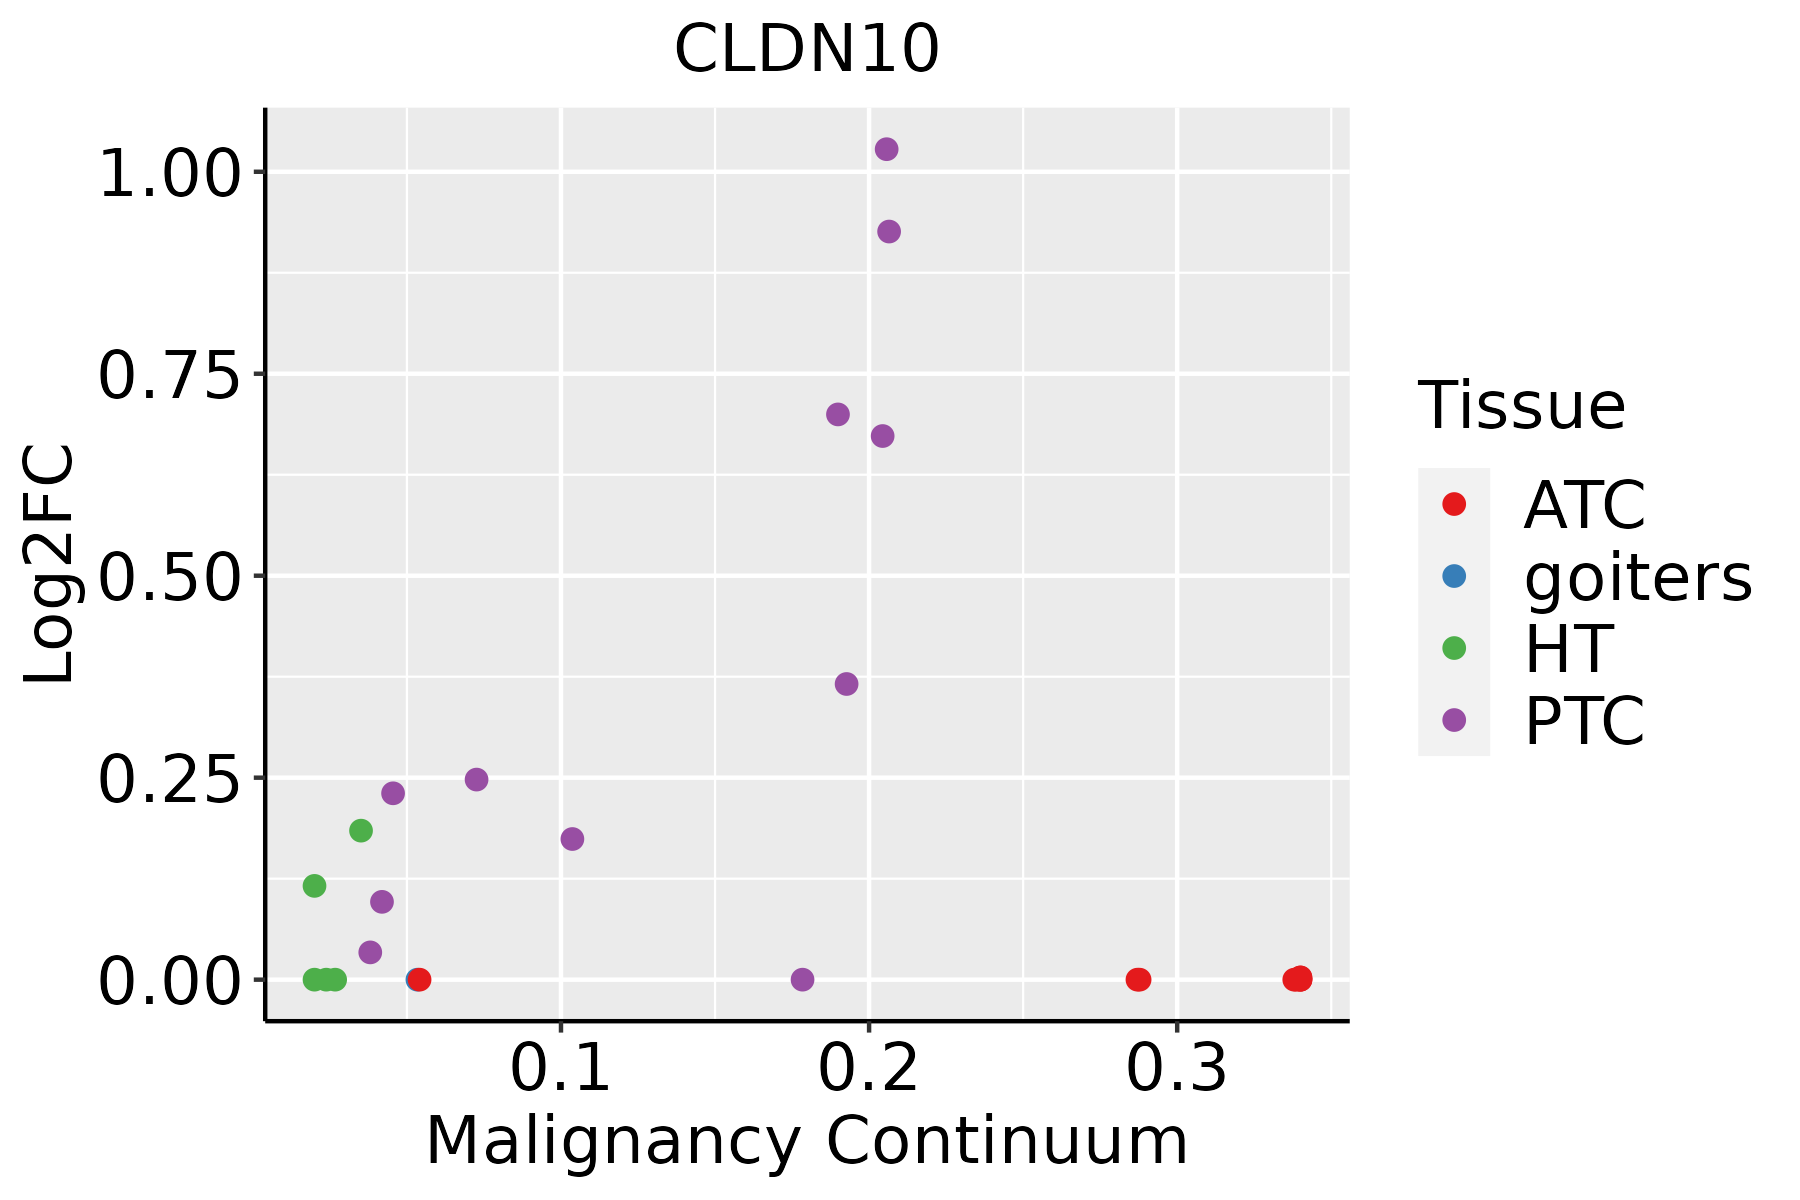 | ATC: Anaplastic thyroid cancer |
| HT: Hashimoto's thyroiditis | ||
| PTC: Papillary thyroid cancer |
| ∗log2FC in expression of this searched gene in stem-like cells from each diseased tissue sample relative to stem-like cells in normal samples in each tissue plotted against the malignancy continuum. Samples are colored based on if they are from different disease stage. |
Top |
Malignant transformation related pathway analysis |
| Find out the enriched GO biological processes and KEGG pathways involved in transition from healthy to precancer to cancer |
| Tissue | Disease Stage | Enriched GO biological Processes |
| Colorectum | AD |  |
| Colorectum | SER |  |
| Colorectum | MSS |  |
| Colorectum | MSI-H |  |
| Colorectum | FAP |  |
| ∗Top 15 enriched GO BP terms are showed in the bar plot of each disease state in each tissue. Each row represents a significant GO biological process which is colored according to the -log10(p.adjust). |
| Page: 1 2 3 4 5 6 7 8 9 |
| GO ID | Tissue | Disease Stage | Description | Gene Ratio | Bg Ratio | pvalue | p.adjust | Count |
| GO:00452169 | Cervix | CC | cell-cell junction organization | 53/2311 | 200/18723 | 3.83e-08 | 2.53e-06 | 53 |
| GO:00343298 | Cervix | CC | cell junction assembly | 88/2311 | 420/18723 | 3.42e-07 | 1.38e-05 | 88 |
| GO:00070439 | Cervix | CC | cell-cell junction assembly | 39/2311 | 146/18723 | 1.86e-06 | 5.94e-05 | 39 |
| GO:00432978 | Cervix | CC | apical junction assembly | 24/2311 | 78/18723 | 1.36e-05 | 2.73e-04 | 24 |
| GO:01201927 | Cervix | CC | tight junction assembly | 21/2311 | 74/18723 | 1.69e-04 | 2.00e-03 | 21 |
| GO:01201937 | Cervix | CC | tight junction organization | 22/2311 | 80/18723 | 1.97e-04 | 2.26e-03 | 22 |
| GO:00708306 | Cervix | CC | bicellular tight junction assembly | 18/2311 | 70/18723 | 1.69e-03 | 1.29e-02 | 18 |
| GO:004521614 | Cervix | HSIL_HPV | cell-cell junction organization | 23/737 | 200/18723 | 4.21e-06 | 1.69e-04 | 23 |
| GO:000704314 | Cervix | HSIL_HPV | cell-cell junction assembly | 19/737 | 146/18723 | 4.72e-06 | 1.84e-04 | 19 |
| GO:004329714 | Cervix | HSIL_HPV | apical junction assembly | 11/737 | 78/18723 | 2.29e-04 | 4.03e-03 | 11 |
| GO:007083013 | Cervix | HSIL_HPV | bicellular tight junction assembly | 10/737 | 70/18723 | 3.94e-04 | 6.10e-03 | 10 |
| GO:012019213 | Cervix | HSIL_HPV | tight junction assembly | 10/737 | 74/18723 | 6.19e-04 | 8.62e-03 | 10 |
| GO:012019313 | Cervix | HSIL_HPV | tight junction organization | 10/737 | 80/18723 | 1.15e-03 | 1.38e-02 | 10 |
| GO:003432913 | Cervix | HSIL_HPV | cell junction assembly | 28/737 | 420/18723 | 4.82e-03 | 3.98e-02 | 28 |
| GO:004521624 | Cervix | N_HPV | cell-cell junction organization | 15/534 | 200/18723 | 6.41e-04 | 8.27e-03 | 15 |
| GO:0098742 | Cervix | N_HPV | cell-cell adhesion via plasma-membrane adhesion molecules | 17/534 | 273/18723 | 2.26e-03 | 2.11e-02 | 17 |
| GO:000704323 | Cervix | N_HPV | cell-cell junction assembly | 11/534 | 146/18723 | 3.15e-03 | 2.64e-02 | 11 |
| GO:012019323 | Cervix | N_HPV | tight junction organization | 7/534 | 80/18723 | 7.80e-03 | 4.97e-02 | 7 |
| GO:003432918 | Esophagus | ESCC | cell junction assembly | 227/8552 | 420/18723 | 3.06e-04 | 1.83e-03 | 227 |
| GO:004521620 | Esophagus | ESCC | cell-cell junction organization | 114/8552 | 200/18723 | 8.04e-04 | 4.16e-03 | 114 |
| Page: 1 2 3 |
| Pathway ID | Tissue | Disease Stage | Description | Gene Ratio | Bg Ratio | pvalue | p.adjust | qvalue | Count |
| hsa0513020 | Cervix | CC | Pathogenic Escherichia coli infection | 63/1267 | 197/8465 | 9.28e-10 | 2.00e-08 | 1.19e-08 | 63 |
| hsa0453020 | Cervix | CC | Tight junction | 49/1267 | 169/8465 | 1.87e-06 | 1.78e-05 | 1.05e-05 | 49 |
| hsa0467020 | Cervix | CC | Leukocyte transendothelial migration | 36/1267 | 114/8465 | 5.22e-06 | 4.83e-05 | 2.86e-05 | 36 |
| hsa045147 | Cervix | CC | Cell adhesion molecules | 36/1267 | 157/8465 | 4.94e-03 | 1.67e-02 | 9.86e-03 | 36 |
| hsa05130110 | Cervix | CC | Pathogenic Escherichia coli infection | 63/1267 | 197/8465 | 9.28e-10 | 2.00e-08 | 1.19e-08 | 63 |
| hsa04530110 | Cervix | CC | Tight junction | 49/1267 | 169/8465 | 1.87e-06 | 1.78e-05 | 1.05e-05 | 49 |
| hsa04670110 | Cervix | CC | Leukocyte transendothelial migration | 36/1267 | 114/8465 | 5.22e-06 | 4.83e-05 | 2.86e-05 | 36 |
| hsa0451412 | Cervix | CC | Cell adhesion molecules | 36/1267 | 157/8465 | 4.94e-03 | 1.67e-02 | 9.86e-03 | 36 |
| hsa0513025 | Cervix | HSIL_HPV | Pathogenic Escherichia coli infection | 28/459 | 197/8465 | 2.36e-06 | 4.61e-05 | 3.73e-05 | 28 |
| hsa0451421 | Cervix | HSIL_HPV | Cell adhesion molecules | 20/459 | 157/8465 | 3.03e-04 | 3.06e-03 | 2.47e-03 | 20 |
| hsa0467025 | Cervix | HSIL_HPV | Leukocyte transendothelial migration | 16/459 | 114/8465 | 4.04e-04 | 3.49e-03 | 2.82e-03 | 16 |
| hsa0513035 | Cervix | HSIL_HPV | Pathogenic Escherichia coli infection | 28/459 | 197/8465 | 2.36e-06 | 4.61e-05 | 3.73e-05 | 28 |
| hsa0451431 | Cervix | HSIL_HPV | Cell adhesion molecules | 20/459 | 157/8465 | 3.03e-04 | 3.06e-03 | 2.47e-03 | 20 |
| hsa0467035 | Cervix | HSIL_HPV | Leukocyte transendothelial migration | 16/459 | 114/8465 | 4.04e-04 | 3.49e-03 | 2.82e-03 | 16 |
| hsa0513044 | Cervix | N_HPV | Pathogenic Escherichia coli infection | 25/349 | 197/8465 | 4.71e-07 | 8.00e-06 | 6.25e-06 | 25 |
| hsa0451441 | Cervix | N_HPV | Cell adhesion molecules | 18/349 | 157/8465 | 7.71e-05 | 8.06e-04 | 6.30e-04 | 18 |
| hsa0453025 | Cervix | N_HPV | Tight junction | 16/349 | 169/8465 | 1.60e-03 | 1.01e-02 | 7.92e-03 | 16 |
| hsa0467045 | Cervix | N_HPV | Leukocyte transendothelial migration | 12/349 | 114/8465 | 2.50e-03 | 1.45e-02 | 1.13e-02 | 12 |
| hsa0513054 | Cervix | N_HPV | Pathogenic Escherichia coli infection | 25/349 | 197/8465 | 4.71e-07 | 8.00e-06 | 6.25e-06 | 25 |
| hsa0451451 | Cervix | N_HPV | Cell adhesion molecules | 18/349 | 157/8465 | 7.71e-05 | 8.06e-04 | 6.30e-04 | 18 |
| Page: 1 2 3 4 |
Top |
Cell-cell communication analysis |
| Identification of potential cell-cell interactions between two cell types and their ligand-receptor pairs for different disease states |
| Ligand | Receptor | LRpair | Pathway | Tissue | Disease Stage |
| Page: 1 |
Top |
Single-cell gene regulatory network inference analysis |
| Find out the significant the regulons (TFs) and the target genes of each regulon across cell types for different disease states |
| TF | Cell Type | Tissue | Disease Stage | Target Gene | RSS | Regulon Activity |
| ∗The dot plots of a searched regulon are shown for all cell subpopulations in each disease state of each tissue based on the regulon specific score inferred using pySCENIC and by calculating the average expression. |
| Page: 1 |
Top |
Somatic mutation of malignant transformation related genes |
| Annotation of somatic variants for genes involved in malignant transformation |
| Hugo Symbol | Variant Class | Variant Classification | dbSNP RS | HGVSc | HGVSp | HGVSp Short | SWISSPROT | BIOTYPE | SIFT | PolyPhen | Tumor Sample Barcode | Tissue | Histology | Sex | Age | Stage | Therapy Types | Drugs | Outcome |
| CLDN10 | SNV | Missense_Mutation | c.247N>T | p.Met83Leu | p.M83L | P78369 | protein_coding | deleterious(0.05) | benign(0.013) | TCGA-A8-A08P-01 | Breast | breast invasive carcinoma | Female | >=65 | III/IV | Chemotherapy | 5-fluorouracil | CR | |
| CLDN10 | SNV | Missense_Mutation | c.442N>C | p.Asp148His | p.D148H | P78369 | protein_coding | deleterious(0) | probably_damaging(0.989) | TCGA-C8-A26Y-01 | Breast | breast invasive carcinoma | Female | >=65 | I/II | Unknown | Unknown | SD | |
| CLDN10 | SNV | Missense_Mutation | rs369800452 | c.350C>G | p.Ala117Gly | p.A117G | P78369 | protein_coding | deleterious(0.01) | possibly_damaging(0.665) | TCGA-E2-A14S-01 | Breast | breast invasive carcinoma | Female | >=65 | I/II | Chemotherapy | cytoxan | SD |
| CLDN10 | SNV | Missense_Mutation | c.43N>A | p.Gly15Arg | p.G15R | P78369 | protein_coding | deleterious(0) | probably_damaging(1) | TCGA-GM-A2DH-01 | Breast | breast invasive carcinoma | Female | <65 | I/II | Chemotherapy | taxol | CR | |
| CLDN10 | SNV | Missense_Mutation | novel | c.203N>G | p.Phe68Cys | p.F68C | P78369 | protein_coding | deleterious(0) | possibly_damaging(0.852) | TCGA-EA-A3HU-01 | Cervix | cervical & endocervical cancer | Female | <65 | I/II | Unknown | Unknown | SD |
| CLDN10 | SNV | Missense_Mutation | novel | c.21N>C | p.Glu7Asp | p.E7D | P78369 | protein_coding | deleterious(0.01) | possibly_damaging(0.703) | TCGA-VS-A958-01 | Cervix | cervical & endocervical cancer | Female | <65 | I/II | Chemotherapy | cisplatin | CR |
| CLDN10 | SNV | Missense_Mutation | c.438N>A | p.Phe146Leu | p.F146L | P78369 | protein_coding | deleterious(0.03) | probably_damaging(0.932) | TCGA-AA-3510-01 | Colorectum | colon adenocarcinoma | Male | >=65 | I/II | Unknown | Unknown | SD | |
| CLDN10 | SNV | Missense_Mutation | c.131A>G | p.Tyr44Cys | p.Y44C | P78369 | protein_coding | deleterious(0) | possibly_damaging(0.838) | TCGA-AA-3715-01 | Colorectum | colon adenocarcinoma | Male | >=65 | I/II | Unknown | Unknown | PD | |
| CLDN10 | SNV | Missense_Mutation | novel | c.163N>A | p.Ala55Thr | p.A55T | P78369 | protein_coding | deleterious(0) | benign(0.149) | TCGA-AA-3811-01 | Colorectum | colon adenocarcinoma | Female | >=65 | III/IV | Unknown | Unknown | PD |
| CLDN10 | SNV | Missense_Mutation | c.590N>T | p.Ala197Val | p.A197V | P78369 | protein_coding | tolerated(0.07) | benign(0.006) | TCGA-AU-6004-01 | Colorectum | colon adenocarcinoma | Female | >=65 | I/II | Unknown | Unknown | SD |
| Page: 1 2 3 4 5 6 |
Top |
Related drugs of malignant transformation related genes |
| Identification of chemicals and drugs interact with genes involved in malignant transfromation |
| (DGIdb 4.0) |
| Entrez ID | Symbol | Category | Interaction Types | Drug Claim Name | Drug Name | PMIDs |
| Page: 1 |

Copyright 2023-Present -The University of Texas Health Science Center at Houston |