
|
|||||
|
 | |
| |
| |
| |
| |
| |
|
Gene: CLCF1 |
Gene summary for CLCF1 |
| Gene information | Species | Human | Gene symbol | CLCF1 | Gene ID | 23529 |
| Gene name | cardiotrophin like cytokine factor 1 | |
| Gene Alias | BSF-3 | |
| Cytomap | 11q13.2 | |
| Gene Type | protein-coding | GO ID | GO:0000018 | UniProtAcc | Q9UBD9 |
Top |
Malignant transformation analysis |
| Identification of the aberrant gene expression in precancerous and cancerous lesions by comparing the gene expression of stem-like cells in diseased tissues with normal stem cells |
| Entrez ID | Symbol | Replicates | Species | Organ | Tissue | Adj P-value | Log2FC | Malignancy |
| 23529 | CLCF1 | LZE24T | Human | Esophagus | ESCC | 2.90e-03 | 3.30e-01 | 0.0596 |
| 23529 | CLCF1 | P4T-E | Human | Esophagus | ESCC | 3.51e-04 | 2.55e-01 | 0.1323 |
| 23529 | CLCF1 | P8T-E | Human | Esophagus | ESCC | 2.19e-30 | 1.06e+00 | 0.0889 |
| 23529 | CLCF1 | P9T-E | Human | Esophagus | ESCC | 6.59e-04 | 2.82e-01 | 0.1131 |
| 23529 | CLCF1 | P10T-E | Human | Esophagus | ESCC | 5.31e-04 | 6.49e-02 | 0.116 |
| 23529 | CLCF1 | P12T-E | Human | Esophagus | ESCC | 6.81e-13 | 4.80e-01 | 0.1122 |
| 23529 | CLCF1 | P15T-E | Human | Esophagus | ESCC | 1.20e-04 | 7.84e-02 | 0.1149 |
| 23529 | CLCF1 | P16T-E | Human | Esophagus | ESCC | 3.34e-04 | -3.76e-02 | 0.1153 |
| 23529 | CLCF1 | P21T-E | Human | Esophagus | ESCC | 7.91e-09 | 4.10e-01 | 0.1617 |
| 23529 | CLCF1 | P22T-E | Human | Esophagus | ESCC | 5.31e-03 | -3.09e-03 | 0.1236 |
| 23529 | CLCF1 | P23T-E | Human | Esophagus | ESCC | 2.87e-05 | 5.41e-01 | 0.108 |
| 23529 | CLCF1 | P24T-E | Human | Esophagus | ESCC | 2.17e-09 | 2.73e-01 | 0.1287 |
| 23529 | CLCF1 | P31T-E | Human | Esophagus | ESCC | 3.45e-04 | 2.53e-01 | 0.1251 |
| 23529 | CLCF1 | P32T-E | Human | Esophagus | ESCC | 9.98e-08 | 1.24e-01 | 0.1666 |
| 23529 | CLCF1 | P36T-E | Human | Esophagus | ESCC | 1.00e-06 | 5.75e-01 | 0.1187 |
| 23529 | CLCF1 | P37T-E | Human | Esophagus | ESCC | 2.94e-10 | 2.46e-01 | 0.1371 |
| 23529 | CLCF1 | P42T-E | Human | Esophagus | ESCC | 9.21e-03 | 2.93e-01 | 0.1175 |
| 23529 | CLCF1 | P47T-E | Human | Esophagus | ESCC | 1.75e-10 | 3.15e-01 | 0.1067 |
| 23529 | CLCF1 | P49T-E | Human | Esophagus | ESCC | 1.85e-12 | 2.35e+00 | 0.1768 |
| 23529 | CLCF1 | P54T-E | Human | Esophagus | ESCC | 6.65e-20 | 8.15e-01 | 0.0975 |
| Page: 1 2 |
| Tissue | Expression Dynamics | Abbreviation |
| Esophagus |  | ESCC: Esophageal squamous cell carcinoma |
| HGIN: High-grade intraepithelial neoplasias | ||
| LGIN: Low-grade intraepithelial neoplasias | ||
| Oral Cavity | 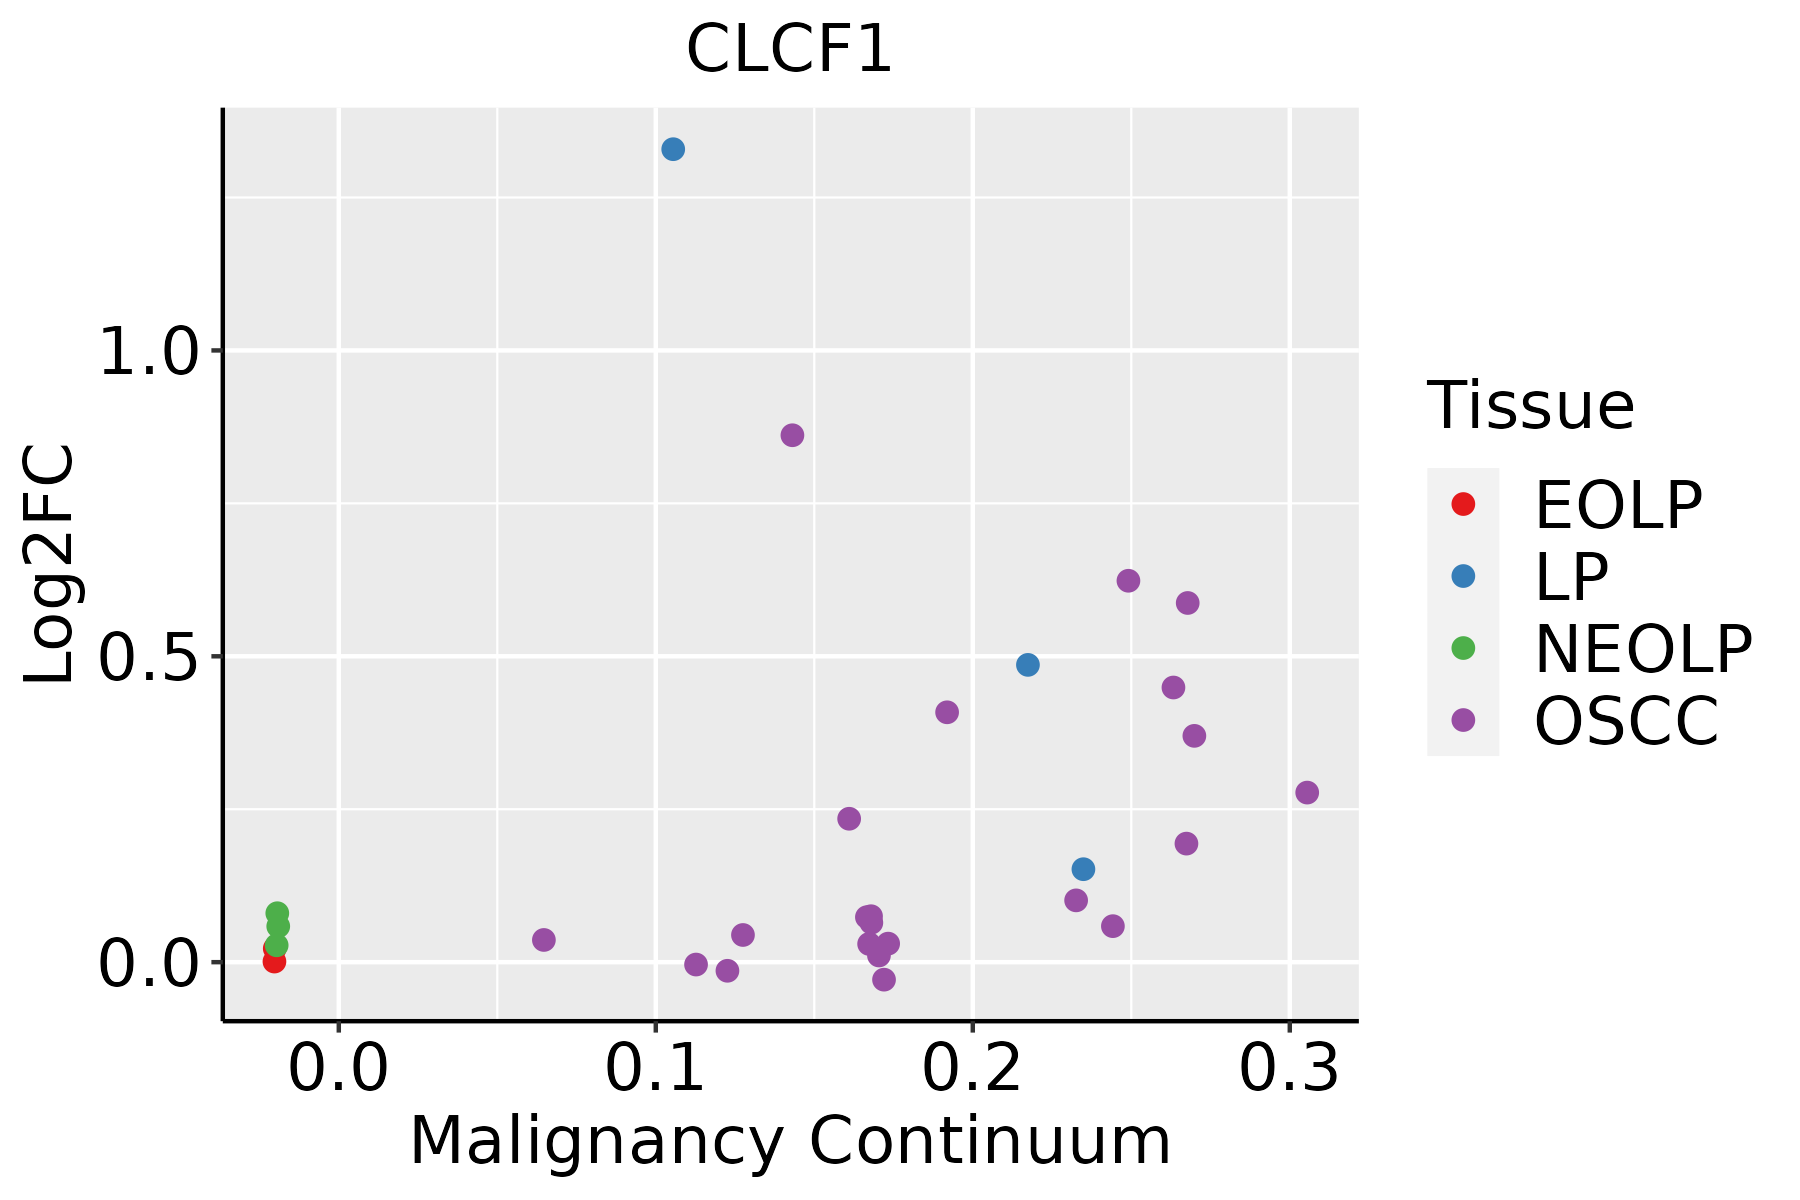 | EOLP: Erosive Oral lichen planus |
| LP: leukoplakia | ||
| NEOLP: Non-erosive oral lichen planus | ||
| OSCC: Oral squamous cell carcinoma |
| ∗log2FC in expression of this searched gene in stem-like cells from each diseased tissue sample relative to stem-like cells in normal samples in each tissue plotted against the malignancy continuum. Samples are colored based on if they are from different disease stage. |
Top |
Malignant transformation related pathway analysis |
| Find out the enriched GO biological processes and KEGG pathways involved in transition from healthy to precancer to cancer |
| Tissue | Disease Stage | Enriched GO biological Processes |
| Colorectum | AD |  |
| Colorectum | SER |  |
| Colorectum | MSS |  |
| Colorectum | MSI-H |  |
| Colorectum | FAP |  |
| ∗Top 15 enriched GO BP terms are showed in the bar plot of each disease state in each tissue. Each row represents a significant GO biological process which is colored according to the -log10(p.adjust). |
| Page: 1 2 3 4 5 6 7 8 9 |
| GO ID | Tissue | Disease Stage | Description | Gene Ratio | Bg Ratio | pvalue | p.adjust | Count |
| GO:005105215 | Esophagus | ESCC | regulation of DNA metabolic process | 232/8552 | 359/18723 | 2.40e-13 | 1.13e-11 | 232 |
| GO:005105417 | Esophagus | ESCC | positive regulation of DNA metabolic process | 139/8552 | 201/18723 | 1.20e-11 | 4.33e-10 | 139 |
| GO:0070997111 | Esophagus | ESCC | neuron death | 216/8552 | 361/18723 | 3.49e-08 | 6.45e-07 | 216 |
| GO:0051402110 | Esophagus | ESCC | neuron apoptotic process | 148/8552 | 246/18723 | 3.08e-06 | 3.47e-05 | 148 |
| GO:1901214111 | Esophagus | ESCC | regulation of neuron death | 186/8552 | 319/18723 | 3.35e-06 | 3.73e-05 | 186 |
| GO:001072010 | Esophagus | ESCC | positive regulation of cell development | 172/8552 | 298/18723 | 1.74e-05 | 1.55e-04 | 172 |
| GO:00420636 | Esophagus | ESCC | gliogenesis | 172/8552 | 301/18723 | 3.75e-05 | 3.04e-04 | 172 |
| GO:005076710 | Esophagus | ESCC | regulation of neurogenesis | 203/8552 | 364/18723 | 6.10e-05 | 4.68e-04 | 203 |
| GO:00507697 | Esophagus | ESCC | positive regulation of neurogenesis | 131/8552 | 225/18723 | 9.71e-05 | 6.90e-04 | 131 |
| GO:00100016 | Esophagus | ESCC | glial cell differentiation | 129/8552 | 225/18723 | 2.73e-04 | 1.65e-03 | 129 |
| GO:004352317 | Esophagus | ESCC | regulation of neuron apoptotic process | 122/8552 | 212/18723 | 3.21e-04 | 1.90e-03 | 122 |
| GO:00519606 | Esophagus | ESCC | regulation of nervous system development | 237/8552 | 443/18723 | 5.02e-04 | 2.78e-03 | 237 |
| GO:00063101 | Esophagus | ESCC | DNA recombination | 168/8552 | 305/18723 | 5.58e-04 | 3.05e-03 | 168 |
| GO:00025622 | Esophagus | ESCC | somatic diversification of immune receptors via germline recombination within a single locus | 43/8552 | 66/18723 | 1.10e-03 | 5.53e-03 | 43 |
| GO:00164442 | Esophagus | ESCC | somatic cell DNA recombination | 43/8552 | 66/18723 | 1.10e-03 | 5.53e-03 | 43 |
| GO:00164472 | Esophagus | ESCC | somatic recombination of immunoglobulin gene segments | 38/8552 | 57/18723 | 1.11e-03 | 5.56e-03 | 38 |
| GO:00022003 | Esophagus | ESCC | somatic diversification of immune receptors | 49/8552 | 77/18723 | 1.12e-03 | 5.60e-03 | 49 |
| GO:19031317 | Esophagus | ESCC | mononuclear cell differentiation | 226/8552 | 426/18723 | 1.20e-03 | 5.88e-03 | 226 |
| GO:00182124 | Esophagus | ESCC | peptidyl-tyrosine modification | 202/8552 | 378/18723 | 1.34e-03 | 6.39e-03 | 202 |
| GO:00519625 | Esophagus | ESCC | positive regulation of nervous system development | 149/8552 | 272/18723 | 1.50e-03 | 7.06e-03 | 149 |
| Page: 1 2 3 4 |
| Pathway ID | Tissue | Disease Stage | Description | Gene Ratio | Bg Ratio | pvalue | p.adjust | qvalue | Count |
| Page: 1 |
Top |
Cell-cell communication analysis |
| Identification of potential cell-cell interactions between two cell types and their ligand-receptor pairs for different disease states |
| Ligand | Receptor | LRpair | Pathway | Tissue | Disease Stage |
| Page: 1 |
Top |
Single-cell gene regulatory network inference analysis |
| Find out the significant the regulons (TFs) and the target genes of each regulon across cell types for different disease states |
| TF | Cell Type | Tissue | Disease Stage | Target Gene | RSS | Regulon Activity |
| ∗The dot plots of a searched regulon are shown for all cell subpopulations in each disease state of each tissue based on the regulon specific score inferred using pySCENIC and by calculating the average expression. |
| Page: 1 |
Top |
Somatic mutation of malignant transformation related genes |
| Annotation of somatic variants for genes involved in malignant transformation |
| Hugo Symbol | Variant Class | Variant Classification | dbSNP RS | HGVSc | HGVSp | HGVSp Short | SWISSPROT | BIOTYPE | SIFT | PolyPhen | Tumor Sample Barcode | Tissue | Histology | Sex | Age | Stage | Therapy Types | Drugs | Outcome |
| CLCF1 | SNV | Missense_Mutation | rs764602656 | c.322G>A | p.Glu108Lys | p.E108K | Q9UBD9 | protein_coding | tolerated(0.98) | benign(0.007) | TCGA-D8-A27R-01 | Breast | breast invasive carcinoma | Female | <65 | III/IV | Chemotherapy | adriamycin+cyclophosphamide | SD |
| CLCF1 | SNV | Missense_Mutation | rs761887384 | c.364N>T | p.Arg122Cys | p.R122C | Q9UBD9 | protein_coding | deleterious(0.05) | possibly_damaging(0.566) | TCGA-AU-6004-01 | Colorectum | colon adenocarcinoma | Female | >=65 | I/II | Unknown | Unknown | SD |
| CLCF1 | SNV | Missense_Mutation | c.172N>A | p.Ala58Thr | p.A58T | Q9UBD9 | protein_coding | tolerated(0.15) | possibly_damaging(0.616) | TCGA-CM-4743-01 | Colorectum | colon adenocarcinoma | Male | >=65 | I/II | Chemotherapy | capecitabine | SD | |
| CLCF1 | SNV | Missense_Mutation | rs757544375 | c.550N>A | p.Asp184Asn | p.D184N | Q9UBD9 | protein_coding | tolerated(0.05) | benign(0.124) | TCGA-AP-A051-01 | Endometrium | uterine corpus endometrioid carcinoma | Female | >=65 | I/II | Unknown | Unknown | SD |
| CLCF1 | SNV | Missense_Mutation | novel | c.50N>T | p.Thr17Met | p.T17M | Q9UBD9 | protein_coding | deleterious(0.02) | benign(0.09) | TCGA-D1-A2G0-01 | Endometrium | uterine corpus endometrioid carcinoma | Female | >=65 | I/II | Unknown | Unknown | SD |
| CLCF1 | SNV | Missense_Mutation | novel | c.68C>T | p.Pro23Leu | p.P23L | Q9UBD9 | protein_coding | deleterious(0.01) | possibly_damaging(0.559) | TCGA-DD-AACH-01 | Liver | liver hepatocellular carcinoma | Male | >=65 | I/II | Unknown | Unknown | PD |
| CLCF1 | SNV | Missense_Mutation | c.463G>A | p.Gly155Ser | p.G155S | Q9UBD9 | protein_coding | tolerated(0.06) | probably_damaging(0.986) | TCGA-BR-4357-01 | Stomach | stomach adenocarcinoma | Male | <65 | III/IV | Unknown | Unknown | SD | |
| CLCF1 | SNV | Missense_Mutation | c.146N>G | p.Tyr49Cys | p.Y49C | Q9UBD9 | protein_coding | deleterious(0) | benign(0.021) | TCGA-BR-8059-01 | Stomach | stomach adenocarcinoma | Male | >=65 | III/IV | Unknown | Unknown | SD | |
| CLCF1 | SNV | Missense_Mutation | novel | c.377C>T | p.Thr126Ile | p.T126I | Q9UBD9 | protein_coding | tolerated(0.24) | benign(0.046) | TCGA-D7-A6EY-01 | Stomach | stomach adenocarcinoma | Female | >=65 | III/IV | Unknown | Unknown | PD |
| CLCF1 | SNV | Missense_Mutation | novel | c.566N>G | p.Lys189Arg | p.K189R | Q9UBD9 | protein_coding | tolerated(1) | benign(0.096) | TCGA-VQ-A91K-01 | Stomach | stomach adenocarcinoma | Male | >=65 | III/IV | Chemotherapy | fluorouracil | CR |
| Page: 1 |
Top |
Related drugs of malignant transformation related genes |
| Identification of chemicals and drugs interact with genes involved in malignant transfromation |
| (DGIdb 4.0) |
| Entrez ID | Symbol | Category | Interaction Types | Drug Claim Name | Drug Name | PMIDs |
| Page: 1 |

Copyright 2023-Present -The University of Texas Health Science Center at Houston |