
|
|||||
|
 | |
| |
| |
| |
| |
| |
|
Gene: CLCA4 |
Gene summary for CLCA4 |
| Gene information | Species | Human | Gene symbol | CLCA4 | Gene ID | 22802 |
| Gene name | chloride channel accessory 4 | |
| Gene Alias | CaCC | |
| Cytomap | 1p22.3 | |
| Gene Type | protein-coding | GO ID | GO:0006508 | UniProtAcc | Q14CN2 |
Top |
Malignant transformation analysis |
| Identification of the aberrant gene expression in precancerous and cancerous lesions by comparing the gene expression of stem-like cells in diseased tissues with normal stem cells |
| Entrez ID | Symbol | Replicates | Species | Organ | Tissue | Adj P-value | Log2FC | Malignancy |
| 22802 | CLCA4 | HTA11_3410_2000001011 | Human | Colorectum | AD | 3.07e-30 | -7.56e-01 | 0.0155 |
| 22802 | CLCA4 | HTA11_2487_2000001011 | Human | Colorectum | SER | 5.27e-08 | -4.21e-01 | -0.1808 |
| 22802 | CLCA4 | HTA11_2951_2000001011 | Human | Colorectum | AD | 1.01e-04 | -7.61e-01 | 0.0216 |
| 22802 | CLCA4 | HTA11_1938_2000001011 | Human | Colorectum | AD | 3.16e-11 | -7.22e-01 | -0.0811 |
| 22802 | CLCA4 | HTA11_78_2000001011 | Human | Colorectum | AD | 2.39e-16 | -7.03e-01 | -0.1088 |
| 22802 | CLCA4 | HTA11_347_2000001011 | Human | Colorectum | AD | 1.16e-24 | -4.50e-01 | -0.1954 |
| 22802 | CLCA4 | HTA11_2112_2000001011 | Human | Colorectum | SER | 4.85e-19 | 8.61e-01 | -0.2196 |
| 22802 | CLCA4 | HTA11_3361_2000001011 | Human | Colorectum | AD | 3.67e-05 | -5.70e-01 | -0.1207 |
| 22802 | CLCA4 | HTA11_83_2000001011 | Human | Colorectum | SER | 1.88e-10 | -7.46e-01 | -0.1526 |
| 22802 | CLCA4 | HTA11_696_2000001011 | Human | Colorectum | AD | 7.00e-24 | -6.63e-01 | -0.1464 |
| 22802 | CLCA4 | HTA11_866_2000001011 | Human | Colorectum | AD | 4.18e-24 | -2.66e-01 | -0.1001 |
| 22802 | CLCA4 | HTA11_1391_2000001011 | Human | Colorectum | AD | 1.66e-15 | -6.71e-01 | -0.059 |
| 22802 | CLCA4 | HTA11_2992_2000001011 | Human | Colorectum | SER | 1.66e-03 | -5.98e-01 | -0.1706 |
| 22802 | CLCA4 | HTA11_5212_2000001011 | Human | Colorectum | AD | 1.03e-02 | -6.62e-01 | -0.2061 |
| 22802 | CLCA4 | HTA11_5216_2000001011 | Human | Colorectum | SER | 1.01e-04 | -7.61e-01 | -0.1462 |
| 22802 | CLCA4 | HTA11_546_2000001011 | Human | Colorectum | AD | 8.01e-09 | -7.44e-01 | -0.0842 |
| 22802 | CLCA4 | HTA11_9341_2000001011 | Human | Colorectum | SER | 1.06e-02 | -7.61e-01 | -0.00410000000000005 |
| 22802 | CLCA4 | HTA11_7862_2000001011 | Human | Colorectum | AD | 7.96e-07 | -7.40e-01 | -0.0179 |
| 22802 | CLCA4 | HTA11_866_3004761011 | Human | Colorectum | AD | 2.28e-29 | -7.61e-01 | 0.096 |
| 22802 | CLCA4 | HTA11_4255_2000001011 | Human | Colorectum | SER | 1.01e-04 | -7.61e-01 | 0.0446 |
| Page: 1 2 3 4 |
| Tissue | Expression Dynamics | Abbreviation |
| Colorectum (GSE201348) |  | FAP: Familial adenomatous polyposis |
| CRC: Colorectal cancer | ||
| Colorectum (HTA11) |  | AD: Adenomas |
| SER: Sessile serrated lesions | ||
| MSI-H: Microsatellite-high colorectal cancer | ||
| MSS: Microsatellite stable colorectal cancer | ||
| Esophagus | 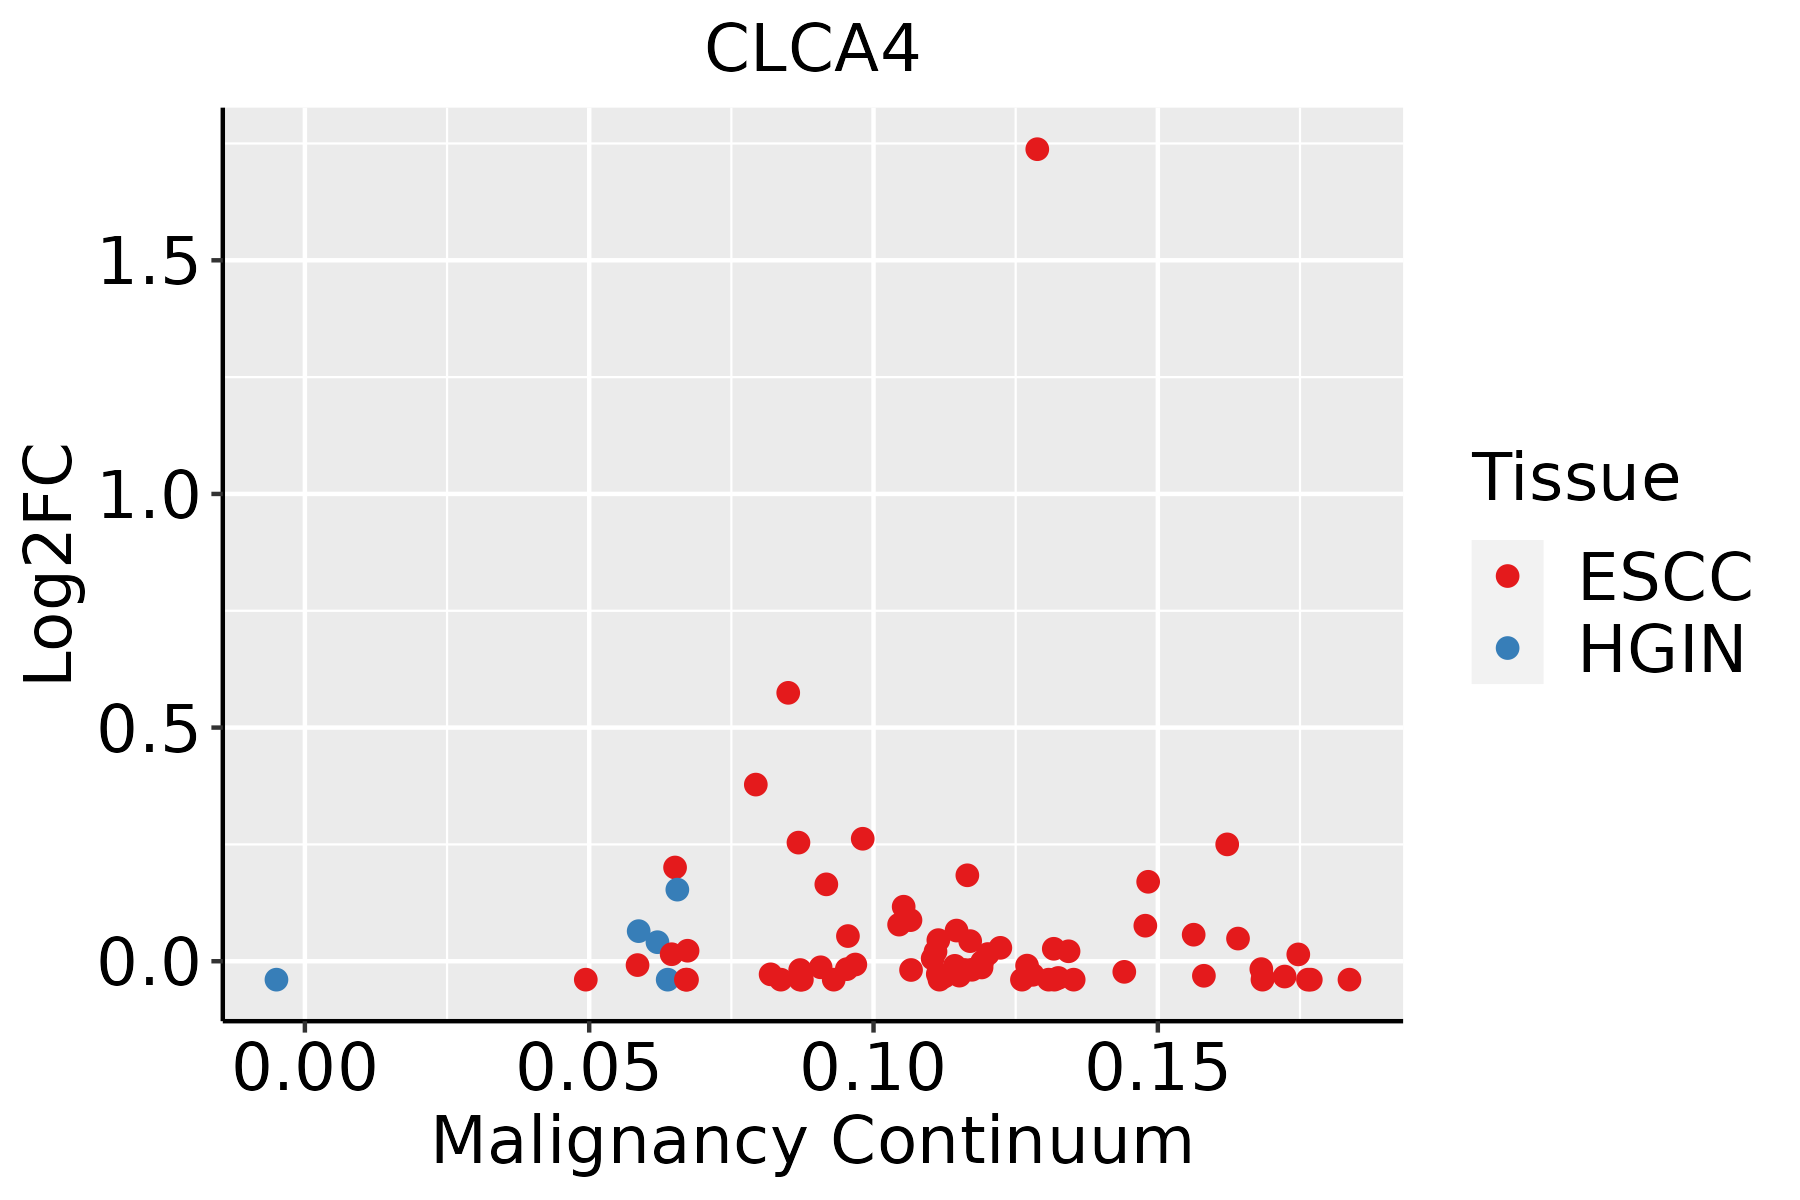 | ESCC: Esophageal squamous cell carcinoma |
| HGIN: High-grade intraepithelial neoplasias | ||
| LGIN: Low-grade intraepithelial neoplasias |
| ∗log2FC in expression of this searched gene in stem-like cells from each diseased tissue sample relative to stem-like cells in normal samples in each tissue plotted against the malignancy continuum. Samples are colored based on if they are from different disease stage. |
Top |
Malignant transformation related pathway analysis |
| Find out the enriched GO biological processes and KEGG pathways involved in transition from healthy to precancer to cancer |
| Tissue | Disease Stage | Enriched GO biological Processes |
| Colorectum | AD |  |
| Colorectum | SER |  |
| Colorectum | MSS |  |
| Colorectum | MSI-H |  |
| Colorectum | FAP |  |
| ∗Top 15 enriched GO BP terms are showed in the bar plot of each disease state in each tissue. Each row represents a significant GO biological process which is colored according to the -log10(p.adjust). |
| Page: 1 2 3 4 5 6 7 8 9 |
| GO ID | Tissue | Disease Stage | Description | Gene Ratio | Bg Ratio | pvalue | p.adjust | Count |
| GO:0015698 | Colorectum | AD | inorganic anion transport | 52/3918 | 180/18723 | 6.83e-03 | 4.22e-02 | 52 |
| GO:00156981 | Colorectum | FAP | inorganic anion transport | 38/2622 | 180/18723 | 5.73e-03 | 3.67e-02 | 38 |
| Page: 1 |
| Pathway ID | Tissue | Disease Stage | Description | Gene Ratio | Bg Ratio | pvalue | p.adjust | qvalue | Count |
| hsa04972 | Colorectum | AD | Pancreatic secretion | 36/2092 | 102/8465 | 1.06e-02 | 3.98e-02 | 2.54e-02 | 36 |
| hsa049721 | Colorectum | AD | Pancreatic secretion | 36/2092 | 102/8465 | 1.06e-02 | 3.98e-02 | 2.54e-02 | 36 |
| hsa049722 | Colorectum | SER | Pancreatic secretion | 30/1580 | 102/8465 | 5.41e-03 | 3.28e-02 | 2.38e-02 | 30 |
| hsa049723 | Colorectum | SER | Pancreatic secretion | 30/1580 | 102/8465 | 5.41e-03 | 3.28e-02 | 2.38e-02 | 30 |
| hsa049724 | Colorectum | MSS | Pancreatic secretion | 33/1875 | 102/8465 | 1.09e-02 | 3.75e-02 | 2.30e-02 | 33 |
| hsa049725 | Colorectum | MSS | Pancreatic secretion | 33/1875 | 102/8465 | 1.09e-02 | 3.75e-02 | 2.30e-02 | 33 |
| hsa049726 | Colorectum | FAP | Pancreatic secretion | 34/1404 | 102/8465 | 2.43e-05 | 2.78e-04 | 1.69e-04 | 34 |
| hsa049727 | Colorectum | FAP | Pancreatic secretion | 34/1404 | 102/8465 | 2.43e-05 | 2.78e-04 | 1.69e-04 | 34 |
| hsa049728 | Colorectum | CRC | Pancreatic secretion | 32/1091 | 102/8465 | 7.86e-07 | 4.37e-05 | 2.96e-05 | 32 |
| hsa049729 | Colorectum | CRC | Pancreatic secretion | 32/1091 | 102/8465 | 7.86e-07 | 4.37e-05 | 2.96e-05 | 32 |
| Page: 1 |
Top |
Cell-cell communication analysis |
| Identification of potential cell-cell interactions between two cell types and their ligand-receptor pairs for different disease states |
| Ligand | Receptor | LRpair | Pathway | Tissue | Disease Stage |
| Page: 1 |
Top |
Single-cell gene regulatory network inference analysis |
| Find out the significant the regulons (TFs) and the target genes of each regulon across cell types for different disease states |
| TF | Cell Type | Tissue | Disease Stage | Target Gene | RSS | Regulon Activity |
| ∗The dot plots of a searched regulon are shown for all cell subpopulations in each disease state of each tissue based on the regulon specific score inferred using pySCENIC and by calculating the average expression. |
| Page: 1 |
Top |
Somatic mutation of malignant transformation related genes |
| Annotation of somatic variants for genes involved in malignant transformation |
| Hugo Symbol | Variant Class | Variant Classification | dbSNP RS | HGVSc | HGVSp | HGVSp Short | SWISSPROT | BIOTYPE | SIFT | PolyPhen | Tumor Sample Barcode | Tissue | Histology | Sex | Age | Stage | Therapy Types | Drugs | Outcome |
| CLCA4 | SNV | Missense_Mutation | c.1724N>G | p.Pro575Arg | p.P575R | Q14CN2 | protein_coding | tolerated(0.12) | benign(0.374) | TCGA-A1-A0SI-01 | Breast | breast invasive carcinoma | Female | <65 | I/II | Unknown | Unknown | SD | |
| CLCA4 | SNV | Missense_Mutation | novel | c.2317N>G | p.Thr773Ala | p.T773A | Q14CN2 | protein_coding | deleterious(0.02) | probably_damaging(0.927) | TCGA-A2-A4RX-01 | Breast | breast invasive carcinoma | Female | >=65 | I/II | Unknown | Unknown | SD |
| CLCA4 | SNV | Missense_Mutation | novel | c.16N>T | p.Gly6Cys | p.G6C | Q14CN2 | protein_coding | deleterious(0.04) | possibly_damaging(0.552) | TCGA-BH-A18T-01 | Breast | breast invasive carcinoma | Female | >=65 | I/II | Unknown | Unknown | PD |
| CLCA4 | SNV | Missense_Mutation | c.2218G>T | p.Val740Leu | p.V740L | Q14CN2 | protein_coding | tolerated(0.05) | benign(0.175) | TCGA-E2-A1L7-01 | Breast | breast invasive carcinoma | Female | <65 | III/IV | Chemotherapy | cyclophosphamide | PD | |
| CLCA4 | insertion | Frame_Shift_Ins | novel | c.534_535insACGACACACACACACA | p.Ser179ThrfsTer21 | p.S179Tfs*21 | Q14CN2 | protein_coding | TCGA-A8-A07J-01 | Breast | breast invasive carcinoma | Female | <65 | I/II | Chemotherapy | 5-fluorouracil | CR | ||
| CLCA4 | insertion | Frame_Shift_Ins | novel | c.535_536insGGTG | p.Ser179TrpfsTer17 | p.S179Wfs*17 | Q14CN2 | protein_coding | TCGA-A8-A07J-01 | Breast | breast invasive carcinoma | Female | <65 | I/II | Chemotherapy | 5-fluorouracil | CR | ||
| CLCA4 | SNV | Missense_Mutation | c.1957N>C | p.Asp653His | p.D653H | Q14CN2 | protein_coding | deleterious(0) | probably_damaging(1) | TCGA-DR-A0ZM-01 | Cervix | cervical & endocervical cancer | Female | <65 | III/IV | Unspecific | Cisplatin | SD | |
| CLCA4 | SNV | Missense_Mutation | c.1262C>A | p.Ser421Tyr | p.S421Y | Q14CN2 | protein_coding | deleterious(0) | possibly_damaging(0.903) | TCGA-FU-A3HZ-01 | Cervix | cervical & endocervical cancer | Female | <65 | I/II | Chemotherapy | cisplatin | CR | |
| CLCA4 | SNV | Missense_Mutation | novel | c.2614N>T | p.Pro872Ser | p.P872S | Q14CN2 | protein_coding | deleterious(0.02) | benign(0.03) | TCGA-VS-A9V5-01 | Cervix | cervical & endocervical cancer | Female | <65 | I/II | Chemotherapy | carboplatin | PD |
| CLCA4 | SNV | Missense_Mutation | c.931C>A | p.Leu311Ile | p.L311I | Q14CN2 | protein_coding | deleterious(0.02) | probably_damaging(0.999) | TCGA-AA-3510-01 | Colorectum | colon adenocarcinoma | Male | >=65 | I/II | Unknown | Unknown | SD |
| Page: 1 2 3 4 5 6 7 8 9 10 11 12 13 14 |
Top |
Related drugs of malignant transformation related genes |
| Identification of chemicals and drugs interact with genes involved in malignant transfromation |
| (DGIdb 4.0) |
| Entrez ID | Symbol | Category | Interaction Types | Drug Claim Name | Drug Name | PMIDs |
| Page: 1 |

Copyright 2023-Present -The University of Texas Health Science Center at Houston |