
|
|||||
|
 | |
| |
| |
| |
| |
| |
|
Gene: CLCA2 |
Gene summary for CLCA2 |
| Gene information | Species | Human | Gene symbol | CLCA2 | Gene ID | 9635 |
| Gene name | chloride channel accessory 2 | |
| Gene Alias | CACC | |
| Cytomap | 1p22.3 | |
| Gene Type | protein-coding | GO ID | GO:0006508 | UniProtAcc | Q9UQC9 |
Top |
Malignant transformation analysis |
| Identification of the aberrant gene expression in precancerous and cancerous lesions by comparing the gene expression of stem-like cells in diseased tissues with normal stem cells |
| Entrez ID | Symbol | Replicates | Species | Organ | Tissue | Adj P-value | Log2FC | Malignancy |
| 9635 | CLCA2 | CA_HPV_1 | Human | Cervix | CC | 4.77e-06 | -2.41e-01 | 0.0264 |
| 9635 | CLCA2 | HSIL_HPV_1 | Human | Cervix | HSIL_HPV | 1.84e-04 | -2.59e-01 | 0.0116 |
| 9635 | CLCA2 | HSIL_HPV_2 | Human | Cervix | HSIL_HPV | 2.84e-03 | -2.30e-01 | 0.0208 |
| 9635 | CLCA2 | Tumor | Human | Cervix | CC | 1.38e-43 | 8.95e-01 | 0.1241 |
| 9635 | CLCA2 | sample3 | Human | Cervix | CC | 1.61e-45 | 8.28e-01 | 0.1387 |
| 9635 | CLCA2 | H2 | Human | Cervix | HSIL_HPV | 2.46e-04 | -2.41e-01 | 0.0632 |
| 9635 | CLCA2 | T1 | Human | Cervix | CC | 3.99e-08 | -2.68e-01 | 0.0918 |
| 9635 | CLCA2 | T3 | Human | Cervix | CC | 2.79e-44 | 8.11e-01 | 0.1389 |
| 9635 | CLCA2 | LZE4T | Human | Esophagus | ESCC | 2.36e-08 | 5.50e-01 | 0.0811 |
| 9635 | CLCA2 | LZE7T | Human | Esophagus | ESCC | 7.18e-05 | 1.53e+00 | 0.0667 |
| 9635 | CLCA2 | P1T-E | Human | Esophagus | ESCC | 1.87e-02 | 7.90e-01 | 0.0875 |
| 9635 | CLCA2 | P4T-E | Human | Esophagus | ESCC | 1.26e-04 | 2.69e-01 | 0.1323 |
| 9635 | CLCA2 | P5T-E | Human | Esophagus | ESCC | 3.67e-10 | 4.04e-01 | 0.1327 |
| 9635 | CLCA2 | P8T-E | Human | Esophagus | ESCC | 1.60e-03 | -2.84e-01 | 0.0889 |
| 9635 | CLCA2 | P9T-E | Human | Esophagus | ESCC | 4.27e-15 | 5.76e-01 | 0.1131 |
| 9635 | CLCA2 | P10T-E | Human | Esophagus | ESCC | 9.32e-17 | 5.77e-01 | 0.116 |
| 9635 | CLCA2 | P11T-E | Human | Esophagus | ESCC | 4.64e-10 | 1.54e+00 | 0.1426 |
| 9635 | CLCA2 | P12T-E | Human | Esophagus | ESCC | 4.30e-37 | 1.82e+00 | 0.1122 |
| 9635 | CLCA2 | P15T-E | Human | Esophagus | ESCC | 1.51e-14 | 7.79e-01 | 0.1149 |
| 9635 | CLCA2 | P16T-E | Human | Esophagus | ESCC | 6.61e-09 | -4.83e-02 | 0.1153 |
| Page: 1 2 3 4 5 |
| Tissue | Expression Dynamics | Abbreviation |
| Cervix | 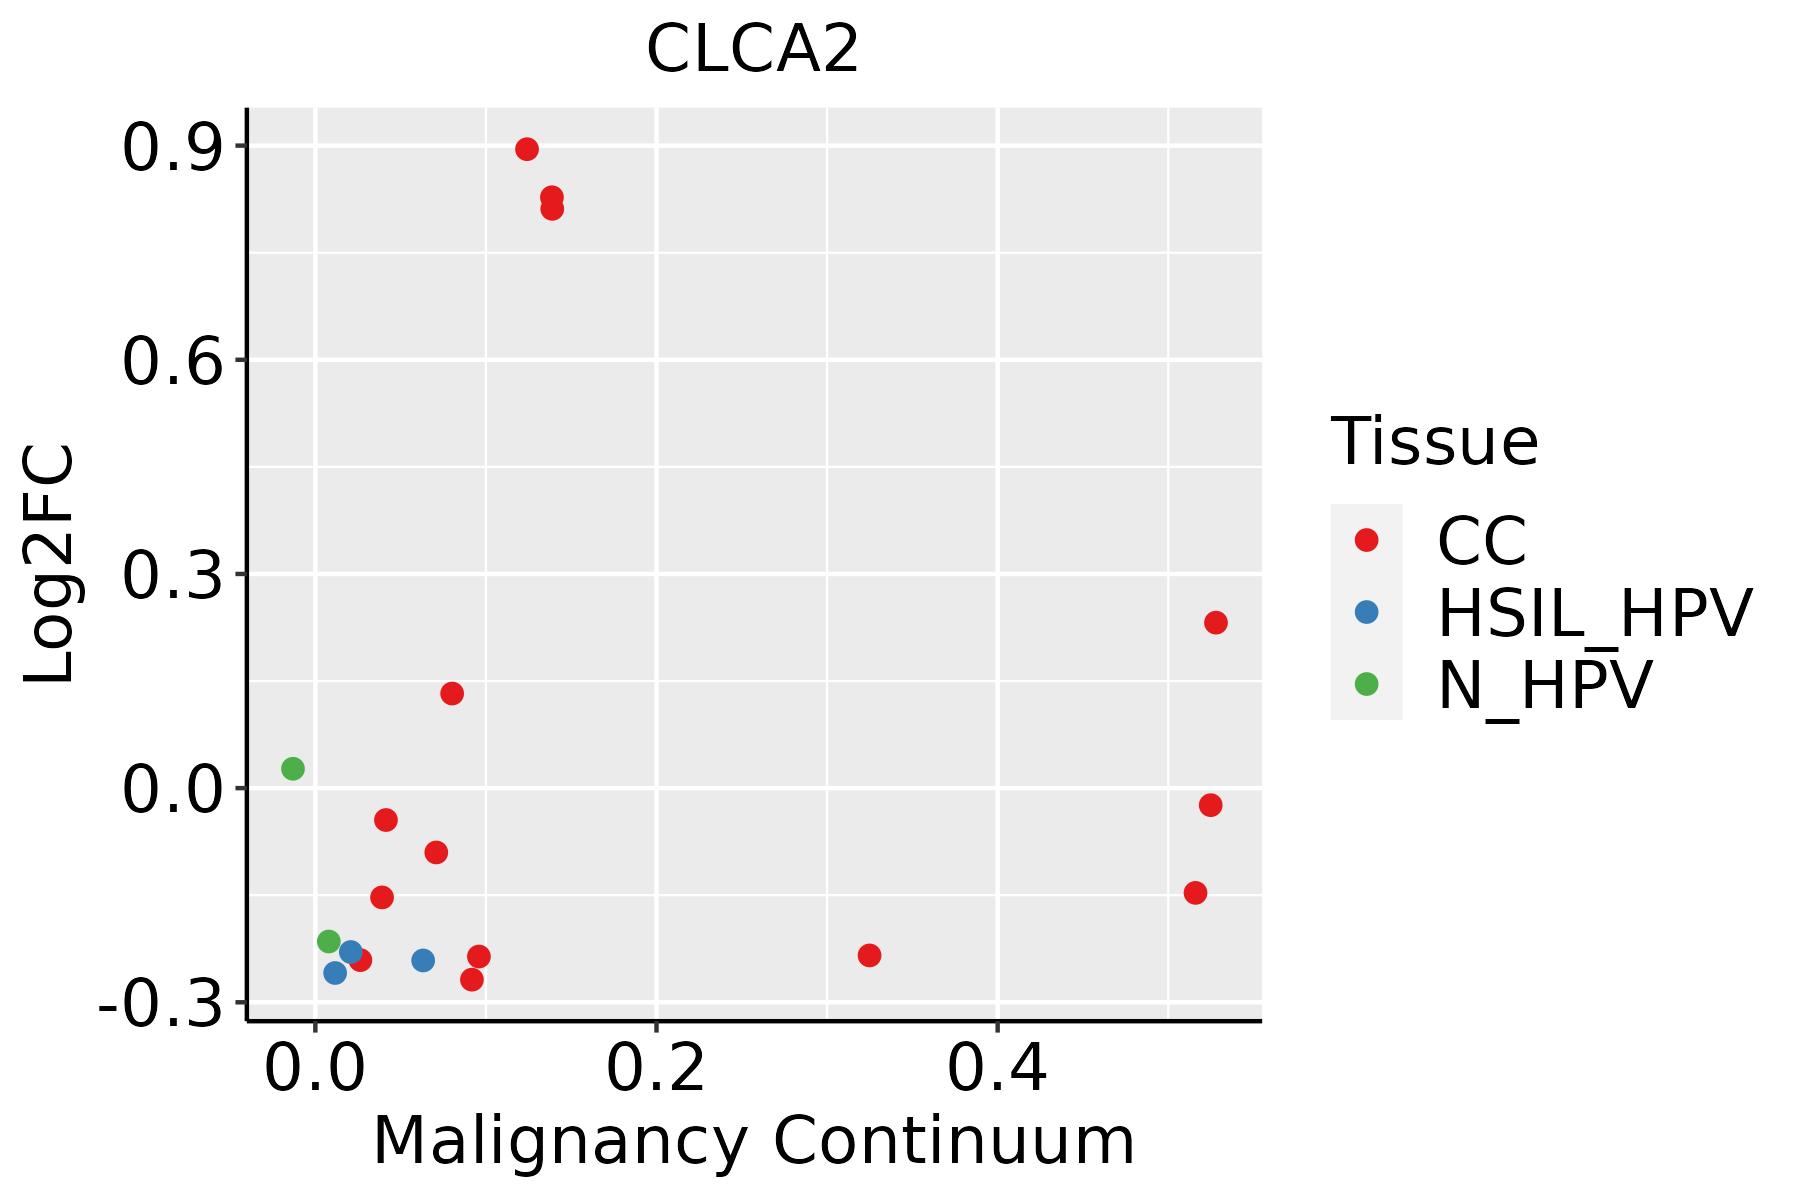 | CC: Cervix cancer |
| HSIL_HPV: HPV-infected high-grade squamous intraepithelial lesions | ||
| N_HPV: HPV-infected normal cervix | ||
| Esophagus | 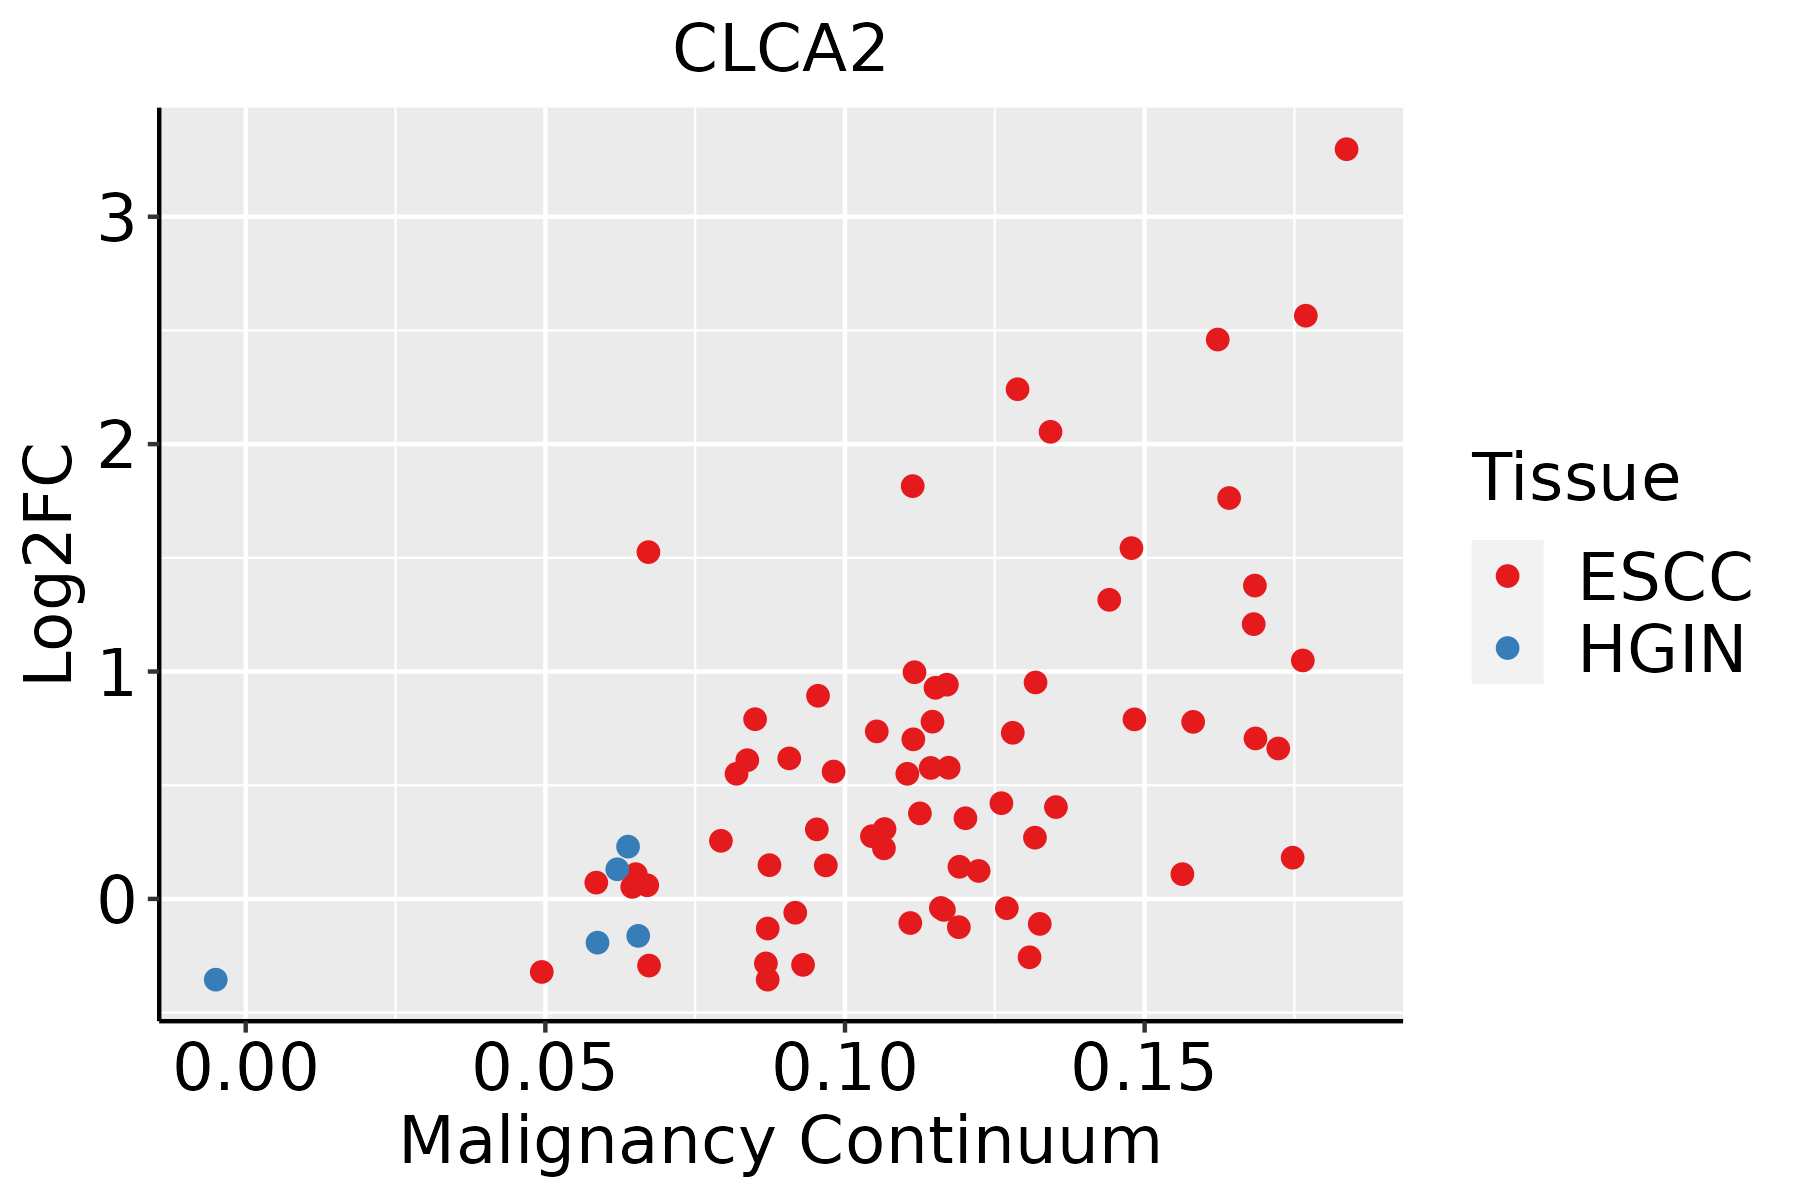 | ESCC: Esophageal squamous cell carcinoma |
| HGIN: High-grade intraepithelial neoplasias | ||
| LGIN: Low-grade intraepithelial neoplasias | ||
| Oral Cavity | 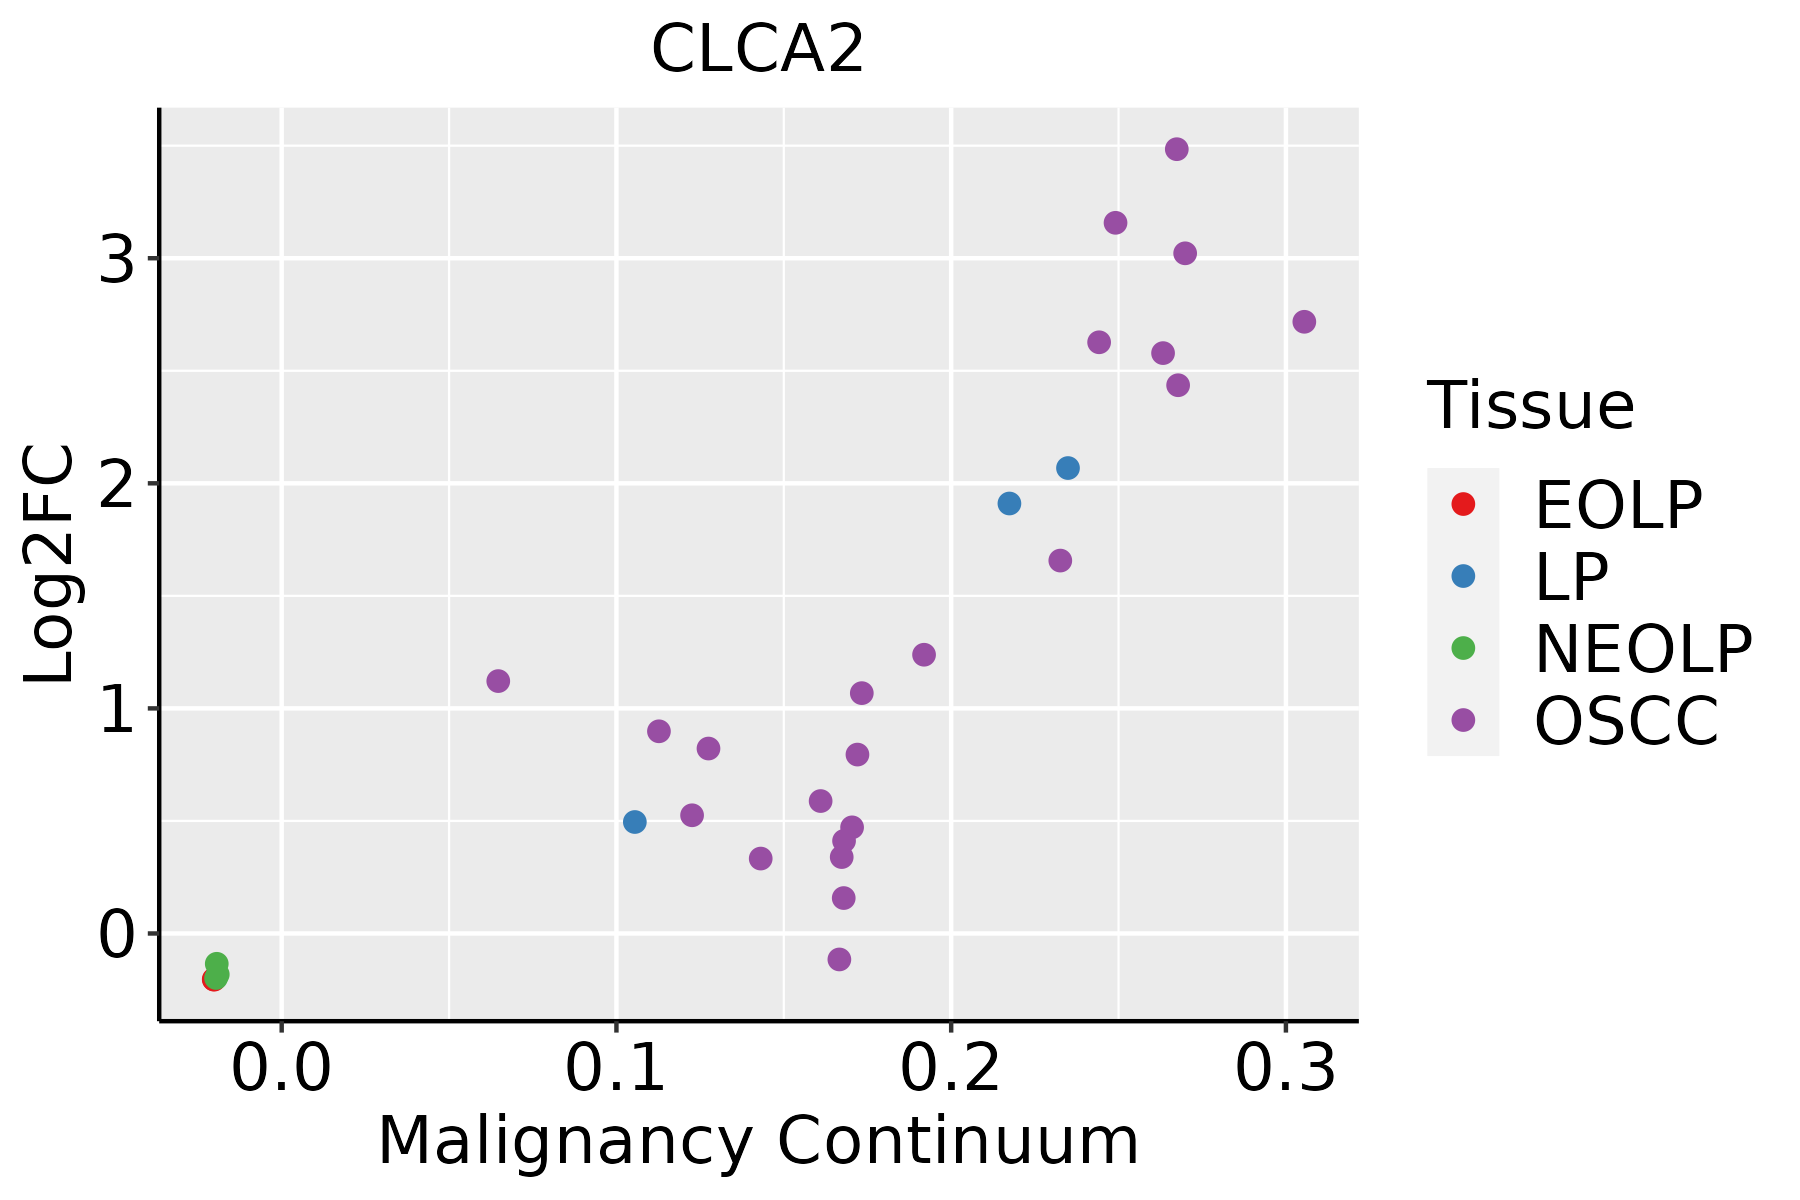 | EOLP: Erosive Oral lichen planus |
| LP: leukoplakia | ||
| NEOLP: Non-erosive oral lichen planus | ||
| OSCC: Oral squamous cell carcinoma | ||
| Skin | 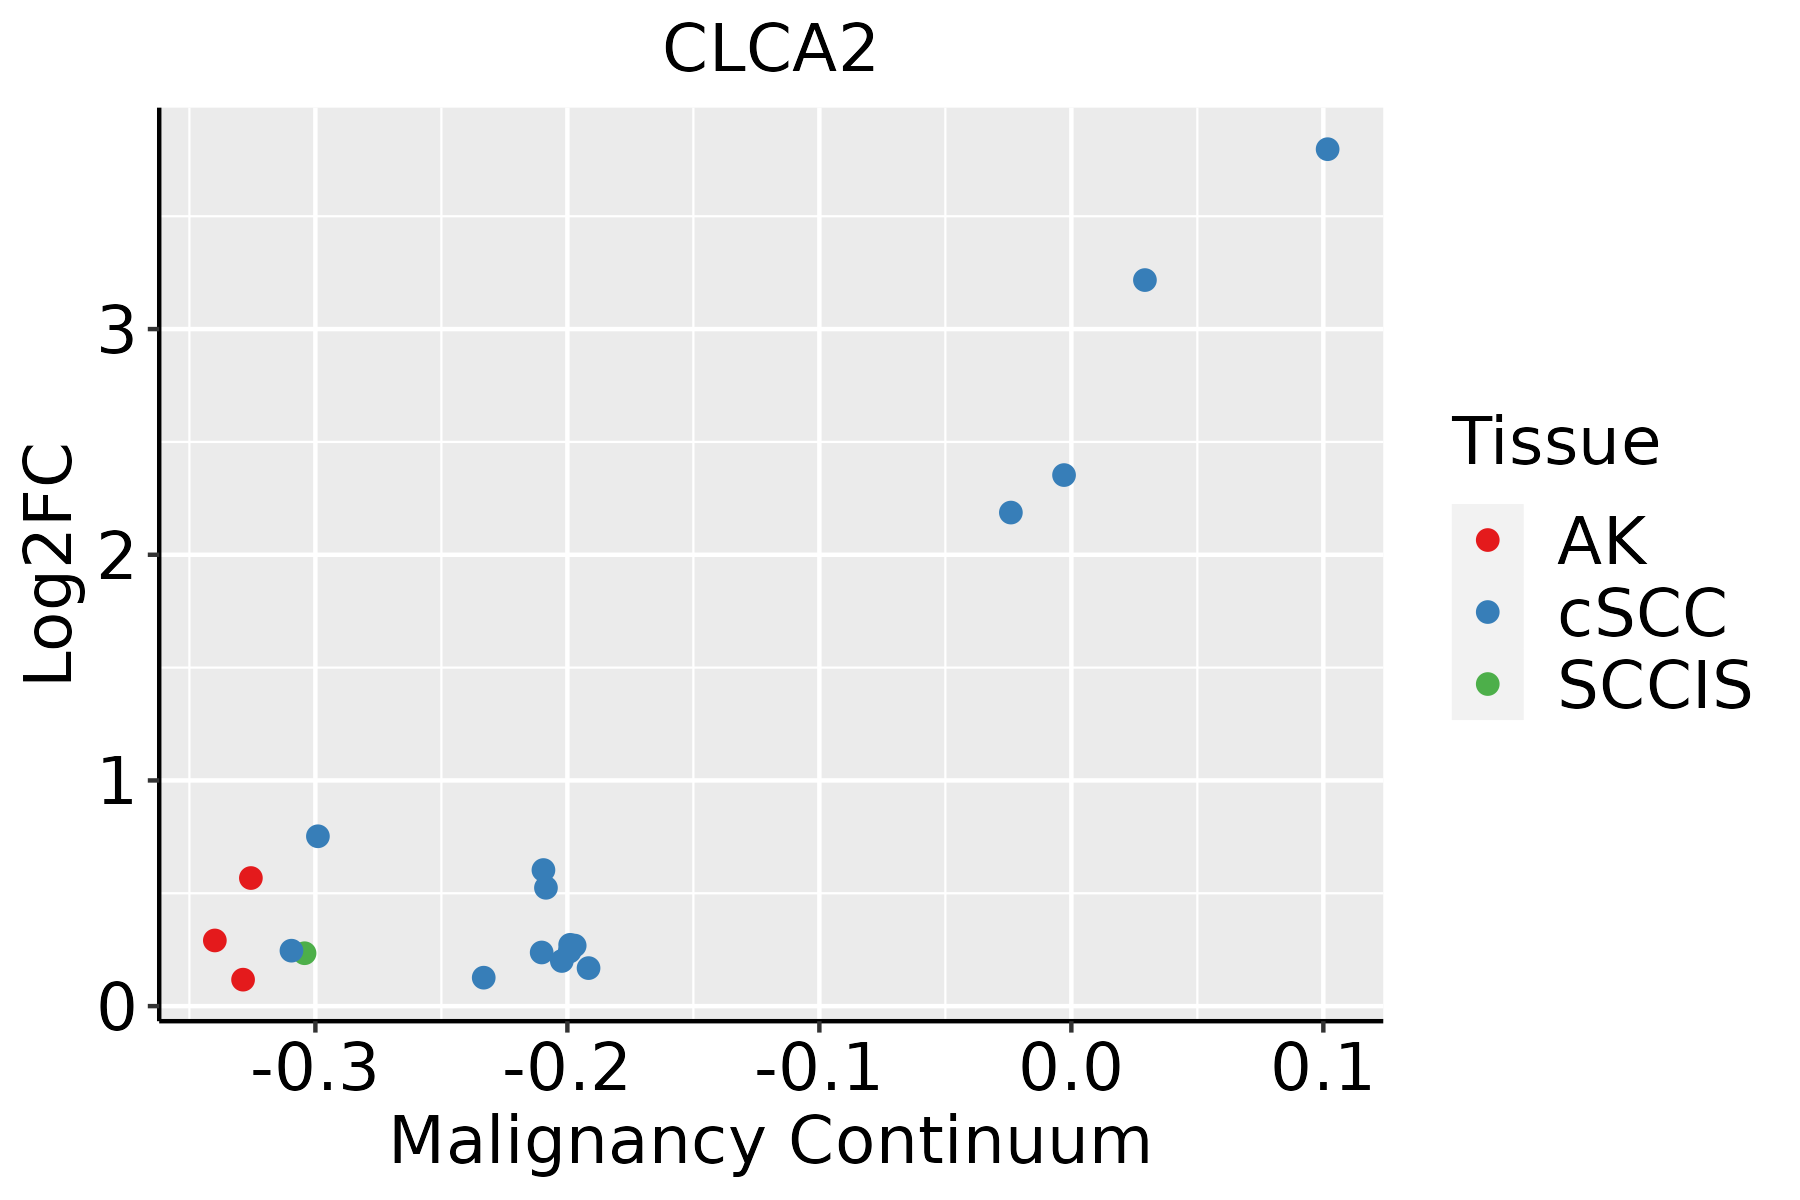 | AK: Actinic keratosis |
| cSCC: Cutaneous squamous cell carcinoma | ||
| SCCIS:squamous cell carcinoma in situ |
| ∗log2FC in expression of this searched gene in stem-like cells from each diseased tissue sample relative to stem-like cells in normal samples in each tissue plotted against the malignancy continuum. Samples are colored based on if they are from different disease stage. |
Top |
Malignant transformation related pathway analysis |
| Find out the enriched GO biological processes and KEGG pathways involved in transition from healthy to precancer to cancer |
| Tissue | Disease Stage | Enriched GO biological Processes |
| Colorectum | AD |  |
| Colorectum | SER |  |
| Colorectum | MSS |  |
| Colorectum | MSI-H |  |
| Colorectum | FAP |  |
| ∗Top 15 enriched GO BP terms are showed in the bar plot of each disease state in each tissue. Each row represents a significant GO biological process which is colored according to the -log10(p.adjust). |
| Page: 1 2 3 4 5 6 7 8 9 |
| GO ID | Tissue | Disease Stage | Description | Gene Ratio | Bg Ratio | pvalue | p.adjust | Count |
| Page: 1 |
| Pathway ID | Tissue | Disease Stage | Description | Gene Ratio | Bg Ratio | pvalue | p.adjust | qvalue | Count |
| Page: 1 |
Top |
Cell-cell communication analysis |
| Identification of potential cell-cell interactions between two cell types and their ligand-receptor pairs for different disease states |
| Ligand | Receptor | LRpair | Pathway | Tissue | Disease Stage |
| Page: 1 |
Top |
Single-cell gene regulatory network inference analysis |
| Find out the significant the regulons (TFs) and the target genes of each regulon across cell types for different disease states |
| TF | Cell Type | Tissue | Disease Stage | Target Gene | RSS | Regulon Activity |
| ∗The dot plots of a searched regulon are shown for all cell subpopulations in each disease state of each tissue based on the regulon specific score inferred using pySCENIC and by calculating the average expression. |
| Page: 1 |
Top |
Somatic mutation of malignant transformation related genes |
| Annotation of somatic variants for genes involved in malignant transformation |
| Hugo Symbol | Variant Class | Variant Classification | dbSNP RS | HGVSc | HGVSp | HGVSp Short | SWISSPROT | BIOTYPE | SIFT | PolyPhen | Tumor Sample Barcode | Tissue | Histology | Sex | Age | Stage | Therapy Types | Drugs | Outcome |
| CLCA2 | SNV | Missense_Mutation | rs577301689 | c.398N>A | p.Gly133Glu | p.G133E | Q9UQC9 | protein_coding | deleterious(0.01) | probably_damaging(1) | TCGA-A8-A08Z-01 | Breast | breast invasive carcinoma | Female | >=65 | III/IV | Unknown | Unknown | SD |
| CLCA2 | SNV | Missense_Mutation | c.538G>A | p.Asp180Asn | p.D180N | Q9UQC9 | protein_coding | tolerated(0.07) | benign(0.042) | TCGA-AC-A23H-01 | Breast | breast invasive carcinoma | Female | >=65 | I/II | Unknown | Unknown | PD | |
| CLCA2 | SNV | Missense_Mutation | c.1869G>A | p.Met623Ile | p.M623I | Q9UQC9 | protein_coding | tolerated(1) | benign(0) | TCGA-AC-A23H-01 | Breast | breast invasive carcinoma | Female | >=65 | I/II | Unknown | Unknown | PD | |
| CLCA2 | SNV | Missense_Mutation | c.364G>A | p.Asp122Asn | p.D122N | Q9UQC9 | protein_coding | tolerated(0.05) | benign(0.277) | TCGA-C8-A26Y-01 | Breast | breast invasive carcinoma | Female | >=65 | I/II | Unknown | Unknown | SD | |
| CLCA2 | SNV | Missense_Mutation | c.335T>C | p.Ile112Thr | p.I112T | Q9UQC9 | protein_coding | deleterious(0.01) | possibly_damaging(0.636) | TCGA-D8-A1XQ-01 | Breast | breast invasive carcinoma | Female | >=65 | I/II | Unknown | Unknown | SD | |
| CLCA2 | insertion | Frame_Shift_Ins | novel | c.138_139insCT | p.Ile47LeufsTer19 | p.I47Lfs*19 | Q9UQC9 | protein_coding | TCGA-AO-A0JB-01 | Breast | breast invasive carcinoma | Female | <65 | III/IV | Chemotherapy | cyclophosphamide | SD | ||
| CLCA2 | insertion | In_Frame_Ins | novel | c.140_141insAGACTTCTGTGTTTC | p.Ile47_Asn48insAspPheCysValSer | p.I47_N48insDFCVS | Q9UQC9 | protein_coding | TCGA-AO-A0JB-01 | Breast | breast invasive carcinoma | Female | <65 | III/IV | Chemotherapy | cyclophosphamide | SD | ||
| CLCA2 | SNV | Missense_Mutation | novel | c.125G>A | p.Gly42Glu | p.G42E | Q9UQC9 | protein_coding | deleterious(0.03) | benign(0.04) | TCGA-2W-A8YY-01 | Cervix | cervical & endocervical cancer | Female | <65 | I/II | Chemotherapy | cisplatin | CR |
| CLCA2 | SNV | Missense_Mutation | c.391G>A | p.Gly131Arg | p.G131R | Q9UQC9 | protein_coding | tolerated(0.18) | probably_damaging(0.919) | TCGA-2W-A8YY-01 | Cervix | cervical & endocervical cancer | Female | <65 | I/II | Chemotherapy | cisplatin | CR | |
| CLCA2 | SNV | Missense_Mutation | novel | c.1943C>A | p.Thr648Asn | p.T648N | Q9UQC9 | protein_coding | tolerated(0.79) | benign(0.007) | TCGA-DS-A1OB-01 | Cervix | cervical & endocervical cancer | Female | <65 | I/II | Chemotherapy | carboplatin | PD |
| Page: 1 2 3 4 5 6 7 8 9 10 11 12 |
Top |
Related drugs of malignant transformation related genes |
| Identification of chemicals and drugs interact with genes involved in malignant transfromation |
| (DGIdb 4.0) |
| Entrez ID | Symbol | Category | Interaction Types | Drug Claim Name | Drug Name | PMIDs |
| Page: 1 |

Copyright 2023-Present -The University of Texas Health Science Center at Houston |