
|
|||||
|
 | |
| |
| |
| |
| |
| |
|
Gene: CLASRP |
Gene summary for CLASRP |
| Gene information | Species | Human | Gene symbol | CLASRP | Gene ID | 11129 |
| Gene name | CLK4 associating serine/arginine rich protein | |
| Gene Alias | CLASP | |
| Cytomap | 19q13.32 | |
| Gene Type | protein-coding | GO ID | GO:0006139 | UniProtAcc | Q8N2M8 |
Top |
Malignant transformation analysis |
| Identification of the aberrant gene expression in precancerous and cancerous lesions by comparing the gene expression of stem-like cells in diseased tissues with normal stem cells |
| Entrez ID | Symbol | Replicates | Species | Organ | Tissue | Adj P-value | Log2FC | Malignancy |
| 11129 | CLASRP | LZE4T | Human | Esophagus | ESCC | 1.31e-10 | 2.40e-01 | 0.0811 |
| 11129 | CLASRP | LZE7T | Human | Esophagus | ESCC | 1.53e-04 | 3.26e-01 | 0.0667 |
| 11129 | CLASRP | LZE20T | Human | Esophagus | ESCC | 4.72e-03 | 1.56e-01 | 0.0662 |
| 11129 | CLASRP | LZE22D1 | Human | Esophagus | HGIN | 3.82e-03 | 1.87e-01 | 0.0595 |
| 11129 | CLASRP | LZE22T | Human | Esophagus | ESCC | 2.70e-09 | 5.47e-01 | 0.068 |
| 11129 | CLASRP | LZE24T | Human | Esophagus | ESCC | 9.02e-14 | 4.40e-01 | 0.0596 |
| 11129 | CLASRP | LZE21T | Human | Esophagus | ESCC | 1.19e-05 | 2.82e-01 | 0.0655 |
| 11129 | CLASRP | P1T-E | Human | Esophagus | ESCC | 2.05e-18 | 7.70e-01 | 0.0875 |
| 11129 | CLASRP | P2T-E | Human | Esophagus | ESCC | 4.47e-25 | 4.93e-01 | 0.1177 |
| 11129 | CLASRP | P4T-E | Human | Esophagus | ESCC | 1.90e-12 | 3.38e-01 | 0.1323 |
| 11129 | CLASRP | P5T-E | Human | Esophagus | ESCC | 3.17e-19 | 3.52e-01 | 0.1327 |
| 11129 | CLASRP | P8T-E | Human | Esophagus | ESCC | 2.10e-61 | 1.13e+00 | 0.0889 |
| 11129 | CLASRP | P9T-E | Human | Esophagus | ESCC | 1.13e-03 | 2.45e-01 | 0.1131 |
| 11129 | CLASRP | P10T-E | Human | Esophagus | ESCC | 2.71e-54 | 1.07e+00 | 0.116 |
| 11129 | CLASRP | P11T-E | Human | Esophagus | ESCC | 3.65e-12 | 5.90e-01 | 0.1426 |
| 11129 | CLASRP | P12T-E | Human | Esophagus | ESCC | 3.43e-30 | 5.32e-01 | 0.1122 |
| 11129 | CLASRP | P15T-E | Human | Esophagus | ESCC | 1.18e-31 | 6.85e-01 | 0.1149 |
| 11129 | CLASRP | P16T-E | Human | Esophagus | ESCC | 1.09e-17 | 3.23e-01 | 0.1153 |
| 11129 | CLASRP | P17T-E | Human | Esophagus | ESCC | 7.61e-09 | 2.53e-01 | 0.1278 |
| 11129 | CLASRP | P19T-E | Human | Esophagus | ESCC | 1.97e-05 | 3.00e-01 | 0.1662 |
| Page: 1 2 3 4 5 |
| Tissue | Expression Dynamics | Abbreviation |
| Esophagus | 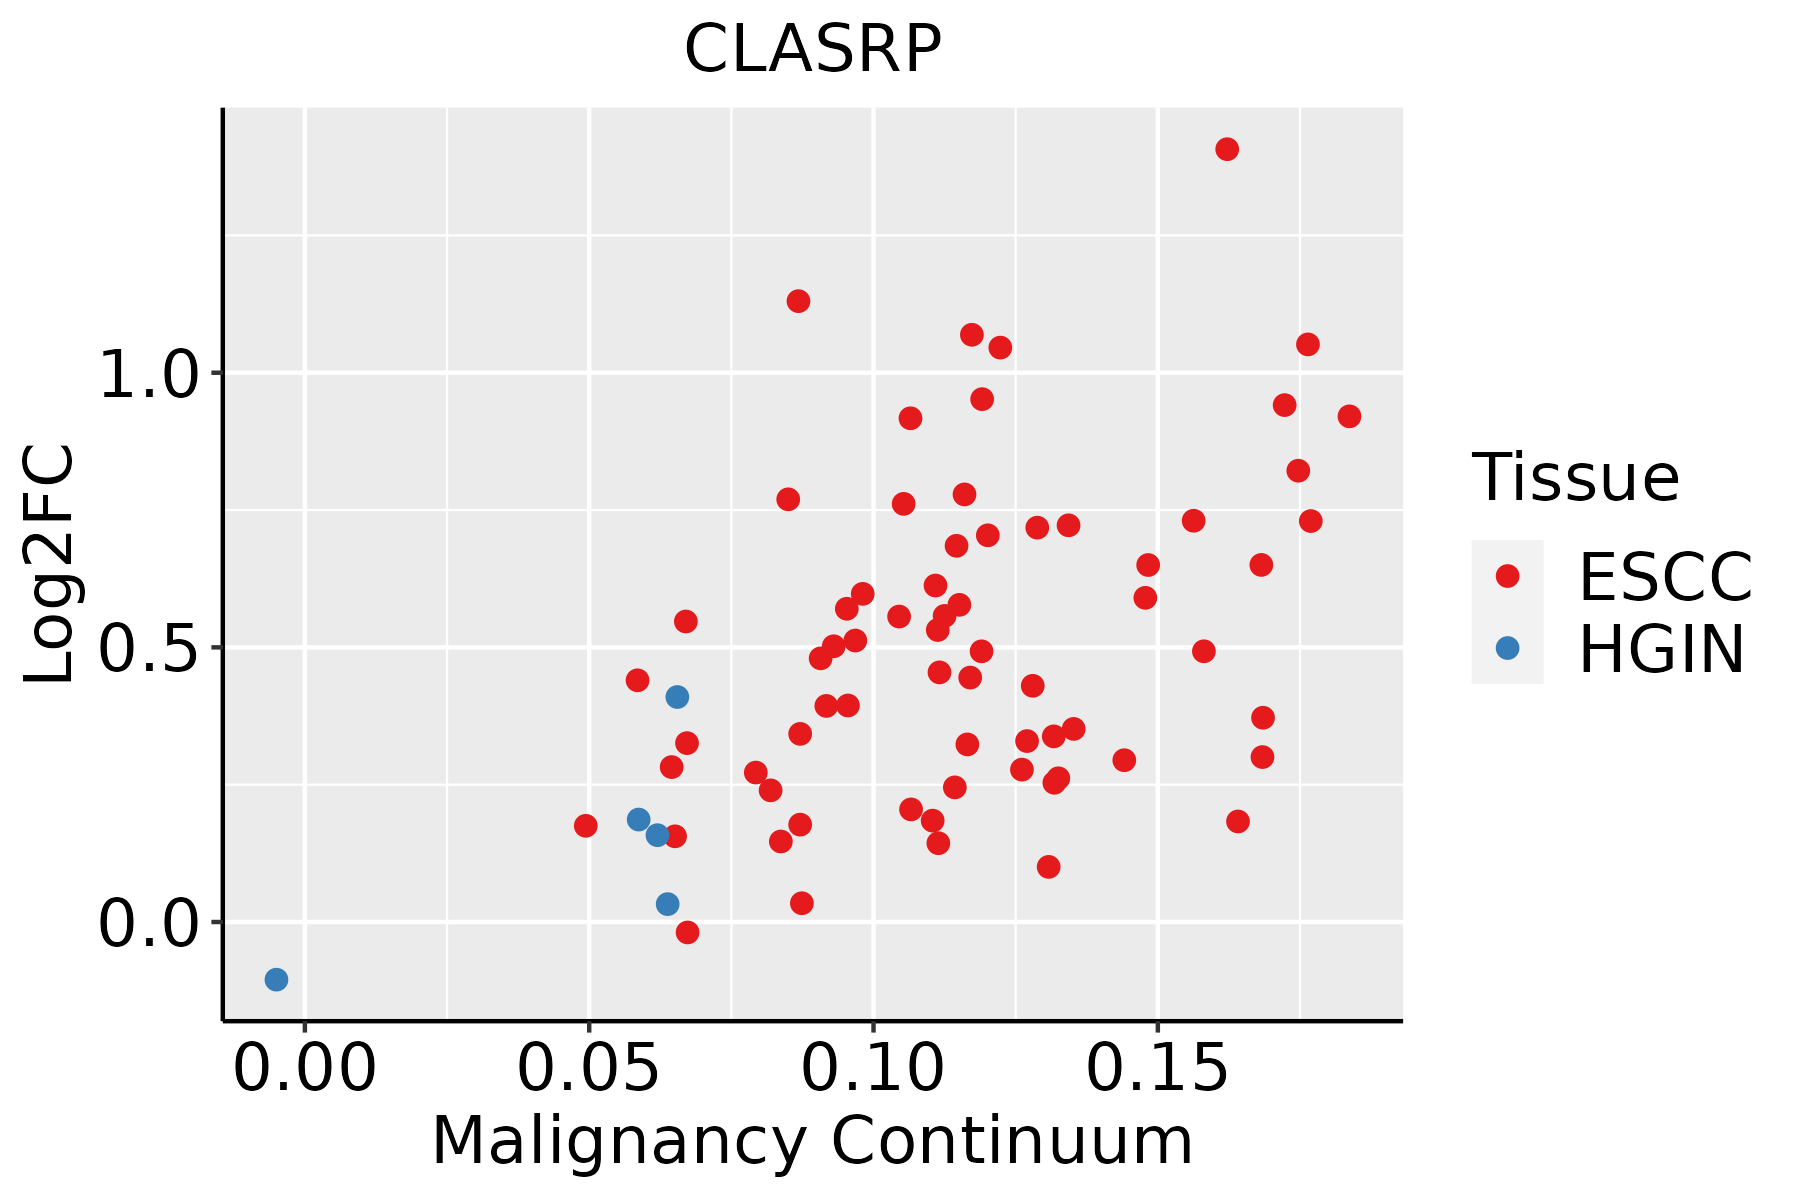 | ESCC: Esophageal squamous cell carcinoma |
| HGIN: High-grade intraepithelial neoplasias | ||
| LGIN: Low-grade intraepithelial neoplasias | ||
| Oral Cavity |  | EOLP: Erosive Oral lichen planus |
| LP: leukoplakia | ||
| NEOLP: Non-erosive oral lichen planus | ||
| OSCC: Oral squamous cell carcinoma |
| ∗log2FC in expression of this searched gene in stem-like cells from each diseased tissue sample relative to stem-like cells in normal samples in each tissue plotted against the malignancy continuum. Samples are colored based on if they are from different disease stage. |
Top |
Malignant transformation related pathway analysis |
| Find out the enriched GO biological processes and KEGG pathways involved in transition from healthy to precancer to cancer |
| Tissue | Disease Stage | Enriched GO biological Processes |
| Colorectum | AD |  |
| Colorectum | SER |  |
| Colorectum | MSS |  |
| Colorectum | MSI-H |  |
| Colorectum | FAP |  |
| ∗Top 15 enriched GO BP terms are showed in the bar plot of each disease state in each tissue. Each row represents a significant GO biological process which is colored according to the -log10(p.adjust). |
| Page: 1 2 3 4 5 6 7 8 9 |
| GO ID | Tissue | Disease Stage | Description | Gene Ratio | Bg Ratio | pvalue | p.adjust | Count |
| GO:000838026 | Esophagus | HGIN | RNA splicing | 160/2587 | 434/18723 | 3.74e-34 | 1.12e-30 | 160 |
| GO:0008380111 | Esophagus | ESCC | RNA splicing | 336/8552 | 434/18723 | 1.74e-42 | 3.67e-39 | 336 |
| GO:000838020 | Oral cavity | OSCC | RNA splicing | 308/7305 | 434/18723 | 2.43e-42 | 7.70e-39 | 308 |
| GO:0008380110 | Oral cavity | LP | RNA splicing | 237/4623 | 434/18723 | 1.82e-41 | 3.79e-38 | 237 |
| GO:000838025 | Oral cavity | EOLP | RNA splicing | 115/2218 | 434/18723 | 2.24e-17 | 3.04e-14 | 115 |
| Page: 1 |
| Pathway ID | Tissue | Disease Stage | Description | Gene Ratio | Bg Ratio | pvalue | p.adjust | qvalue | Count |
| Page: 1 |
Top |
Cell-cell communication analysis |
| Identification of potential cell-cell interactions between two cell types and their ligand-receptor pairs for different disease states |
| Ligand | Receptor | LRpair | Pathway | Tissue | Disease Stage |
| Page: 1 |
Top |
Single-cell gene regulatory network inference analysis |
| Find out the significant the regulons (TFs) and the target genes of each regulon across cell types for different disease states |
| TF | Cell Type | Tissue | Disease Stage | Target Gene | RSS | Regulon Activity |
| ∗The dot plots of a searched regulon are shown for all cell subpopulations in each disease state of each tissue based on the regulon specific score inferred using pySCENIC and by calculating the average expression. |
| Page: 1 |
Top |
Somatic mutation of malignant transformation related genes |
| Annotation of somatic variants for genes involved in malignant transformation |
| Hugo Symbol | Variant Class | Variant Classification | dbSNP RS | HGVSc | HGVSp | HGVSp Short | SWISSPROT | BIOTYPE | SIFT | PolyPhen | Tumor Sample Barcode | Tissue | Histology | Sex | Age | Stage | Therapy Types | Drugs | Outcome |
| CLASRP | SNV | Missense_Mutation | novel | c.1154N>T | p.Ser385Phe | p.S385F | protein_coding | deleterious_low_confidence(0.01) | benign(0) | TCGA-5L-AAT1-01 | Breast | breast invasive carcinoma | Female | <65 | III/IV | Hormone Therapy | letrozol | SD | |
| CLASRP | SNV | Missense_Mutation | c.1142N>T | p.Ser381Phe | p.S381F | protein_coding | deleterious_low_confidence(0) | possibly_damaging(0.528) | TCGA-AC-A23H-01 | Breast | breast invasive carcinoma | Female | >=65 | I/II | Unknown | Unknown | PD | ||
| CLASRP | SNV | Missense_Mutation | c.1819N>A | p.Glu607Lys | p.E607K | protein_coding | deleterious(0.01) | benign(0.003) | TCGA-AR-A0TX-01 | Breast | breast invasive carcinoma | Female | <65 | I/II | Unknown | Unknown | SD | ||
| CLASRP | SNV | Missense_Mutation | c.1994N>T | p.Ser665Phe | p.S665F | protein_coding | deleterious_low_confidence(0) | benign(0) | TCGA-BH-A0DX-01 | Breast | breast invasive carcinoma | Female | <65 | I/II | Chemotherapy | taxotere | CR | ||
| CLASRP | insertion | Frame_Shift_Ins | rs758390677 | c.277_278insC | p.Leu96SerfsTer17 | p.L96Sfs*17 | protein_coding | TCGA-A8-A07R-01 | Breast | breast invasive carcinoma | Female | >=65 | III/IV | Ancillary | zoledronic | SD | |||
| CLASRP | deletion | Frame_Shift_Del | c.278delN | p.Pro95LeufsTer81 | p.P95Lfs*81 | protein_coding | TCGA-AN-A0AK-01 | Breast | breast invasive carcinoma | Female | >=65 | I/II | Unknown | Unknown | SD | ||||
| CLASRP | deletion | Frame_Shift_Del | novel | c.246delN | p.Arg83ValfsTer93 | p.R83Vfs*93 | protein_coding | TCGA-D8-A27V-01 | Breast | breast invasive carcinoma | Female | <65 | I/II | Hormone Therapy | tamoxiphen | SD | |||
| CLASRP | SNV | Missense_Mutation | novel | c.80N>A | p.Arg27Gln | p.R27Q | protein_coding | tolerated(0.16) | benign(0.066) | TCGA-2W-A8YY-01 | Cervix | cervical & endocervical cancer | Female | <65 | I/II | Chemotherapy | cisplatin | CR | |
| CLASRP | SNV | Missense_Mutation | novel | c.1202N>A | p.Arg401His | p.R401H | protein_coding | deleterious_low_confidence(0.01) | benign(0.251) | TCGA-2W-A8YY-01 | Cervix | cervical & endocervical cancer | Female | <65 | I/II | Chemotherapy | cisplatin | CR | |
| CLASRP | SNV | Missense_Mutation | c.1752G>C | p.Lys584Asn | p.K584N | protein_coding | deleterious(0.03) | probably_damaging(0.978) | TCGA-DS-A0VN-01 | Cervix | cervical & endocervical cancer | Female | <65 | I/II | Chemotherapy | cisplatin | SD |
| Page: 1 2 3 4 5 6 7 8 |
Top |
Related drugs of malignant transformation related genes |
| Identification of chemicals and drugs interact with genes involved in malignant transfromation |
| (DGIdb 4.0) |
| Entrez ID | Symbol | Category | Interaction Types | Drug Claim Name | Drug Name | PMIDs |
| Page: 1 |

Copyright 2023-Present -The University of Texas Health Science Center at Houston |