
|
|||||
|
 | |
| |
| |
| |
| |
| |
|
Gene: CLASP1 |
Gene summary for CLASP1 |
| Gene information | Species | Human | Gene symbol | CLASP1 | Gene ID | 23332 |
| Gene name | cytoplasmic linker associated protein 1 | |
| Gene Alias | MAST1 | |
| Cytomap | 2q14.2-q14.3 | |
| Gene Type | protein-coding | GO ID | GO:0000226 | UniProtAcc | Q7Z460 |
Top |
Malignant transformation analysis |
| Identification of the aberrant gene expression in precancerous and cancerous lesions by comparing the gene expression of stem-like cells in diseased tissues with normal stem cells |
| Entrez ID | Symbol | Replicates | Species | Organ | Tissue | Adj P-value | Log2FC | Malignancy |
| 23332 | CLASP1 | CCI_1 | Human | Cervix | CC | 3.12e-22 | 1.32e+00 | 0.528 |
| 23332 | CLASP1 | CCI_2 | Human | Cervix | CC | 9.62e-13 | 1.06e+00 | 0.5249 |
| 23332 | CLASP1 | CCI_3 | Human | Cervix | CC | 7.16e-33 | 1.55e+00 | 0.516 |
| 23332 | CLASP1 | AEH-subject1 | Human | Endometrium | AEH | 8.72e-16 | 4.48e-01 | -0.3059 |
| 23332 | CLASP1 | AEH-subject2 | Human | Endometrium | AEH | 2.66e-05 | 3.26e-01 | -0.2525 |
| 23332 | CLASP1 | AEH-subject3 | Human | Endometrium | AEH | 2.85e-05 | 2.89e-01 | -0.2576 |
| 23332 | CLASP1 | AEH-subject4 | Human | Endometrium | AEH | 7.79e-12 | 5.26e-01 | -0.2657 |
| 23332 | CLASP1 | AEH-subject5 | Human | Endometrium | AEH | 2.78e-09 | 4.21e-01 | -0.2953 |
| 23332 | CLASP1 | EEC-subject1 | Human | Endometrium | EEC | 2.06e-08 | 4.22e-01 | -0.2682 |
| 23332 | CLASP1 | EEC-subject2 | Human | Endometrium | EEC | 3.84e-09 | 3.98e-01 | -0.2607 |
| 23332 | CLASP1 | EEC-subject4 | Human | Endometrium | EEC | 5.47e-04 | 3.20e-01 | -0.2571 |
| 23332 | CLASP1 | EEC-subject5 | Human | Endometrium | EEC | 9.71e-11 | 4.36e-01 | -0.249 |
| 23332 | CLASP1 | GSM5276934 | Human | Endometrium | EEC | 1.88e-05 | -1.19e-01 | -0.0913 |
| 23332 | CLASP1 | GSM6177620_NYU_UCEC1_lib1_lib1 | Human | Endometrium | EEC | 2.56e-03 | 6.02e-04 | -0.1869 |
| 23332 | CLASP1 | GSM6177620_NYU_UCEC1_lib2_lib2 | Human | Endometrium | EEC | 6.19e-04 | -8.13e-02 | -0.1875 |
| 23332 | CLASP1 | GSM6177620_NYU_UCEC1_lib3_lib3 | Human | Endometrium | EEC | 1.28e-06 | -1.70e-02 | -0.1883 |
| 23332 | CLASP1 | GSM6177621_NYU_UCEC2_lib1_lib1 | Human | Endometrium | EEC | 5.04e-05 | -7.49e-03 | -0.1934 |
| 23332 | CLASP1 | GSM6177622_NYU_UCEC3_lib1_lib1 | Human | Endometrium | EEC | 2.33e-12 | -4.99e-03 | -0.1917 |
| 23332 | CLASP1 | GSM6177622_NYU_UCEC3_lib2_lib2 | Human | Endometrium | EEC | 4.83e-11 | -3.04e-02 | -0.1916 |
| 23332 | CLASP1 | LZE4T | Human | Esophagus | ESCC | 6.58e-19 | 5.32e-01 | 0.0811 |
| Page: 1 2 3 4 5 6 7 |
| Tissue | Expression Dynamics | Abbreviation |
| Cervix | 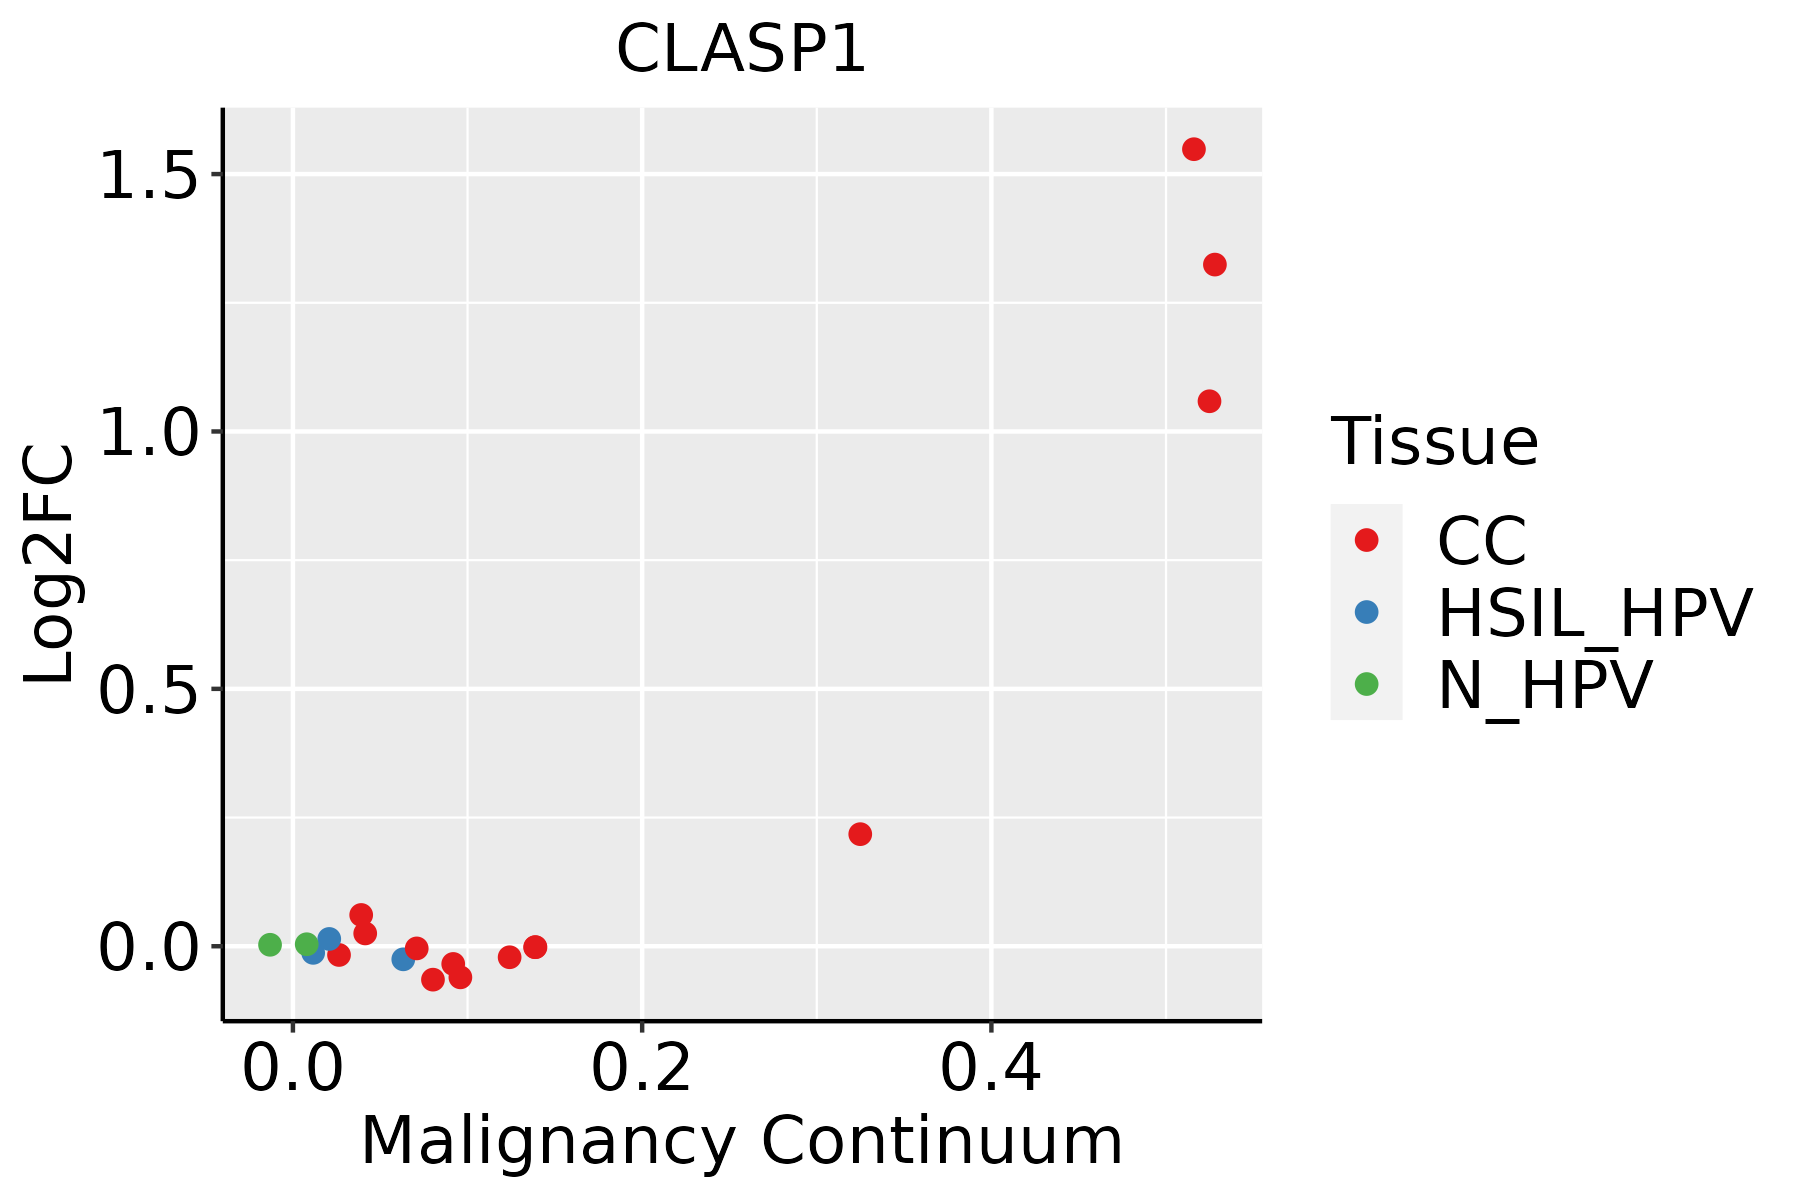 | CC: Cervix cancer |
| HSIL_HPV: HPV-infected high-grade squamous intraepithelial lesions | ||
| N_HPV: HPV-infected normal cervix | ||
| Endometrium |  | AEH: Atypical endometrial hyperplasia |
| EEC: Endometrioid Cancer | ||
| Esophagus | 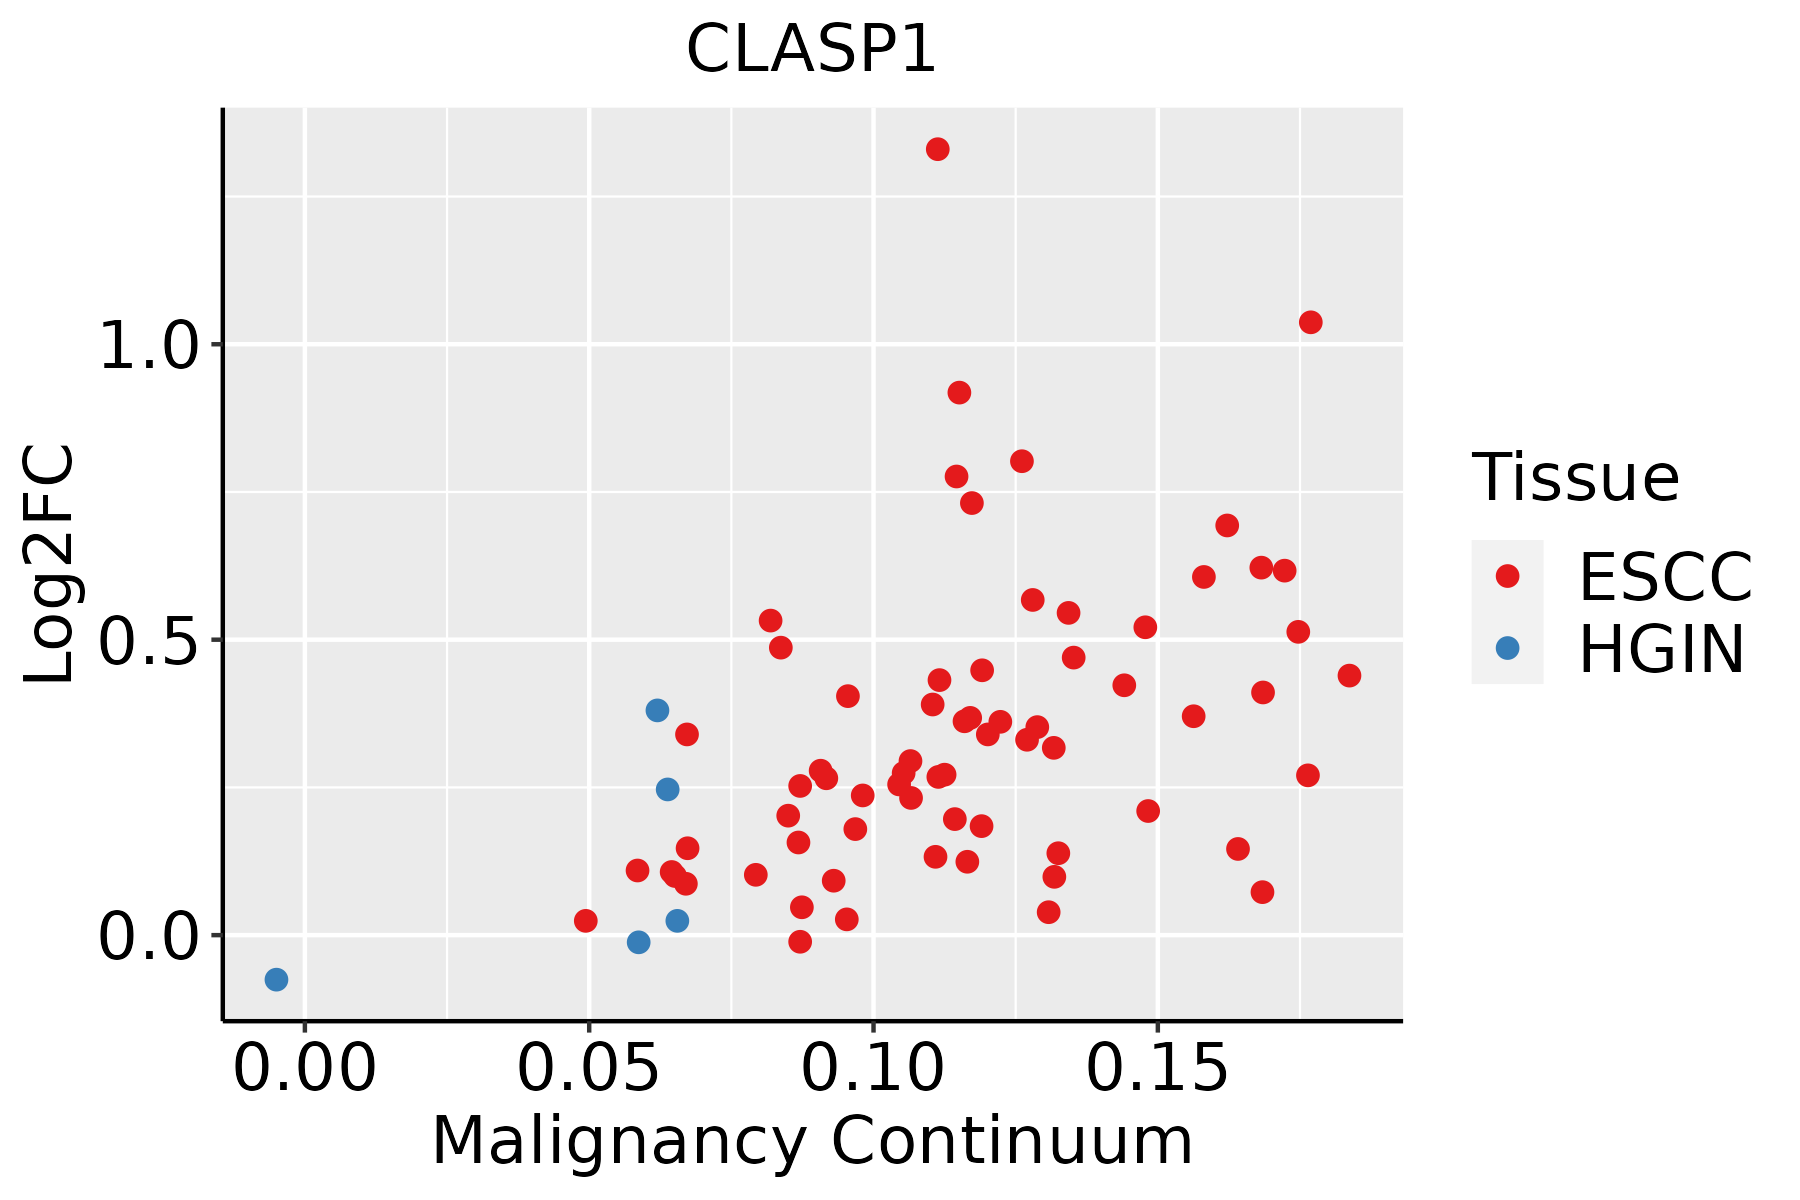 | ESCC: Esophageal squamous cell carcinoma |
| HGIN: High-grade intraepithelial neoplasias | ||
| LGIN: Low-grade intraepithelial neoplasias | ||
| Lung | 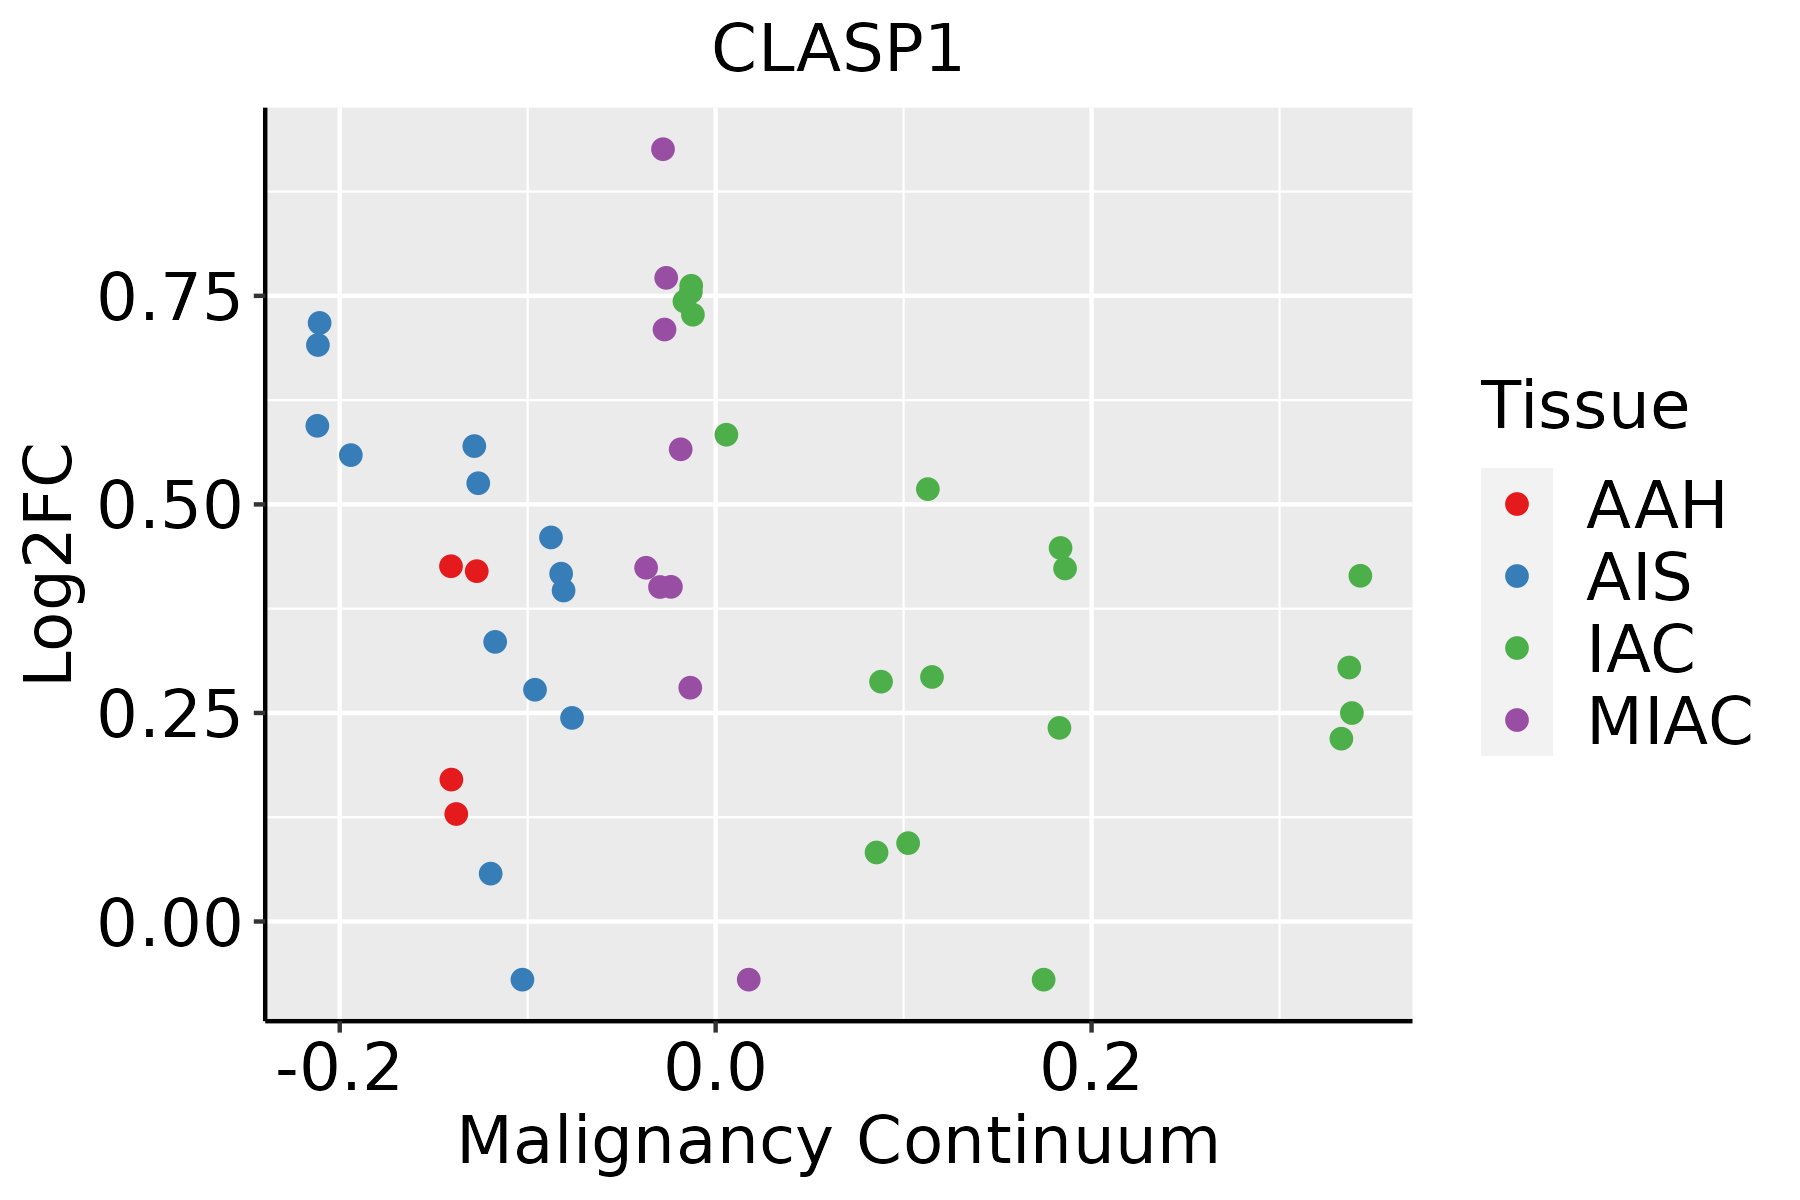 | AAH: Atypical adenomatous hyperplasia |
| AIS: Adenocarcinoma in situ | ||
| IAC: Invasive lung adenocarcinoma | ||
| MIA: Minimally invasive adenocarcinoma | ||
| Oral Cavity |  | EOLP: Erosive Oral lichen planus |
| LP: leukoplakia | ||
| NEOLP: Non-erosive oral lichen planus | ||
| OSCC: Oral squamous cell carcinoma | ||
| Prostate | 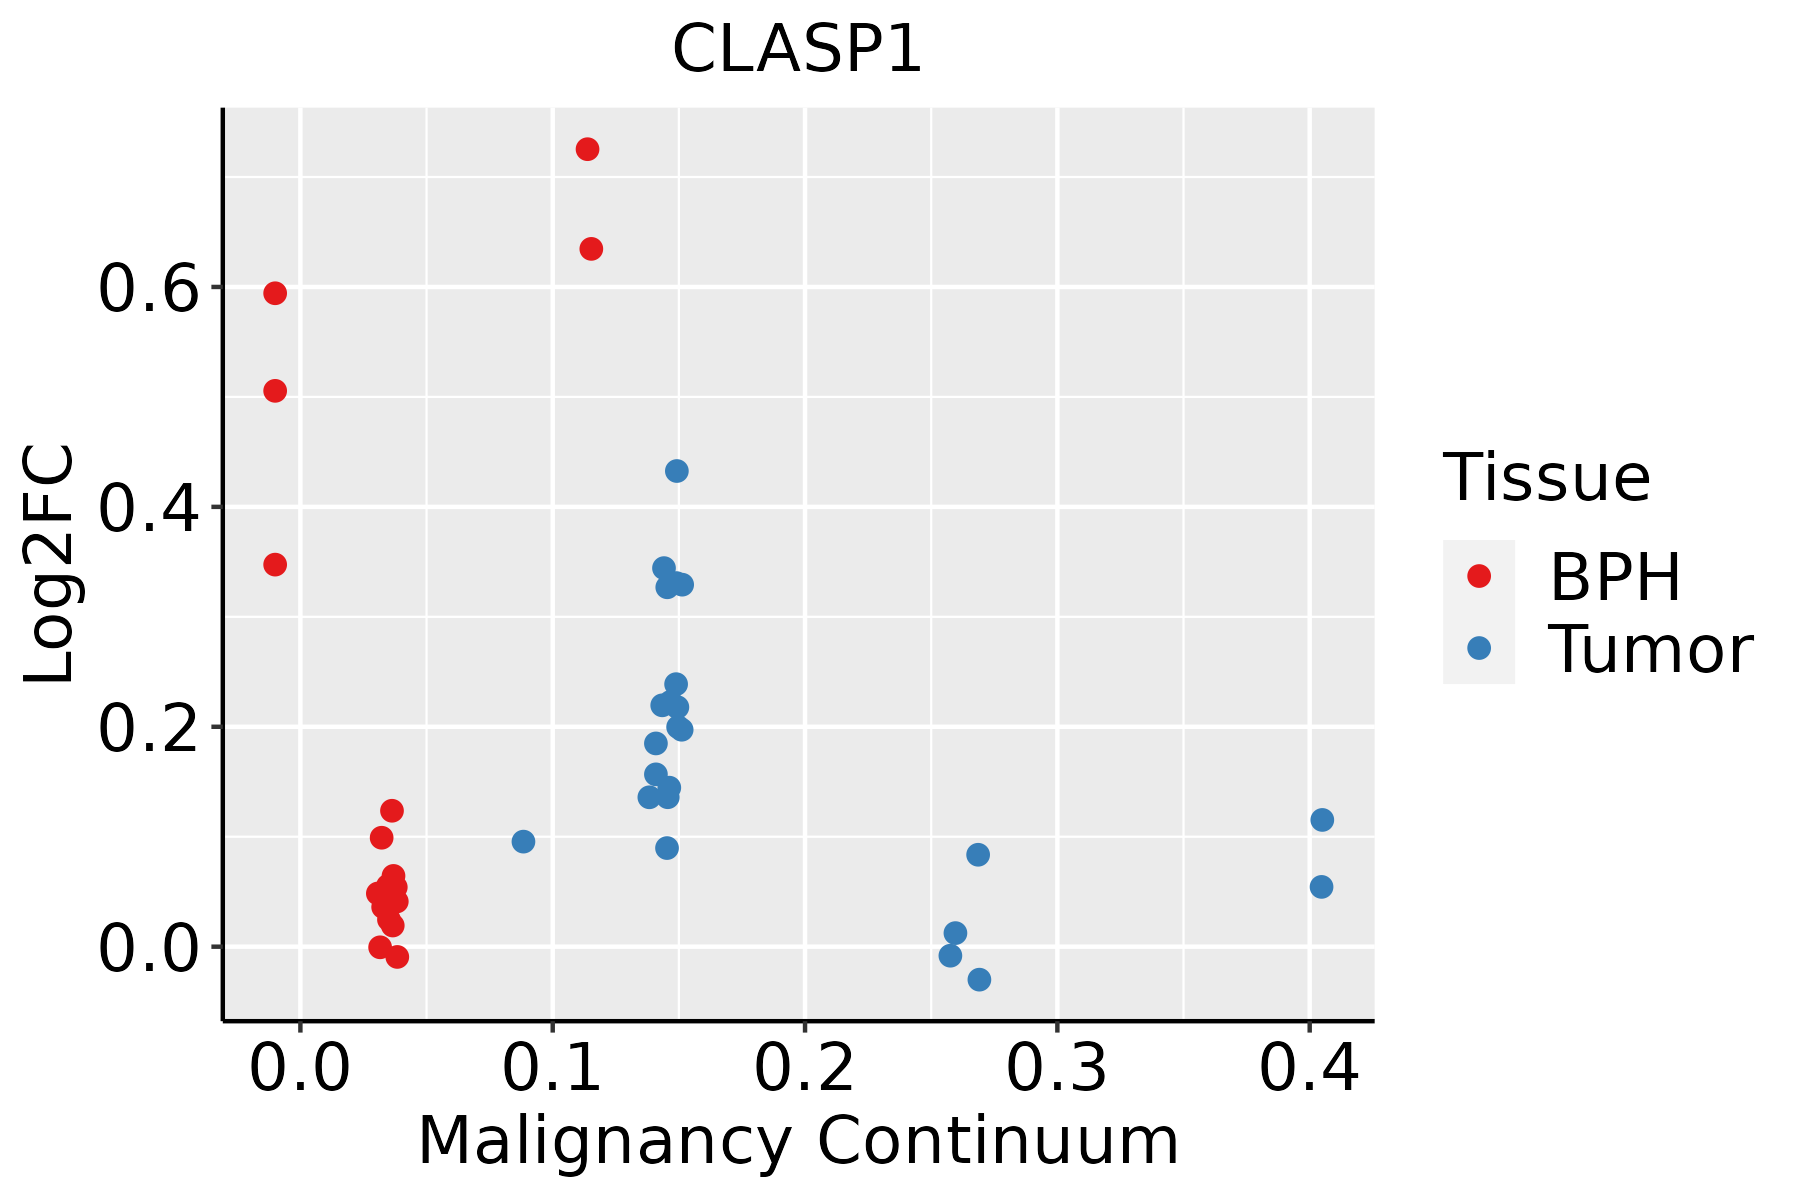 | BPH: Benign Prostatic Hyperplasia |
| Thyroid | 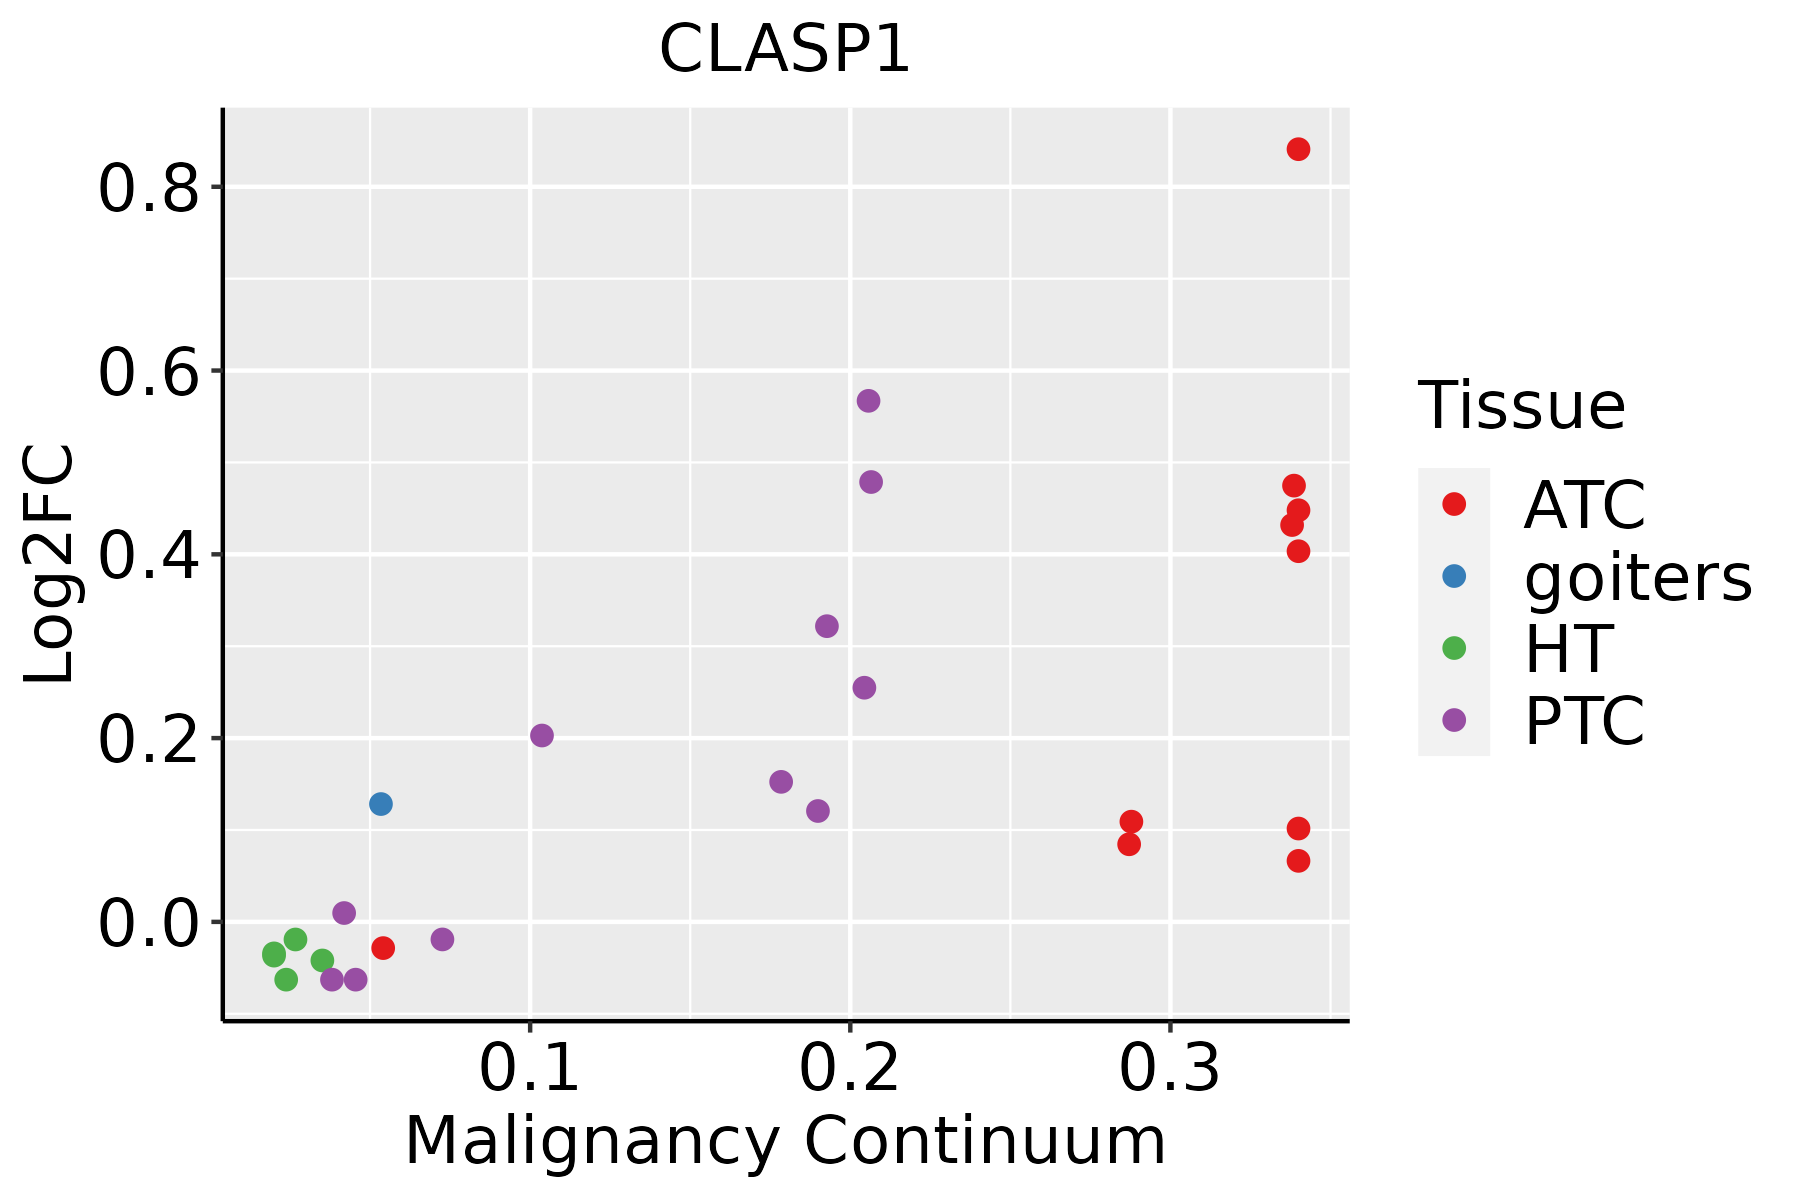 | ATC: Anaplastic thyroid cancer |
| HT: Hashimoto's thyroiditis | ||
| PTC: Papillary thyroid cancer |
| ∗log2FC in expression of this searched gene in stem-like cells from each diseased tissue sample relative to stem-like cells in normal samples in each tissue plotted against the malignancy continuum. Samples are colored based on if they are from different disease stage. |
Top |
Malignant transformation related pathway analysis |
| Find out the enriched GO biological processes and KEGG pathways involved in transition from healthy to precancer to cancer |
| Tissue | Disease Stage | Enriched GO biological Processes |
| Colorectum | AD |  |
| Colorectum | SER |  |
| Colorectum | MSS |  |
| Colorectum | MSI-H |  |
| Colorectum | FAP |  |
| ∗Top 15 enriched GO BP terms are showed in the bar plot of each disease state in each tissue. Each row represents a significant GO biological process which is colored according to the -log10(p.adjust). |
| Page: 1 2 3 4 5 6 7 8 9 |
| GO ID | Tissue | Disease Stage | Description | Gene Ratio | Bg Ratio | pvalue | p.adjust | Count |
| GO:004206010 | Cervix | CC | wound healing | 109/2311 | 422/18723 | 1.84e-14 | 1.57e-11 | 109 |
| GO:001081010 | Cervix | CC | regulation of cell-substrate adhesion | 69/2311 | 221/18723 | 8.57e-14 | 5.69e-11 | 69 |
| GO:00315898 | Cervix | CC | cell-substrate adhesion | 96/2311 | 363/18723 | 1.48e-13 | 8.85e-11 | 96 |
| GO:000701510 | Cervix | CC | actin filament organization | 109/2311 | 442/18723 | 4.92e-13 | 2.45e-10 | 109 |
| GO:009013210 | Cervix | CC | epithelium migration | 90/2311 | 360/18723 | 2.45e-11 | 6.11e-09 | 90 |
| GO:00016679 | Cervix | CC | ameboidal-type cell migration | 110/2311 | 475/18723 | 2.66e-11 | 6.36e-09 | 110 |
| GO:001063110 | Cervix | CC | epithelial cell migration | 89/2311 | 357/18723 | 3.72e-11 | 8.54e-09 | 89 |
| GO:003297010 | Cervix | CC | regulation of actin filament-based process | 96/2311 | 397/18723 | 4.00e-11 | 8.54e-09 | 96 |
| GO:00071639 | Cervix | CC | establishment or maintenance of cell polarity | 63/2311 | 218/18723 | 4.25e-11 | 8.76e-09 | 63 |
| GO:009013010 | Cervix | CC | tissue migration | 90/2311 | 365/18723 | 5.42e-11 | 1.05e-08 | 90 |
| GO:190290310 | Cervix | CC | regulation of supramolecular fiber organization | 92/2311 | 383/18723 | 1.49e-10 | 2.48e-08 | 92 |
| GO:01501159 | Cervix | CC | cell-substrate junction organization | 37/2311 | 101/18723 | 3.20e-10 | 4.46e-08 | 37 |
| GO:003295610 | Cervix | CC | regulation of actin cytoskeleton organization | 86/2311 | 358/18723 | 5.90e-10 | 7.51e-08 | 86 |
| GO:004325410 | Cervix | CC | regulation of protein-containing complex assembly | 96/2311 | 428/18723 | 2.91e-09 | 3.05e-07 | 96 |
| GO:00070448 | Cervix | CC | cell-substrate junction assembly | 34/2311 | 95/18723 | 3.35e-09 | 3.45e-07 | 34 |
| GO:001063210 | Cervix | CC | regulation of epithelial cell migration | 72/2311 | 292/18723 | 4.52e-09 | 4.43e-07 | 72 |
| GO:00019528 | Cervix | CC | regulation of cell-matrix adhesion | 40/2311 | 128/18723 | 1.32e-08 | 1.04e-06 | 40 |
| GO:00071608 | Cervix | CC | cell-matrix adhesion | 60/2311 | 233/18723 | 1.58e-08 | 1.23e-06 | 60 |
| GO:011005310 | Cervix | CC | regulation of actin filament organization | 67/2311 | 278/18723 | 4.01e-08 | 2.54e-06 | 67 |
| GO:00300108 | Cervix | CC | establishment of cell polarity | 42/2311 | 143/18723 | 4.30e-08 | 2.62e-06 | 42 |
| Page: 1 2 3 4 5 6 7 8 9 10 11 12 13 14 15 16 17 18 19 20 21 22 23 24 25 26 27 28 29 30 31 32 33 34 35 36 37 38 39 40 41 42 43 44 45 46 47 48 49 50 51 52 53 54 55 56 |
| Pathway ID | Tissue | Disease Stage | Description | Gene Ratio | Bg Ratio | pvalue | p.adjust | qvalue | Count |
| Page: 1 |
Top |
Cell-cell communication analysis |
| Identification of potential cell-cell interactions between two cell types and their ligand-receptor pairs for different disease states |
| Ligand | Receptor | LRpair | Pathway | Tissue | Disease Stage |
| Page: 1 |
Top |
Single-cell gene regulatory network inference analysis |
| Find out the significant the regulons (TFs) and the target genes of each regulon across cell types for different disease states |
| TF | Cell Type | Tissue | Disease Stage | Target Gene | RSS | Regulon Activity |
| ∗The dot plots of a searched regulon are shown for all cell subpopulations in each disease state of each tissue based on the regulon specific score inferred using pySCENIC and by calculating the average expression. |
| Page: 1 |
Top |
Somatic mutation of malignant transformation related genes |
| Annotation of somatic variants for genes involved in malignant transformation |
| Hugo Symbol | Variant Class | Variant Classification | dbSNP RS | HGVSc | HGVSp | HGVSp Short | SWISSPROT | BIOTYPE | SIFT | PolyPhen | Tumor Sample Barcode | Tissue | Histology | Sex | Age | Stage | Therapy Types | Drugs | Outcome |
| CLASP1 | SNV | Missense_Mutation | c.2725N>T | p.His909Tyr | p.H909Y | Q7Z460 | protein_coding | deleterious(0) | possibly_damaging(0.789) | TCGA-A2-A0EV-01 | Breast | breast invasive carcinoma | Female | >=65 | I/II | Unknown | Unknown | SD | |
| CLASP1 | SNV | Missense_Mutation | rs748266679 | c.3997C>T | p.Arg1333Trp | p.R1333W | Q7Z460 | protein_coding | deleterious(0) | probably_damaging(0.997) | TCGA-A8-A08J-01 | Breast | breast invasive carcinoma | Female | <65 | III/IV | Unknown | Unknown | PD |
| CLASP1 | SNV | Missense_Mutation | c.704N>G | p.Ser235Cys | p.S235C | Q7Z460 | protein_coding | deleterious(0) | possibly_damaging(0.471) | TCGA-AC-A23H-01 | Breast | breast invasive carcinoma | Female | >=65 | I/II | Unknown | Unknown | PD | |
| CLASP1 | SNV | Missense_Mutation | novel | c.1078N>T | p.Asp360Tyr | p.D360Y | Q7Z460 | protein_coding | deleterious(0) | possibly_damaging(0.789) | TCGA-AC-A3QQ-01 | Breast | breast invasive carcinoma | Female | <65 | I/II | Unknown | Unknown | SD |
| CLASP1 | SNV | Missense_Mutation | novel | c.1078G>A | p.Asp360Asn | p.D360N | Q7Z460 | protein_coding | deleterious(0) | benign(0.36) | TCGA-AR-A0U2-01 | Breast | breast invasive carcinoma | Female | <65 | III/IV | Hormone Therapy | tamoxiphen | PD |
| CLASP1 | SNV | Missense_Mutation | rs751028676 | c.3559N>A | p.Glu1187Lys | p.E1187K | Q7Z460 | protein_coding | deleterious(0.03) | probably_damaging(0.991) | TCGA-B6-A1KN-01 | Breast | breast invasive carcinoma | Female | <65 | III/IV | Unknown | Unknown | SD |
| CLASP1 | SNV | Missense_Mutation | c.2719N>A | p.Asp907Asn | p.D907N | Q7Z460 | protein_coding | deleterious(0) | possibly_damaging(0.887) | TCGA-BH-A0HF-01 | Breast | breast invasive carcinoma | Female | >=65 | I/II | Hormone Therapy | arimidex | SD | |
| CLASP1 | SNV | Missense_Mutation | c.71G>A | p.Gly24Asp | p.G24D | Q7Z460 | protein_coding | deleterious(0) | probably_damaging(0.997) | TCGA-BH-A18G-01 | Breast | breast invasive carcinoma | Female | >=65 | I/II | Unknown | Unknown | SD | |
| CLASP1 | SNV | Missense_Mutation | c.1382N>C | p.Arg461Thr | p.R461T | Q7Z460 | protein_coding | deleterious(0) | probably_damaging(0.997) | TCGA-C8-A1HM-01 | Breast | breast invasive carcinoma | Female | >=65 | I/II | Chemotherapy | doxorubicin | CR | |
| CLASP1 | SNV | Missense_Mutation | novel | c.2790T>G | p.Asp930Glu | p.D930E | Q7Z460 | protein_coding | tolerated(0.6) | benign(0.031) | TCGA-LL-A441-01 | Breast | breast invasive carcinoma | Female | <65 | I/II | Chemotherapy | taxotere | CR |
| Page: 1 2 3 4 5 6 7 8 9 10 11 12 13 14 15 16 |
Top |
Related drugs of malignant transformation related genes |
| Identification of chemicals and drugs interact with genes involved in malignant transfromation |
| (DGIdb 4.0) |
| Entrez ID | Symbol | Category | Interaction Types | Drug Claim Name | Drug Name | PMIDs |
| Page: 1 |

Copyright 2023-Present -The University of Texas Health Science Center at Houston |