
|
|||||
|
 | |
| |
| |
| |
| |
| |
|
Gene: CKS2 |
Gene summary for CKS2 |
| Gene information | Species | Human | Gene symbol | CKS2 | Gene ID | 1164 |
| Gene name | CDC28 protein kinase regulatory subunit 2 | |
| Gene Alias | CKSHS2 | |
| Cytomap | 9q22.2 | |
| Gene Type | protein-coding | GO ID | GO:0000003 | UniProtAcc | P33552 |
Top |
Malignant transformation analysis |
| Identification of the aberrant gene expression in precancerous and cancerous lesions by comparing the gene expression of stem-like cells in diseased tissues with normal stem cells |
| Entrez ID | Symbol | Replicates | Species | Organ | Tissue | Adj P-value | Log2FC | Malignancy |
| 1164 | CKS2 | CA_HPV_1 | Human | Cervix | CC | 1.83e-02 | -8.15e-02 | 0.0264 |
| 1164 | CKS2 | CCII_1 | Human | Cervix | CC | 4.04e-05 | -3.67e-01 | 0.3249 |
| 1164 | CKS2 | sample1 | Human | Cervix | CC | 9.78e-10 | 6.63e-01 | 0.0959 |
| 1164 | CKS2 | T1 | Human | Cervix | CC | 1.26e-10 | 5.10e-01 | 0.0918 |
| 1164 | CKS2 | LZE4T | Human | Esophagus | ESCC | 7.21e-06 | 9.43e-01 | 0.0811 |
| 1164 | CKS2 | LZE7T | Human | Esophagus | ESCC | 3.90e-05 | 9.54e-01 | 0.0667 |
| 1164 | CKS2 | LZE8T | Human | Esophagus | ESCC | 1.21e-03 | 6.63e-01 | 0.067 |
| 1164 | CKS2 | LZE24T | Human | Esophagus | ESCC | 5.16e-09 | 9.39e-01 | 0.0596 |
| 1164 | CKS2 | LZE21T | Human | Esophagus | ESCC | 4.70e-03 | 1.41e+00 | 0.0655 |
| 1164 | CKS2 | LZE6T | Human | Esophagus | ESCC | 3.88e-12 | 1.47e+00 | 0.0845 |
| 1164 | CKS2 | P2T-E | Human | Esophagus | ESCC | 2.44e-55 | 2.33e+00 | 0.1177 |
| 1164 | CKS2 | P4T-E | Human | Esophagus | ESCC | 1.05e-25 | 1.71e+00 | 0.1323 |
| 1164 | CKS2 | P5T-E | Human | Esophagus | ESCC | 1.38e-15 | 9.47e-01 | 0.1327 |
| 1164 | CKS2 | P8T-E | Human | Esophagus | ESCC | 5.55e-03 | 3.72e-01 | 0.0889 |
| 1164 | CKS2 | P9T-E | Human | Esophagus | ESCC | 5.23e-17 | 1.15e+00 | 0.1131 |
| 1164 | CKS2 | P10T-E | Human | Esophagus | ESCC | 4.93e-20 | 1.19e+00 | 0.116 |
| 1164 | CKS2 | P11T-E | Human | Esophagus | ESCC | 2.49e-10 | 2.59e+00 | 0.1426 |
| 1164 | CKS2 | P12T-E | Human | Esophagus | ESCC | 5.04e-31 | 1.45e+00 | 0.1122 |
| 1164 | CKS2 | P15T-E | Human | Esophagus | ESCC | 2.36e-24 | 1.27e+00 | 0.1149 |
| 1164 | CKS2 | P16T-E | Human | Esophagus | ESCC | 6.77e-19 | 9.04e-01 | 0.1153 |
| Page: 1 2 3 4 5 6 7 |
| Tissue | Expression Dynamics | Abbreviation |
| Cervix | 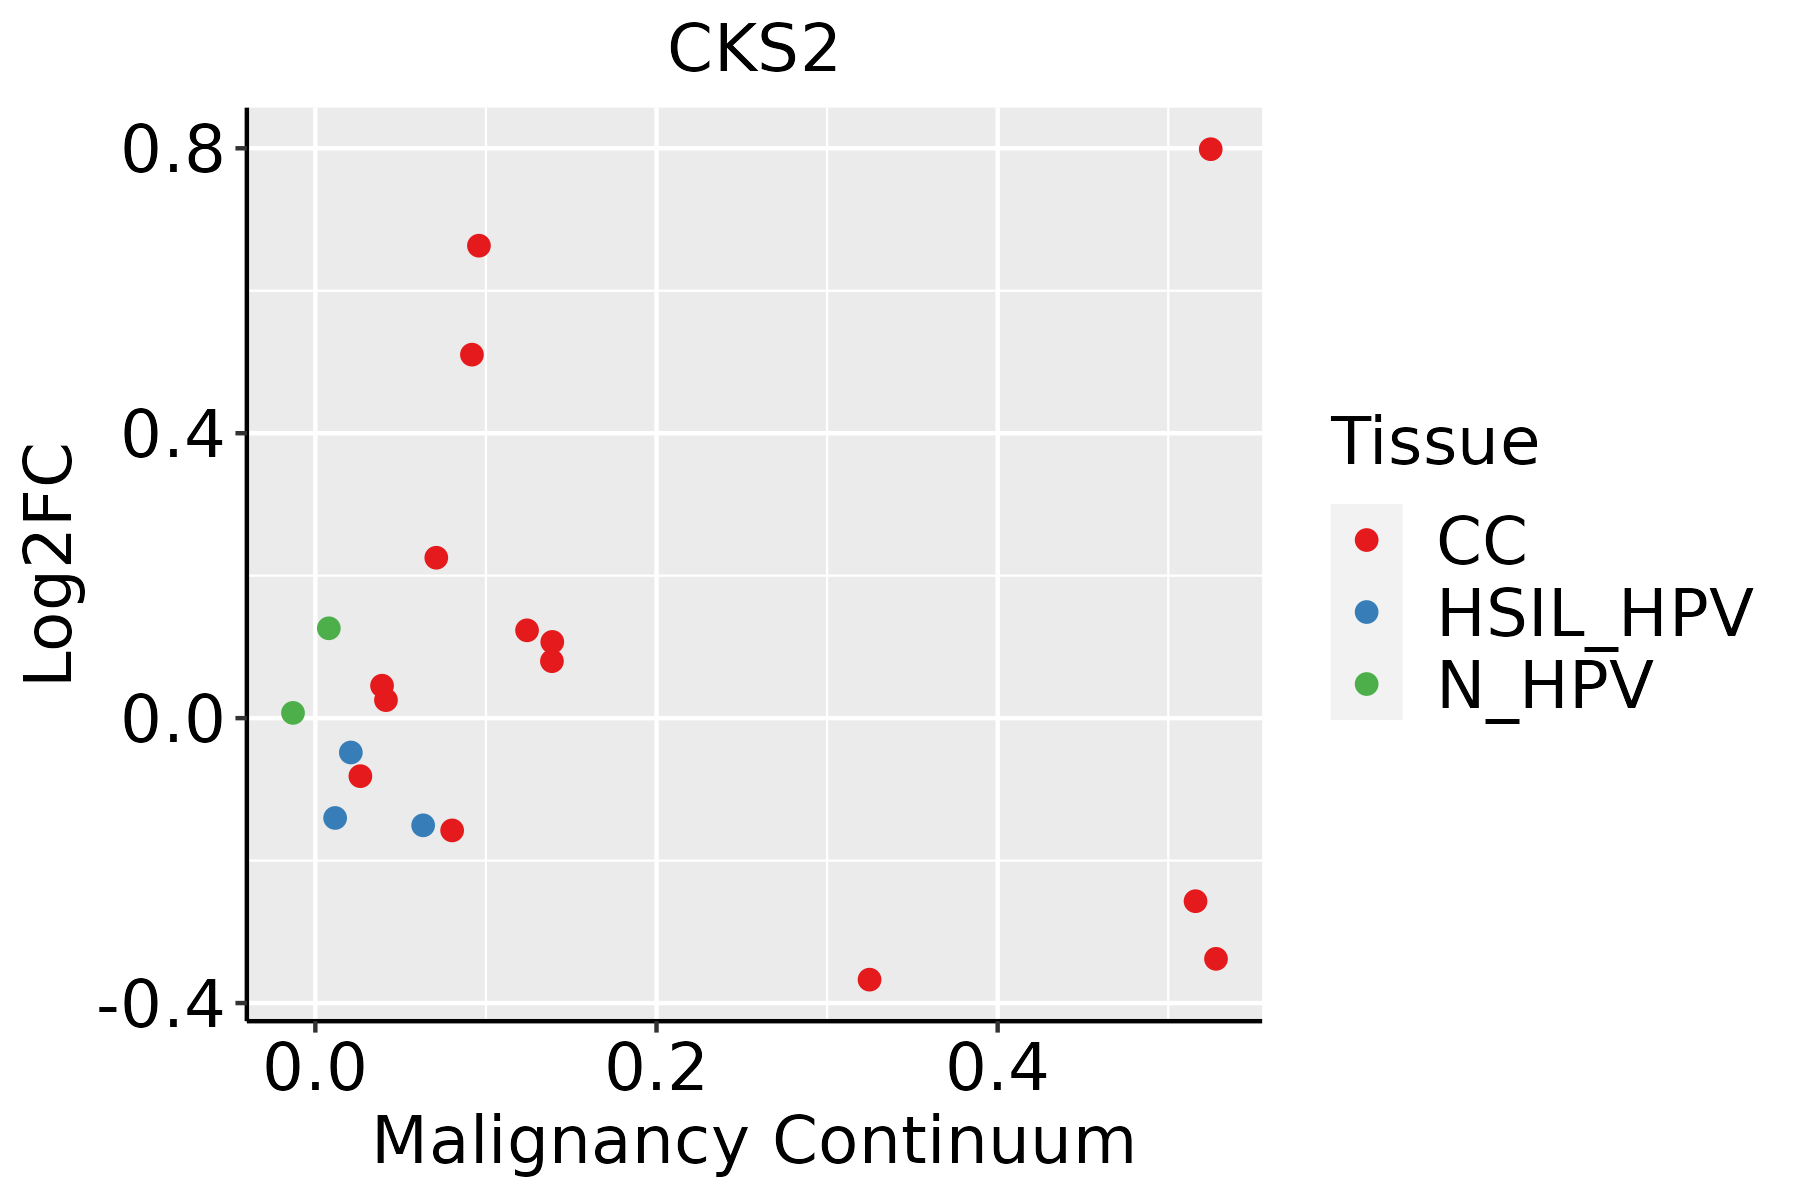 | CC: Cervix cancer |
| HSIL_HPV: HPV-infected high-grade squamous intraepithelial lesions | ||
| N_HPV: HPV-infected normal cervix | ||
| Esophagus | 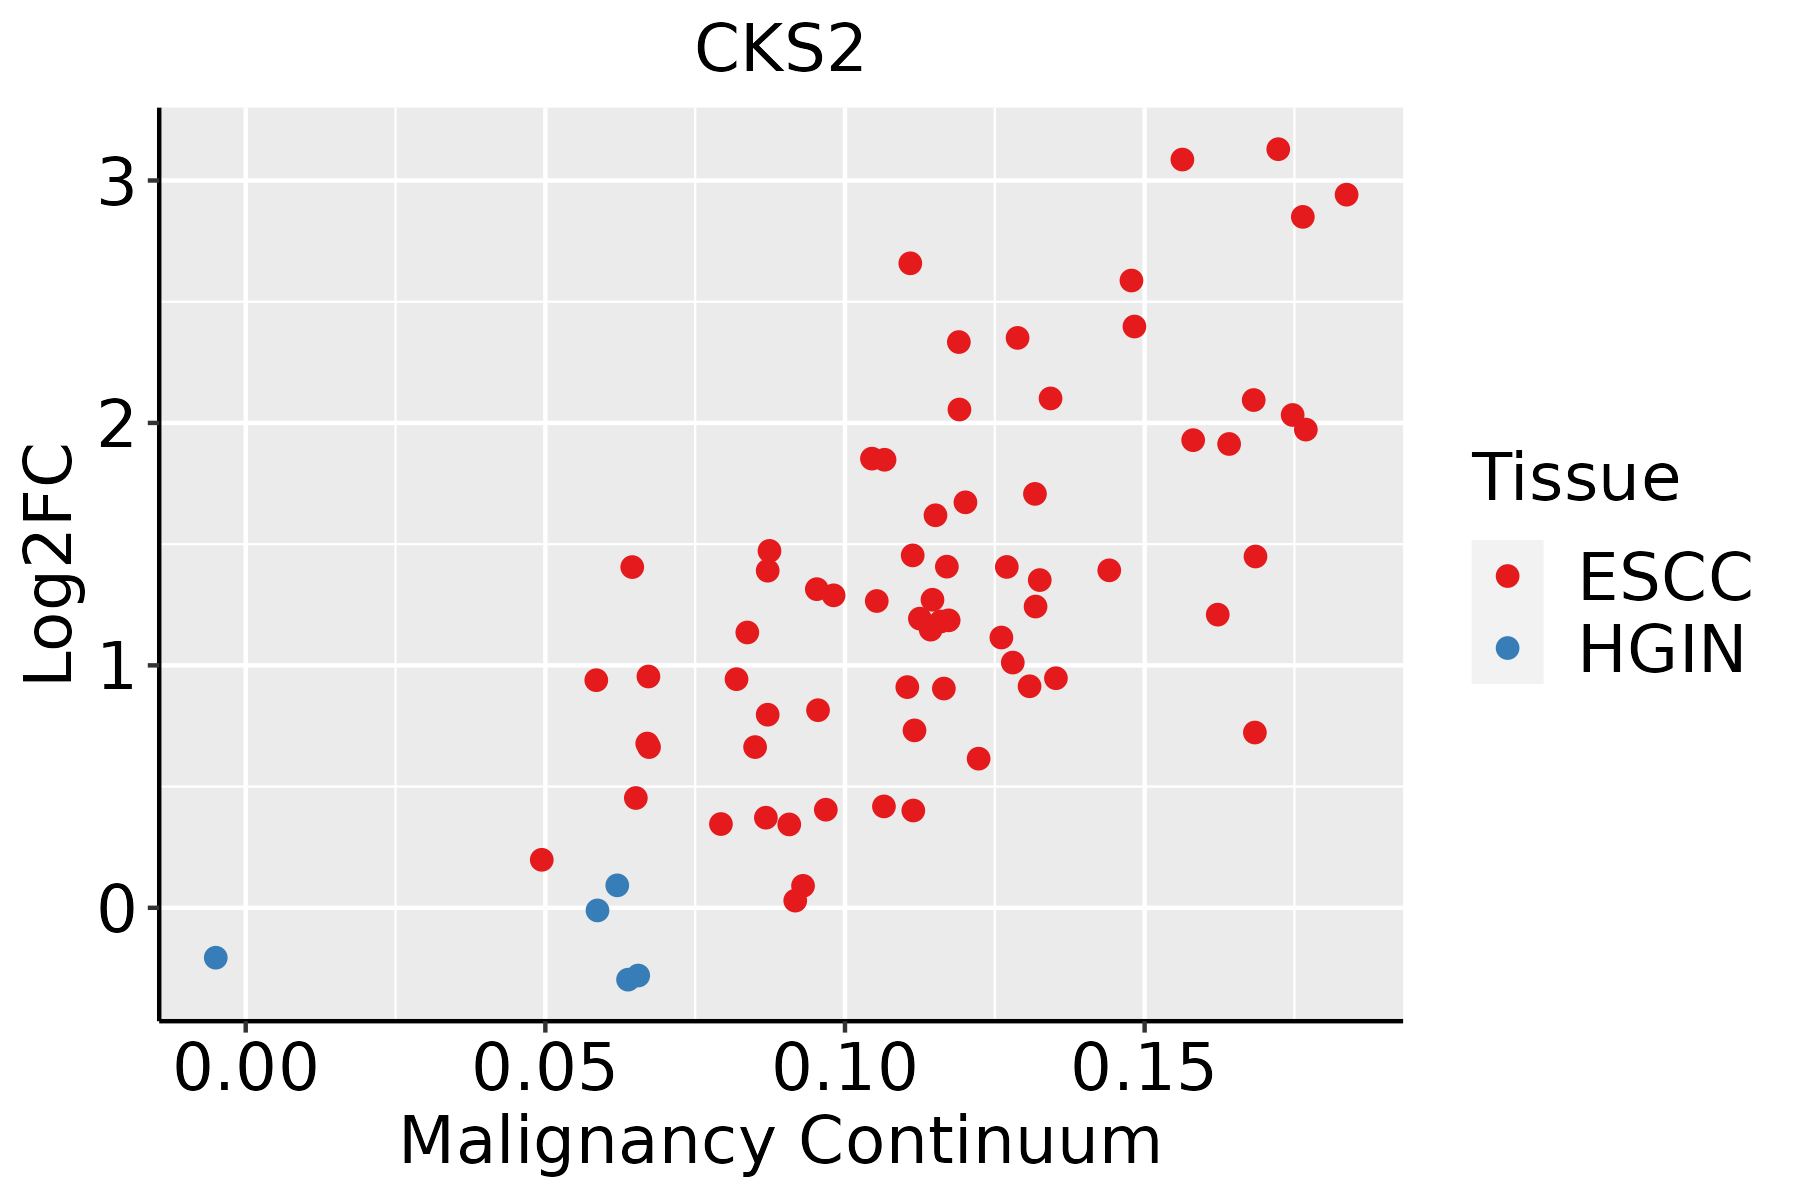 | ESCC: Esophageal squamous cell carcinoma |
| HGIN: High-grade intraepithelial neoplasias | ||
| LGIN: Low-grade intraepithelial neoplasias | ||
| Liver |  | HCC: Hepatocellular carcinoma |
| NAFLD: Non-alcoholic fatty liver disease | ||
| Oral Cavity | 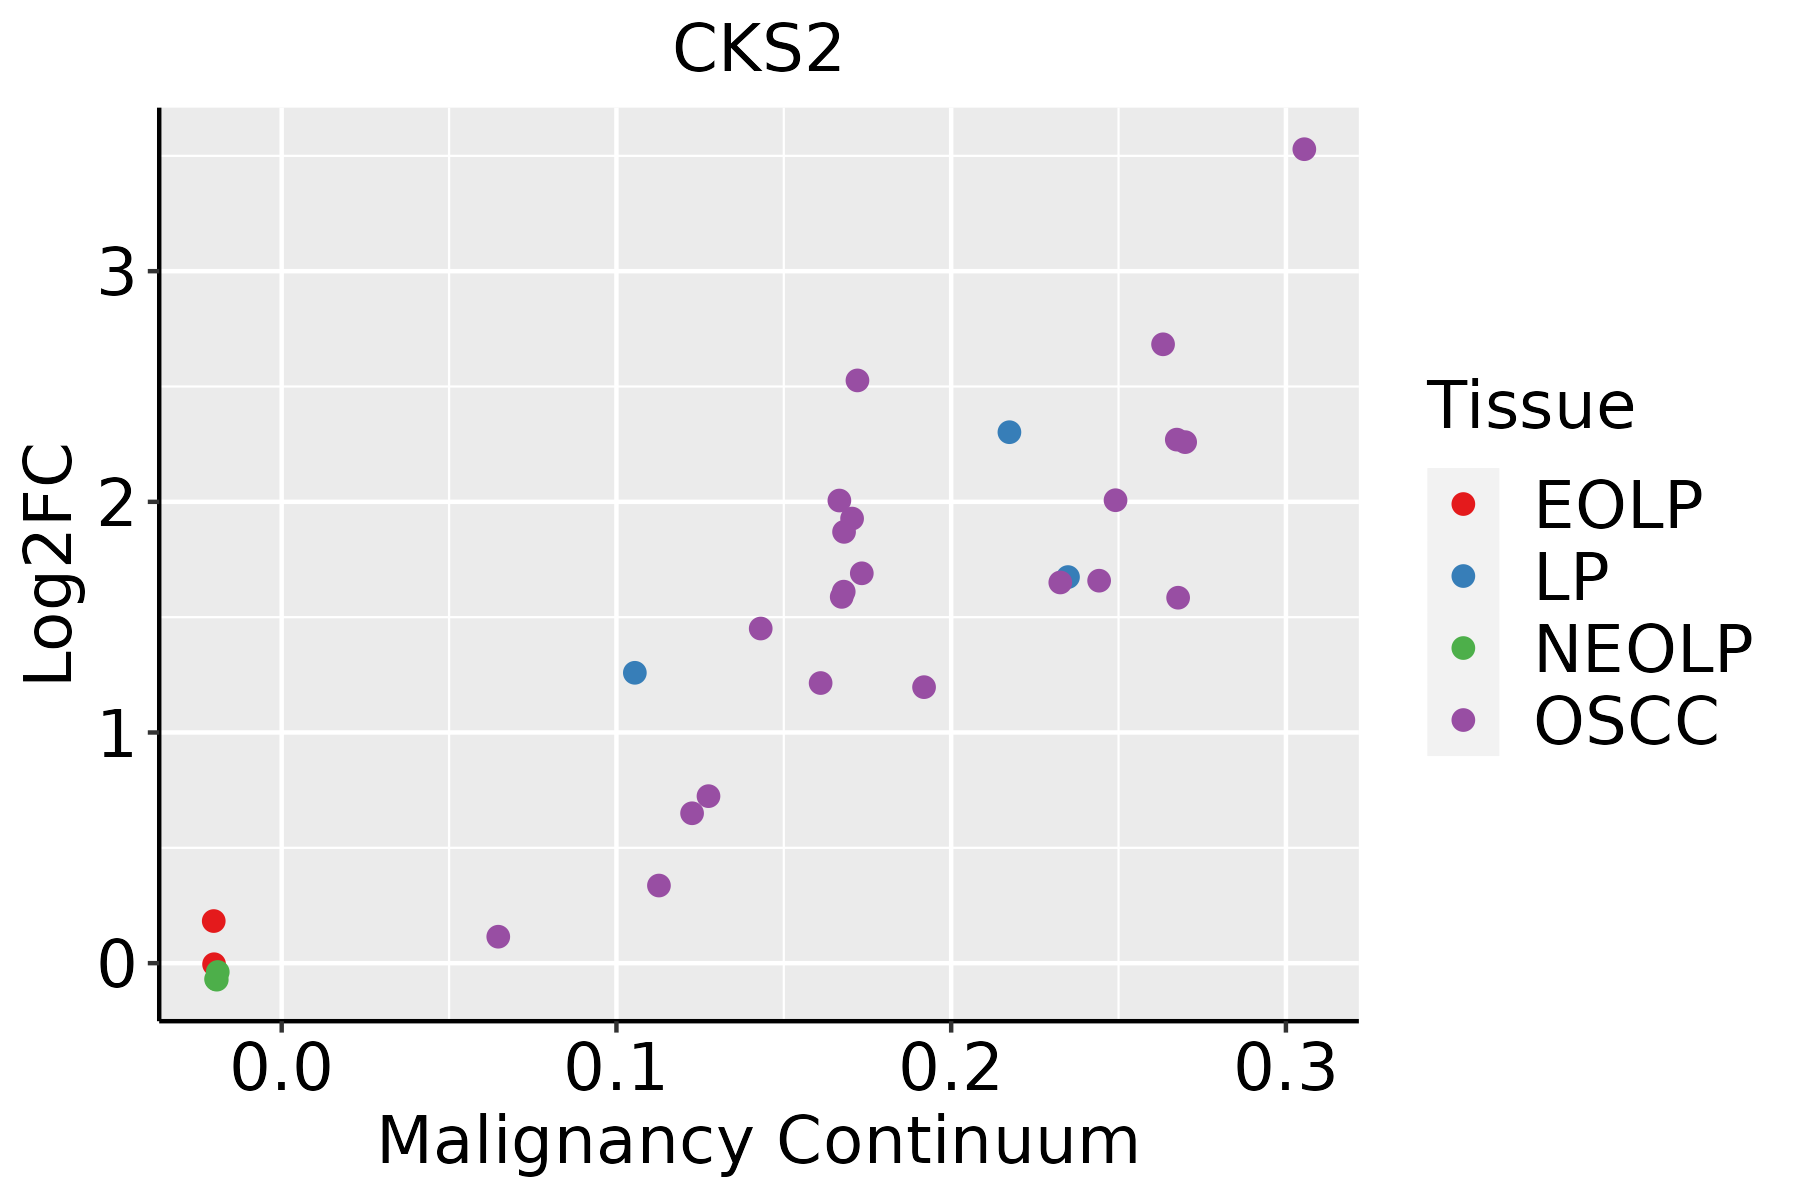 | EOLP: Erosive Oral lichen planus |
| LP: leukoplakia | ||
| NEOLP: Non-erosive oral lichen planus | ||
| OSCC: Oral squamous cell carcinoma | ||
| Prostate | 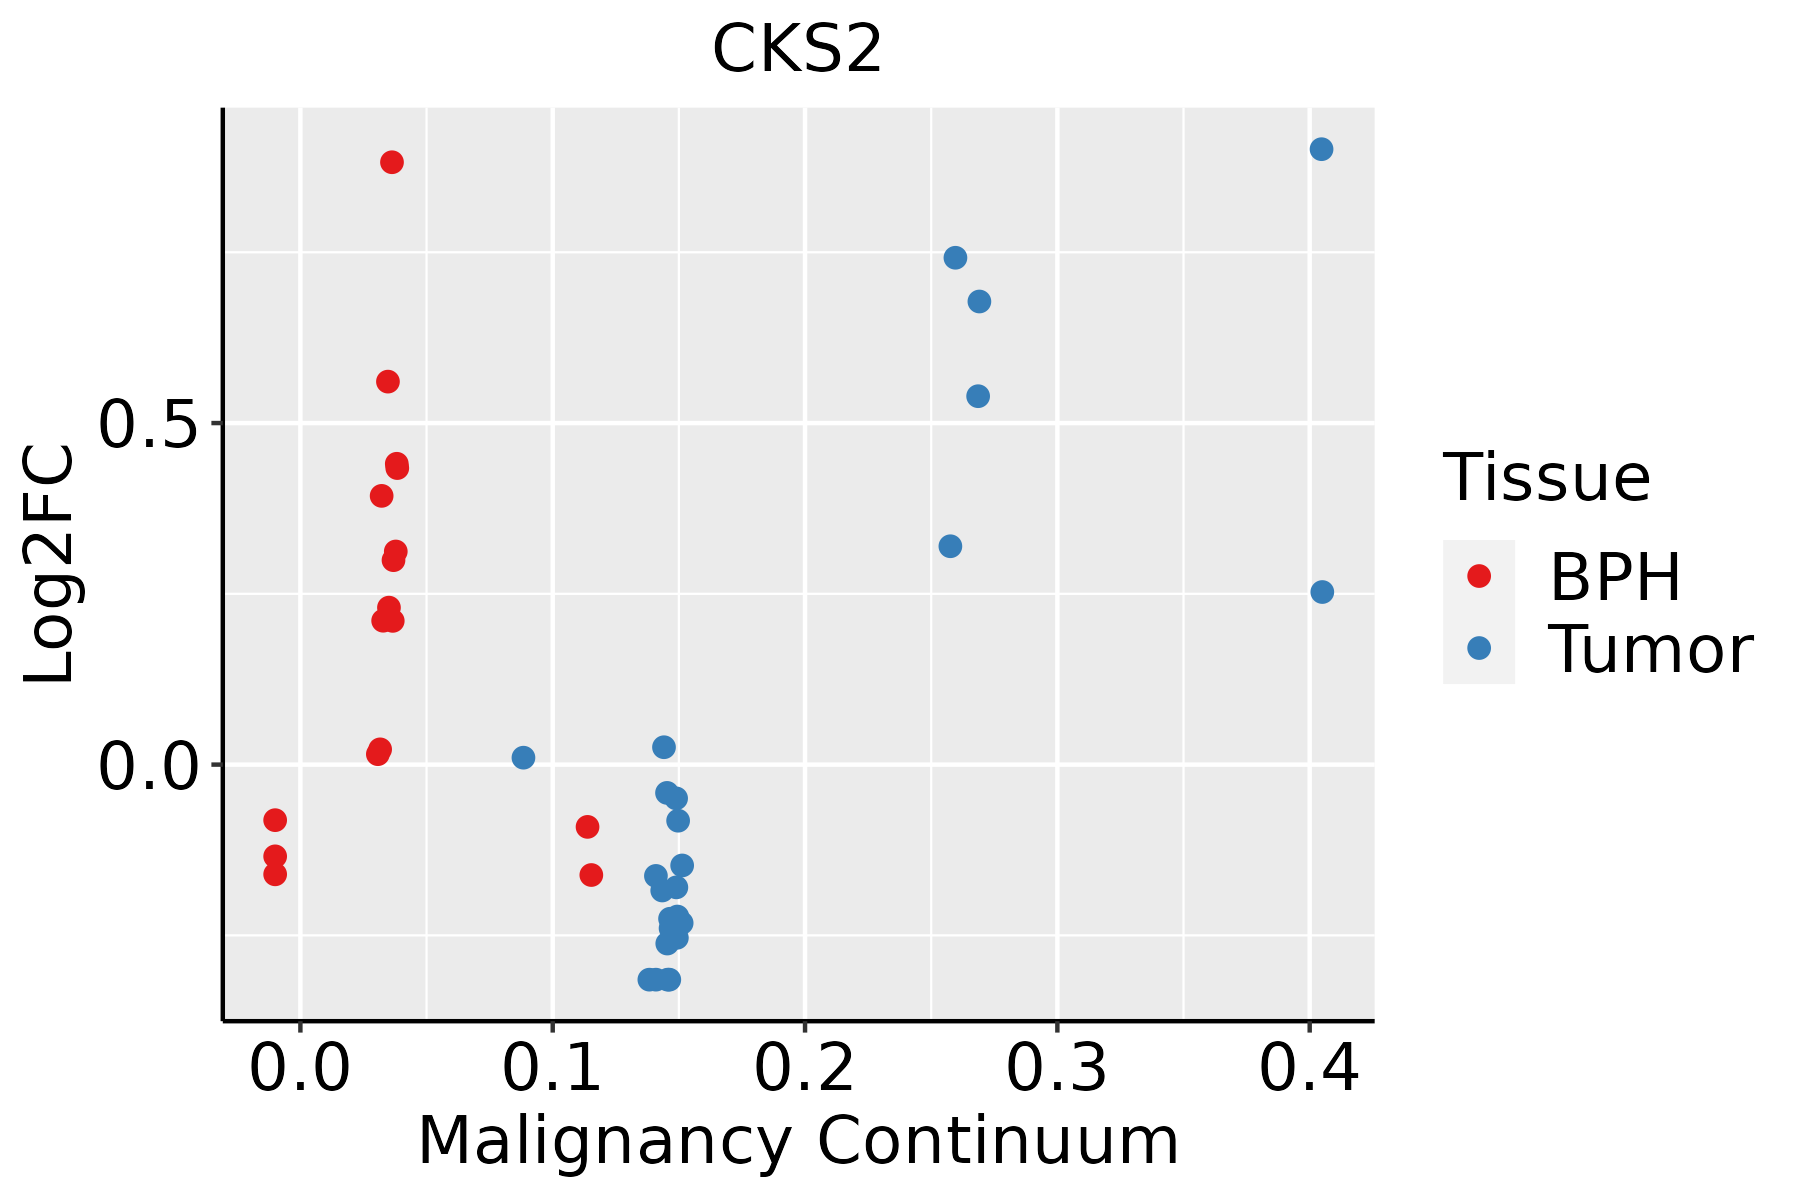 | BPH: Benign Prostatic Hyperplasia |
| Skin | 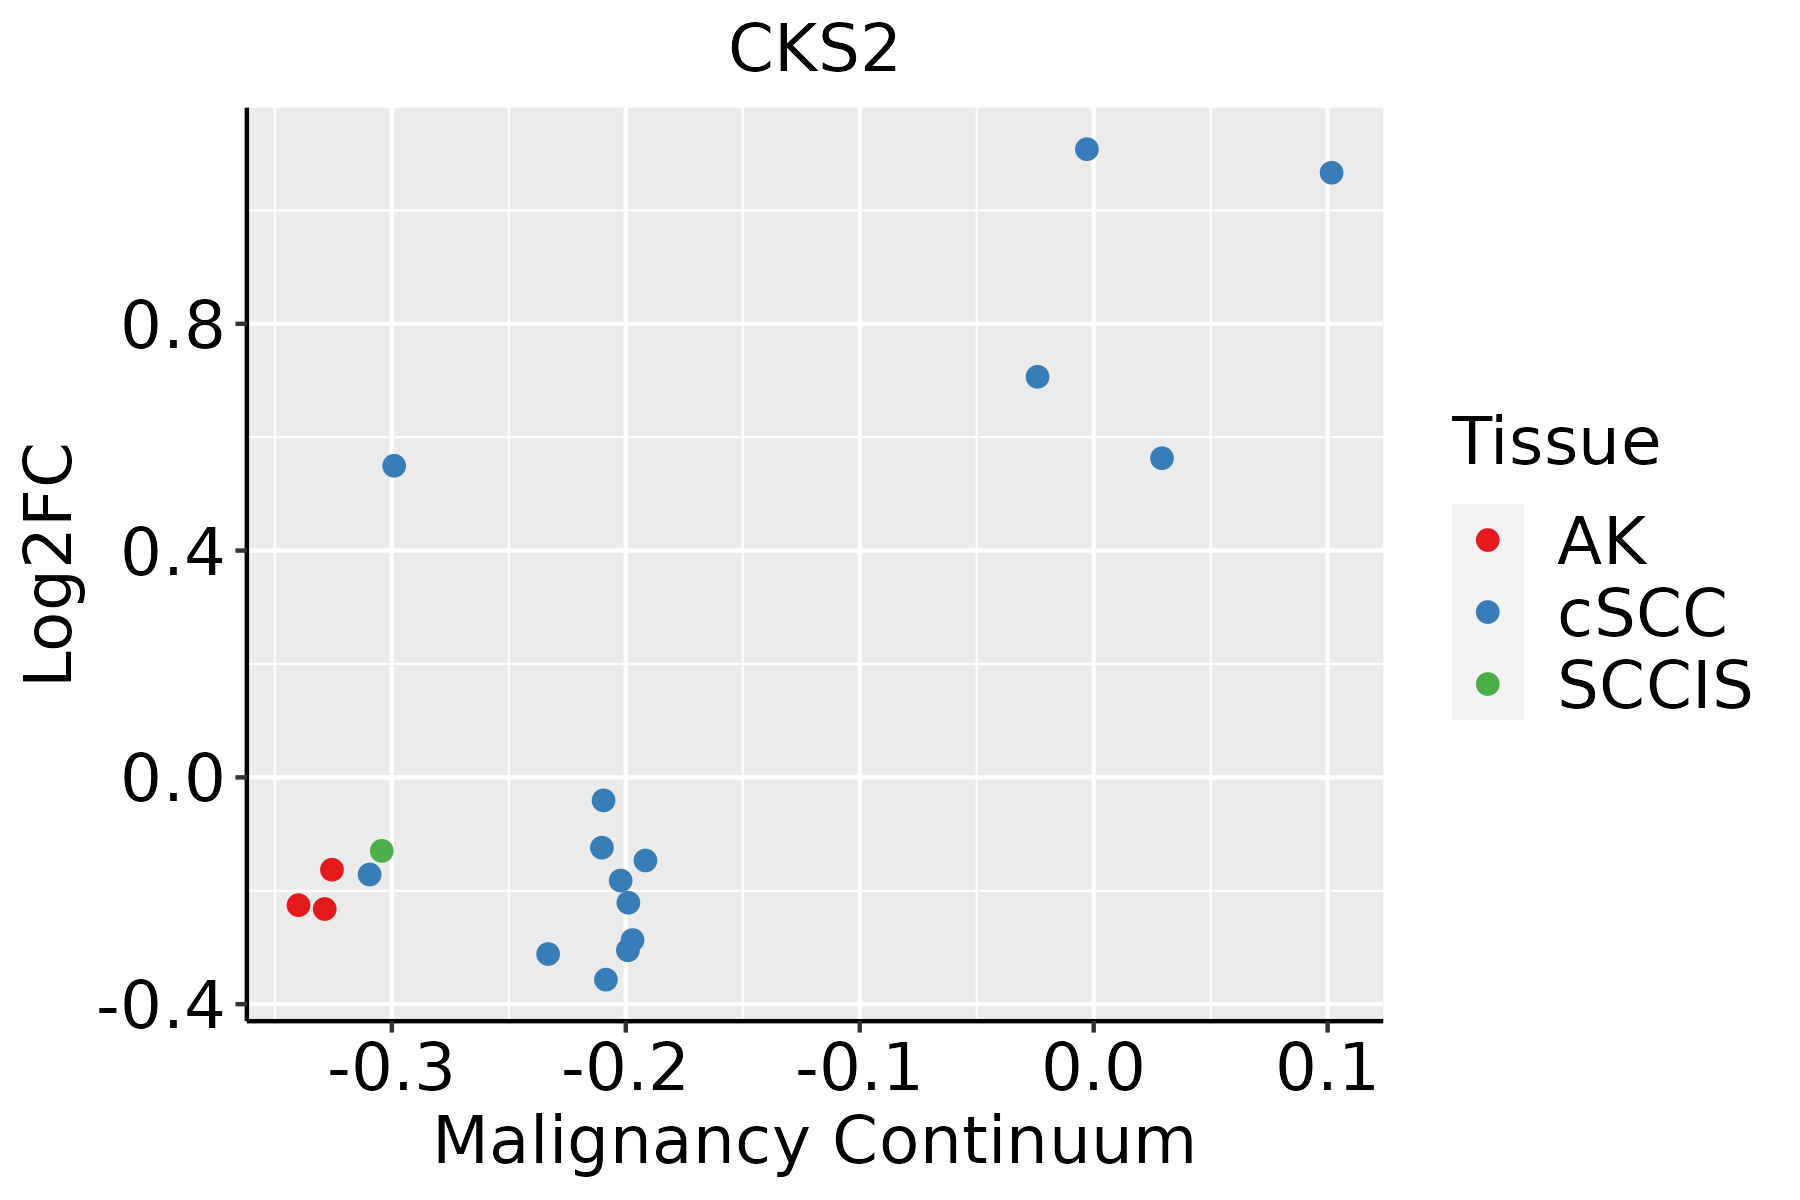 | AK: Actinic keratosis |
| cSCC: Cutaneous squamous cell carcinoma | ||
| SCCIS:squamous cell carcinoma in situ | ||
| Thyroid | 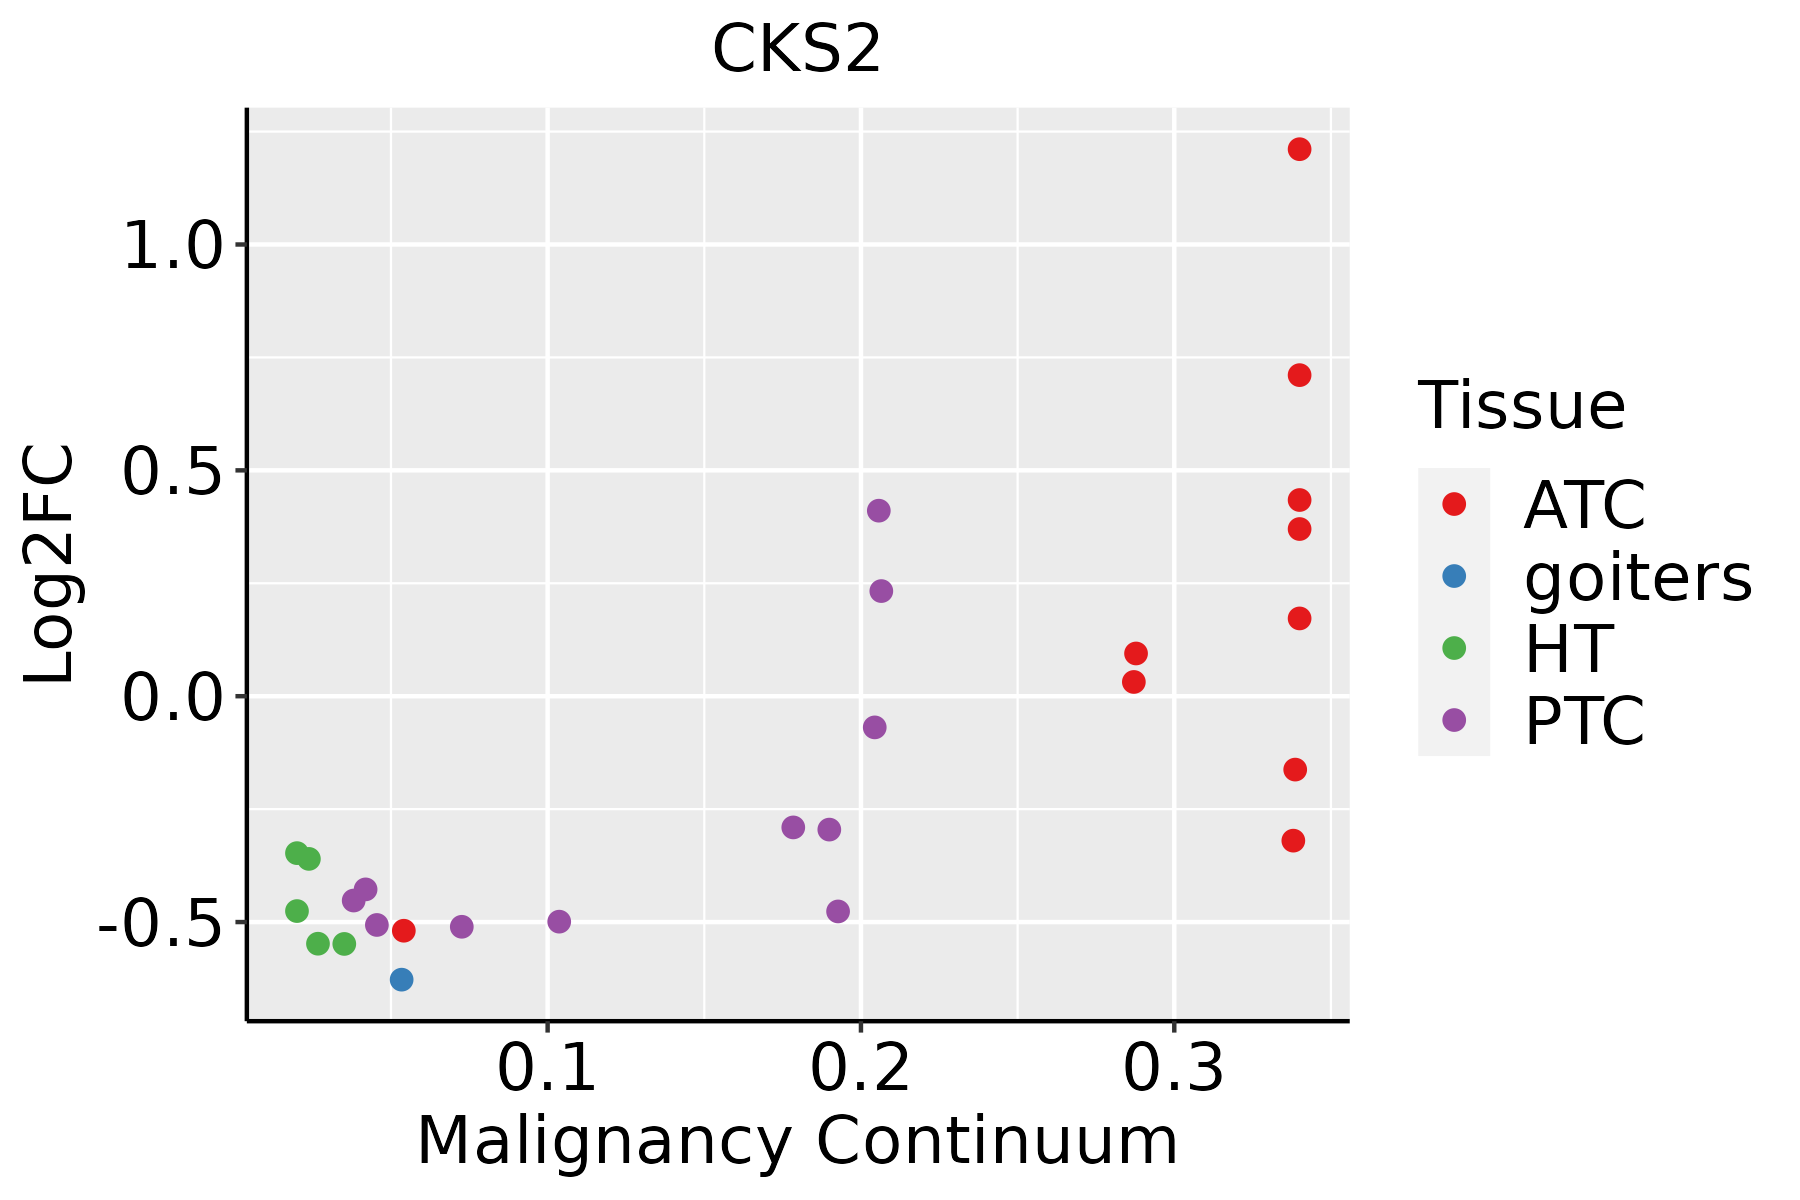 | ATC: Anaplastic thyroid cancer |
| HT: Hashimoto's thyroiditis | ||
| PTC: Papillary thyroid cancer |
| ∗log2FC in expression of this searched gene in stem-like cells from each diseased tissue sample relative to stem-like cells in normal samples in each tissue plotted against the malignancy continuum. Samples are colored based on if they are from different disease stage. |
Top |
Malignant transformation related pathway analysis |
| Find out the enriched GO biological processes and KEGG pathways involved in transition from healthy to precancer to cancer |
| Tissue | Disease Stage | Enriched GO biological Processes |
| Colorectum | AD |  |
| Colorectum | SER |  |
| Colorectum | MSS |  |
| Colorectum | MSI-H |  |
| Colorectum | FAP |  |
| ∗Top 15 enriched GO BP terms are showed in the bar plot of each disease state in each tissue. Each row represents a significant GO biological process which is colored according to the -log10(p.adjust). |
| Page: 1 2 3 4 5 6 7 8 9 |
| GO ID | Tissue | Disease Stage | Description | Gene Ratio | Bg Ratio | pvalue | p.adjust | Count |
| GO:003367410 | Cervix | CC | positive regulation of kinase activity | 101/2311 | 467/18723 | 8.66e-09 | 7.22e-07 | 101 |
| GO:00458608 | Cervix | CC | positive regulation of protein kinase activity | 85/2311 | 386/18723 | 5.61e-08 | 3.29e-06 | 85 |
| GO:00447725 | Cervix | CC | mitotic cell cycle phase transition | 89/2311 | 424/18723 | 2.70e-07 | 1.12e-05 | 89 |
| GO:00719007 | Cervix | CC | regulation of protein serine/threonine kinase activity | 75/2311 | 359/18723 | 2.76e-06 | 8.02e-05 | 75 |
| GO:00457876 | Cervix | CC | positive regulation of cell cycle | 66/2311 | 313/18723 | 7.78e-06 | 1.81e-04 | 66 |
| GO:00073466 | Cervix | CC | regulation of mitotic cell cycle | 88/2311 | 457/18723 | 1.26e-05 | 2.60e-04 | 88 |
| GO:00719025 | Cervix | CC | positive regulation of protein serine/threonine kinase activity | 46/2311 | 200/18723 | 1.87e-05 | 3.47e-04 | 46 |
| GO:00482851 | Cervix | CC | organelle fission | 78/2311 | 488/18723 | 9.70e-03 | 4.79e-02 | 78 |
| GO:004477216 | Esophagus | ESCC | mitotic cell cycle phase transition | 281/8552 | 424/18723 | 4.63e-18 | 4.45e-16 | 281 |
| GO:000734615 | Esophagus | ESCC | regulation of mitotic cell cycle | 293/8552 | 457/18723 | 8.00e-16 | 5.64e-14 | 293 |
| GO:00482853 | Esophagus | ESCC | organelle fission | 301/8552 | 488/18723 | 4.64e-13 | 2.12e-11 | 301 |
| GO:007190016 | Esophagus | ESCC | regulation of protein serine/threonine kinase activity | 227/8552 | 359/18723 | 1.12e-11 | 4.10e-10 | 227 |
| GO:00002802 | Esophagus | ESCC | nuclear division | 270/8552 | 439/18723 | 1.17e-11 | 4.24e-10 | 270 |
| GO:004578710 | Esophagus | ESCC | positive regulation of cell cycle | 196/8552 | 313/18723 | 9.27e-10 | 2.24e-08 | 196 |
| GO:19040294 | Esophagus | ESCC | regulation of cyclin-dependent protein kinase activity | 69/8552 | 98/18723 | 6.04e-07 | 7.91e-06 | 69 |
| GO:00000794 | Esophagus | ESCC | regulation of cyclin-dependent protein serine/threonine kinase activity | 66/8552 | 94/18723 | 1.24e-06 | 1.53e-05 | 66 |
| GO:00719029 | Esophagus | ESCC | positive regulation of protein serine/threonine kinase activity | 124/8552 | 200/18723 | 2.27e-06 | 2.61e-05 | 124 |
| GO:004586018 | Esophagus | ESCC | positive regulation of protein kinase activity | 219/8552 | 386/18723 | 6.91e-06 | 6.97e-05 | 219 |
| GO:003367420 | Esophagus | ESCC | positive regulation of kinase activity | 260/8552 | 467/18723 | 7.26e-06 | 7.22e-05 | 260 |
| GO:19040312 | Esophagus | ESCC | positive regulation of cyclin-dependent protein kinase activity | 26/8552 | 33/18723 | 1.06e-04 | 7.43e-04 | 26 |
| Page: 1 2 3 4 5 6 |
| Pathway ID | Tissue | Disease Stage | Description | Gene Ratio | Bg Ratio | pvalue | p.adjust | qvalue | Count |
| hsa052226 | Cervix | CC | Small cell lung cancer | 29/1267 | 92/8465 | 4.38e-05 | 3.09e-04 | 1.83e-04 | 29 |
| hsa0522213 | Cervix | CC | Small cell lung cancer | 29/1267 | 92/8465 | 4.38e-05 | 3.09e-04 | 1.83e-04 | 29 |
| hsa052229 | Esophagus | ESCC | Small cell lung cancer | 69/4205 | 92/8465 | 5.40e-07 | 3.85e-06 | 1.97e-06 | 69 |
| hsa0522216 | Esophagus | ESCC | Small cell lung cancer | 69/4205 | 92/8465 | 5.40e-07 | 3.85e-06 | 1.97e-06 | 69 |
| hsa052224 | Liver | HCC | Small cell lung cancer | 57/4020 | 92/8465 | 3.54e-03 | 1.12e-02 | 6.22e-03 | 57 |
| hsa0522211 | Liver | HCC | Small cell lung cancer | 57/4020 | 92/8465 | 3.54e-03 | 1.12e-02 | 6.22e-03 | 57 |
| hsa052228 | Oral cavity | OSCC | Small cell lung cancer | 66/3704 | 92/8465 | 4.43e-08 | 3.38e-07 | 1.72e-07 | 66 |
| hsa0522215 | Oral cavity | OSCC | Small cell lung cancer | 66/3704 | 92/8465 | 4.43e-08 | 3.38e-07 | 1.72e-07 | 66 |
| hsa0522224 | Oral cavity | LP | Small cell lung cancer | 37/2418 | 92/8465 | 1.04e-02 | 3.72e-02 | 2.40e-02 | 37 |
| hsa0522234 | Oral cavity | LP | Small cell lung cancer | 37/2418 | 92/8465 | 1.04e-02 | 3.72e-02 | 2.40e-02 | 37 |
| hsa052227 | Prostate | BPH | Small cell lung cancer | 38/1718 | 92/8465 | 3.15e-06 | 2.74e-05 | 1.69e-05 | 38 |
| hsa0522214 | Prostate | BPH | Small cell lung cancer | 38/1718 | 92/8465 | 3.15e-06 | 2.74e-05 | 1.69e-05 | 38 |
| hsa0522223 | Prostate | Tumor | Small cell lung cancer | 37/1791 | 92/8465 | 2.38e-05 | 1.83e-04 | 1.13e-04 | 37 |
| hsa0522233 | Prostate | Tumor | Small cell lung cancer | 37/1791 | 92/8465 | 2.38e-05 | 1.83e-04 | 1.13e-04 | 37 |
| Page: 1 |
Top |
Cell-cell communication analysis |
| Identification of potential cell-cell interactions between two cell types and their ligand-receptor pairs for different disease states |
| Ligand | Receptor | LRpair | Pathway | Tissue | Disease Stage |
| Page: 1 |
Top |
Single-cell gene regulatory network inference analysis |
| Find out the significant the regulons (TFs) and the target genes of each regulon across cell types for different disease states |
| TF | Cell Type | Tissue | Disease Stage | Target Gene | RSS | Regulon Activity |
| ∗The dot plots of a searched regulon are shown for all cell subpopulations in each disease state of each tissue based on the regulon specific score inferred using pySCENIC and by calculating the average expression. |
| Page: 1 |
Top |
Somatic mutation of malignant transformation related genes |
| Annotation of somatic variants for genes involved in malignant transformation |
| Hugo Symbol | Variant Class | Variant Classification | dbSNP RS | HGVSc | HGVSp | HGVSp Short | SWISSPROT | BIOTYPE | SIFT | PolyPhen | Tumor Sample Barcode | Tissue | Histology | Sex | Age | Stage | Therapy Types | Drugs | Outcome |
| CKS2 | SNV | Missense_Mutation | novel | c.73N>T | p.Pro25Ser | p.P25S | P33552 | protein_coding | deleterious(0.02) | probably_damaging(0.999) | TCGA-A5-A0G1-01 | Endometrium | uterine corpus endometrioid carcinoma | Female | >=65 | I/II | Unknown | Unknown | SD |
| CKS2 | SNV | Missense_Mutation | novel | c.73N>T | p.Pro25Ser | p.P25S | P33552 | protein_coding | deleterious(0.02) | probably_damaging(0.999) | TCGA-A5-A0GG-01 | Endometrium | uterine corpus endometrioid carcinoma | Female | >=65 | I/II | Unknown | Unknown | SD |
| CKS2 | SNV | Missense_Mutation | novel | c.212N>A | p.Arg71Gln | p.R71Q | P33552 | protein_coding | deleterious(0.03) | benign(0.007) | TCGA-AX-A2HC-01 | Endometrium | uterine corpus endometrioid carcinoma | Female | <65 | III/IV | Chemotherapy | paclitaxel | PD |
| CKS2 | SNV | Missense_Mutation | novel | c.178N>A | p.His60Asn | p.H60N | P33552 | protein_coding | deleterious(0) | possibly_damaging(0.478) | TCGA-EY-A1GI-01 | Endometrium | uterine corpus endometrioid carcinoma | Female | <65 | I/II | Unknown | Unknown | SD |
| CKS2 | deletion | Frame_Shift_Del | novel | c.153_154delNN | p.Leu52ArgfsTer9 | p.L52Rfs*9 | P33552 | protein_coding | TCGA-O2-A52Q-01 | Lung | lung squamous cell carcinoma | Female | <65 | III/IV | Unknown | Unknown | PD | ||
| CKS2 | SNV | Missense_Mutation | c.170N>G | p.Tyr57Cys | p.Y57C | P33552 | protein_coding | deleterious(0) | possibly_damaging(0.88) | TCGA-BR-8680-01 | Stomach | stomach adenocarcinoma | Male | <65 | III/IV | Chemotherapy | oxaliplatin | CR | |
| CKS2 | SNV | Missense_Mutation | novel | c.161G>T | p.Trp54Leu | p.W54L | P33552 | protein_coding | deleterious(0) | possibly_damaging(0.657) | TCGA-DJ-A2QB-01 | Thyroid | thyroid carcinoma | Female | <65 | I/II | Unknown | Unknown | SD |
| Page: 1 |
Top |
Related drugs of malignant transformation related genes |
| Identification of chemicals and drugs interact with genes involved in malignant transfromation |
| (DGIdb 4.0) |
| Entrez ID | Symbol | Category | Interaction Types | Drug Claim Name | Drug Name | PMIDs |
| Page: 1 |

Copyright 2023-Present -The University of Texas Health Science Center at Houston |