
|
|||||
|
 | |
| |
| |
| |
| |
| |
|
Gene: CKS1B |
Gene summary for CKS1B |
| Gene information | Species | Human | Gene symbol | CKS1B | Gene ID | 1163 |
| Gene name | CDC28 protein kinase regulatory subunit 1B | |
| Gene Alias | CKS1 | |
| Cytomap | 1q21.3 | |
| Gene Type | protein-coding | GO ID | GO:0000079 | UniProtAcc | P61024 |
Top |
Malignant transformation analysis |
| Identification of the aberrant gene expression in precancerous and cancerous lesions by comparing the gene expression of stem-like cells in diseased tissues with normal stem cells |
| Entrez ID | Symbol | Replicates | Species | Organ | Tissue | Adj P-value | Log2FC | Malignancy |
| 1163 | CKS1B | GSM4909281 | Human | Breast | IDC | 3.36e-06 | 4.00e-01 | 0.21 |
| 1163 | CKS1B | GSM4909282 | Human | Breast | IDC | 8.72e-41 | 8.35e-01 | -0.0288 |
| 1163 | CKS1B | GSM4909285 | Human | Breast | IDC | 1.37e-17 | 5.61e-01 | 0.21 |
| 1163 | CKS1B | GSM4909287 | Human | Breast | IDC | 4.93e-05 | 3.13e-01 | 0.2057 |
| 1163 | CKS1B | GSM4909290 | Human | Breast | IDC | 2.72e-09 | 4.63e-01 | 0.2096 |
| 1163 | CKS1B | GSM4909294 | Human | Breast | IDC | 1.17e-02 | -6.09e-02 | 0.2022 |
| 1163 | CKS1B | GSM4909295 | Human | Breast | IDC | 6.30e-08 | 4.96e-01 | 0.0898 |
| 1163 | CKS1B | GSM4909296 | Human | Breast | IDC | 4.31e-15 | 1.28e-01 | 0.1524 |
| 1163 | CKS1B | GSM4909297 | Human | Breast | IDC | 3.92e-15 | -2.07e-01 | 0.1517 |
| 1163 | CKS1B | GSM4909307 | Human | Breast | IDC | 5.95e-03 | 1.57e-01 | 0.1569 |
| 1163 | CKS1B | GSM4909309 | Human | Breast | IDC | 2.03e-05 | 2.13e-01 | 0.0483 |
| 1163 | CKS1B | GSM4909311 | Human | Breast | IDC | 1.65e-28 | -1.28e-01 | 0.1534 |
| 1163 | CKS1B | GSM4909312 | Human | Breast | IDC | 1.70e-11 | 7.24e-02 | 0.1552 |
| 1163 | CKS1B | GSM4909318 | Human | Breast | IDC | 2.15e-02 | 2.21e-01 | 0.2031 |
| 1163 | CKS1B | GSM4909319 | Human | Breast | IDC | 1.34e-42 | 6.78e-02 | 0.1563 |
| 1163 | CKS1B | GSM4909320 | Human | Breast | IDC | 1.00e-07 | 4.13e-02 | 0.1575 |
| 1163 | CKS1B | GSM4909321 | Human | Breast | IDC | 1.25e-16 | 2.56e-01 | 0.1559 |
| 1163 | CKS1B | M2 | Human | Breast | IDC | 6.65e-12 | 6.05e-01 | 0.21 |
| 1163 | CKS1B | NCCBC14 | Human | Breast | DCIS | 9.46e-09 | 3.47e-02 | 0.2021 |
| 1163 | CKS1B | NCCBC2 | Human | Breast | DCIS | 2.67e-03 | -5.12e-02 | 0.1554 |
| Page: 1 2 3 4 5 6 7 8 9 10 |
| Tissue | Expression Dynamics | Abbreviation |
| Breast | 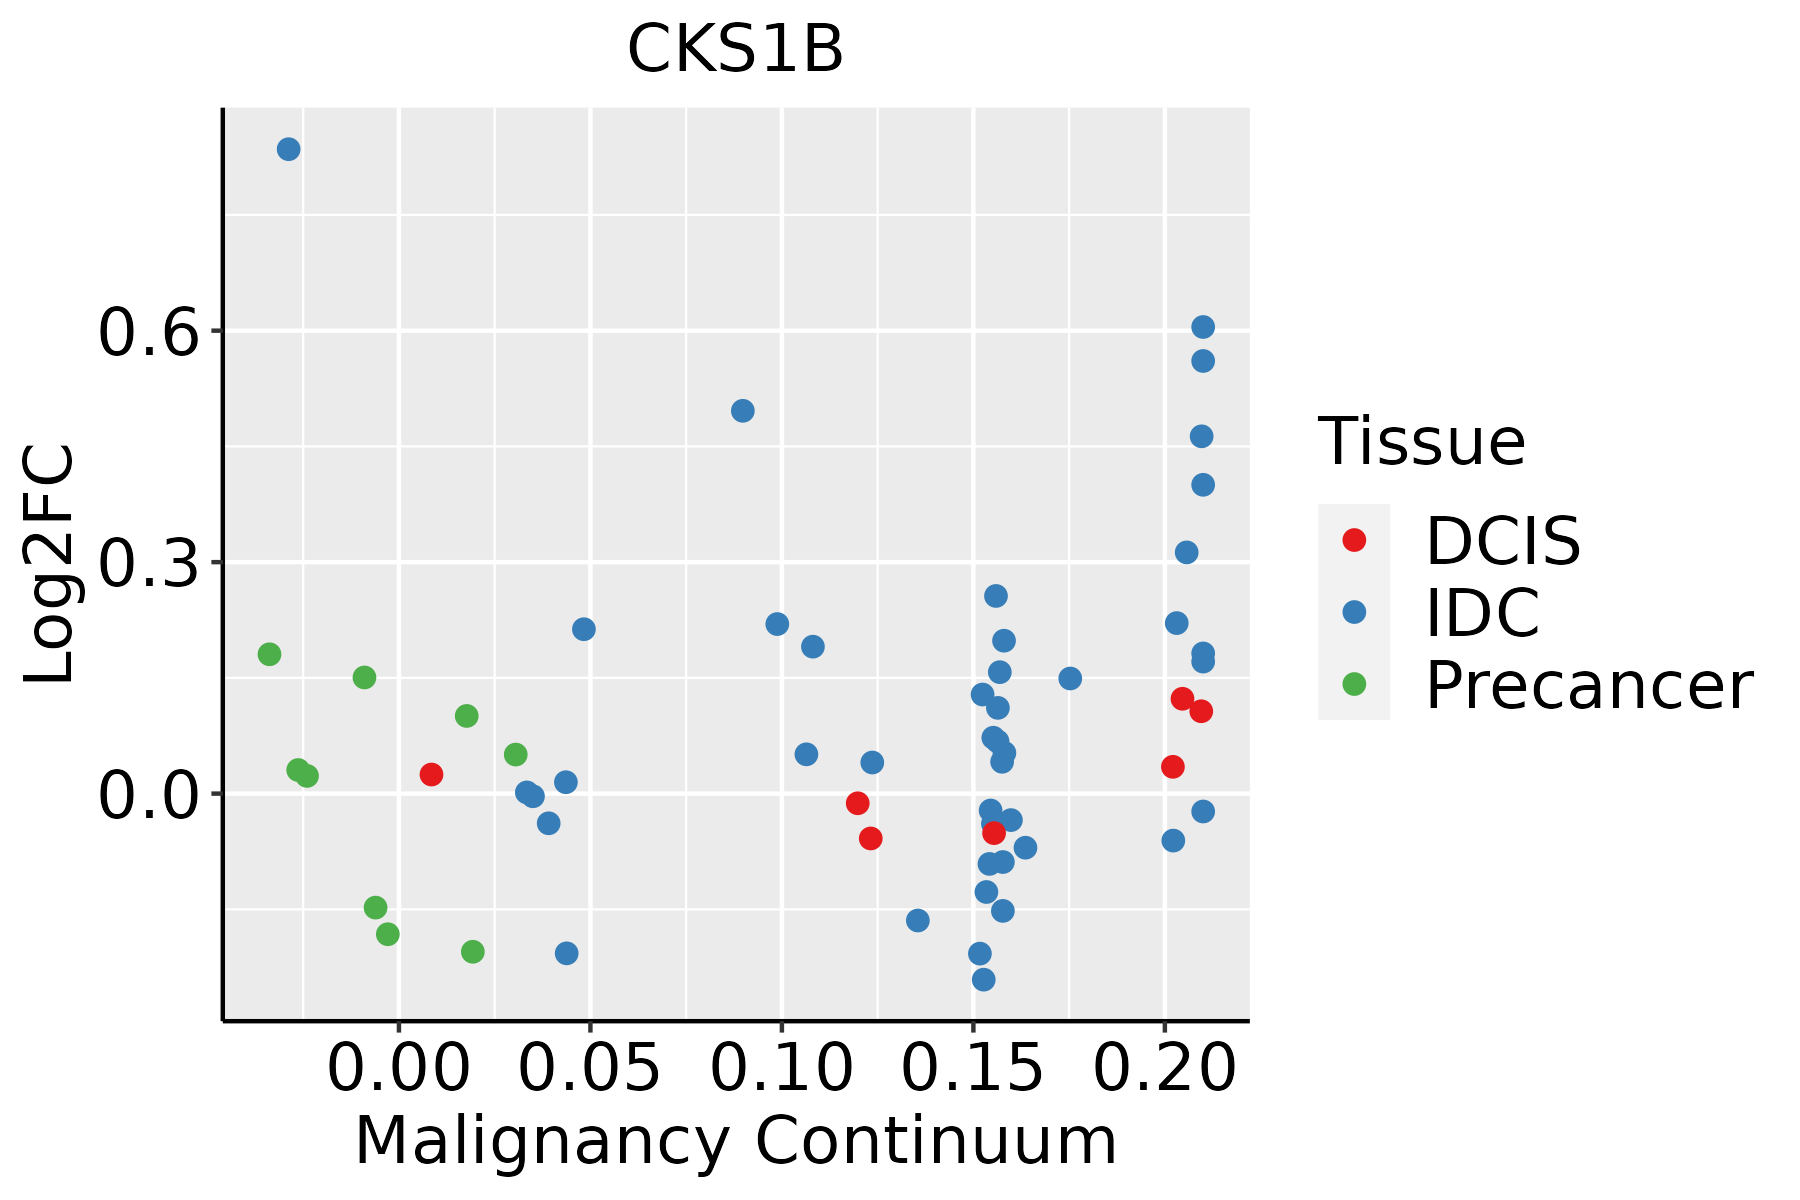 | IDC: Invasive ductal carcinoma |
| DCIS: Ductal carcinoma in situ | ||
| Precancer(BRCA1-mut): Precancerous lesion from BRCA1 mutation carriers | ||
| Colorectum (GSE201348) |  | FAP: Familial adenomatous polyposis |
| CRC: Colorectal cancer | ||
| Colorectum (HTA11) |  | AD: Adenomas |
| SER: Sessile serrated lesions | ||
| MSI-H: Microsatellite-high colorectal cancer | ||
| MSS: Microsatellite stable colorectal cancer | ||
| Esophagus | 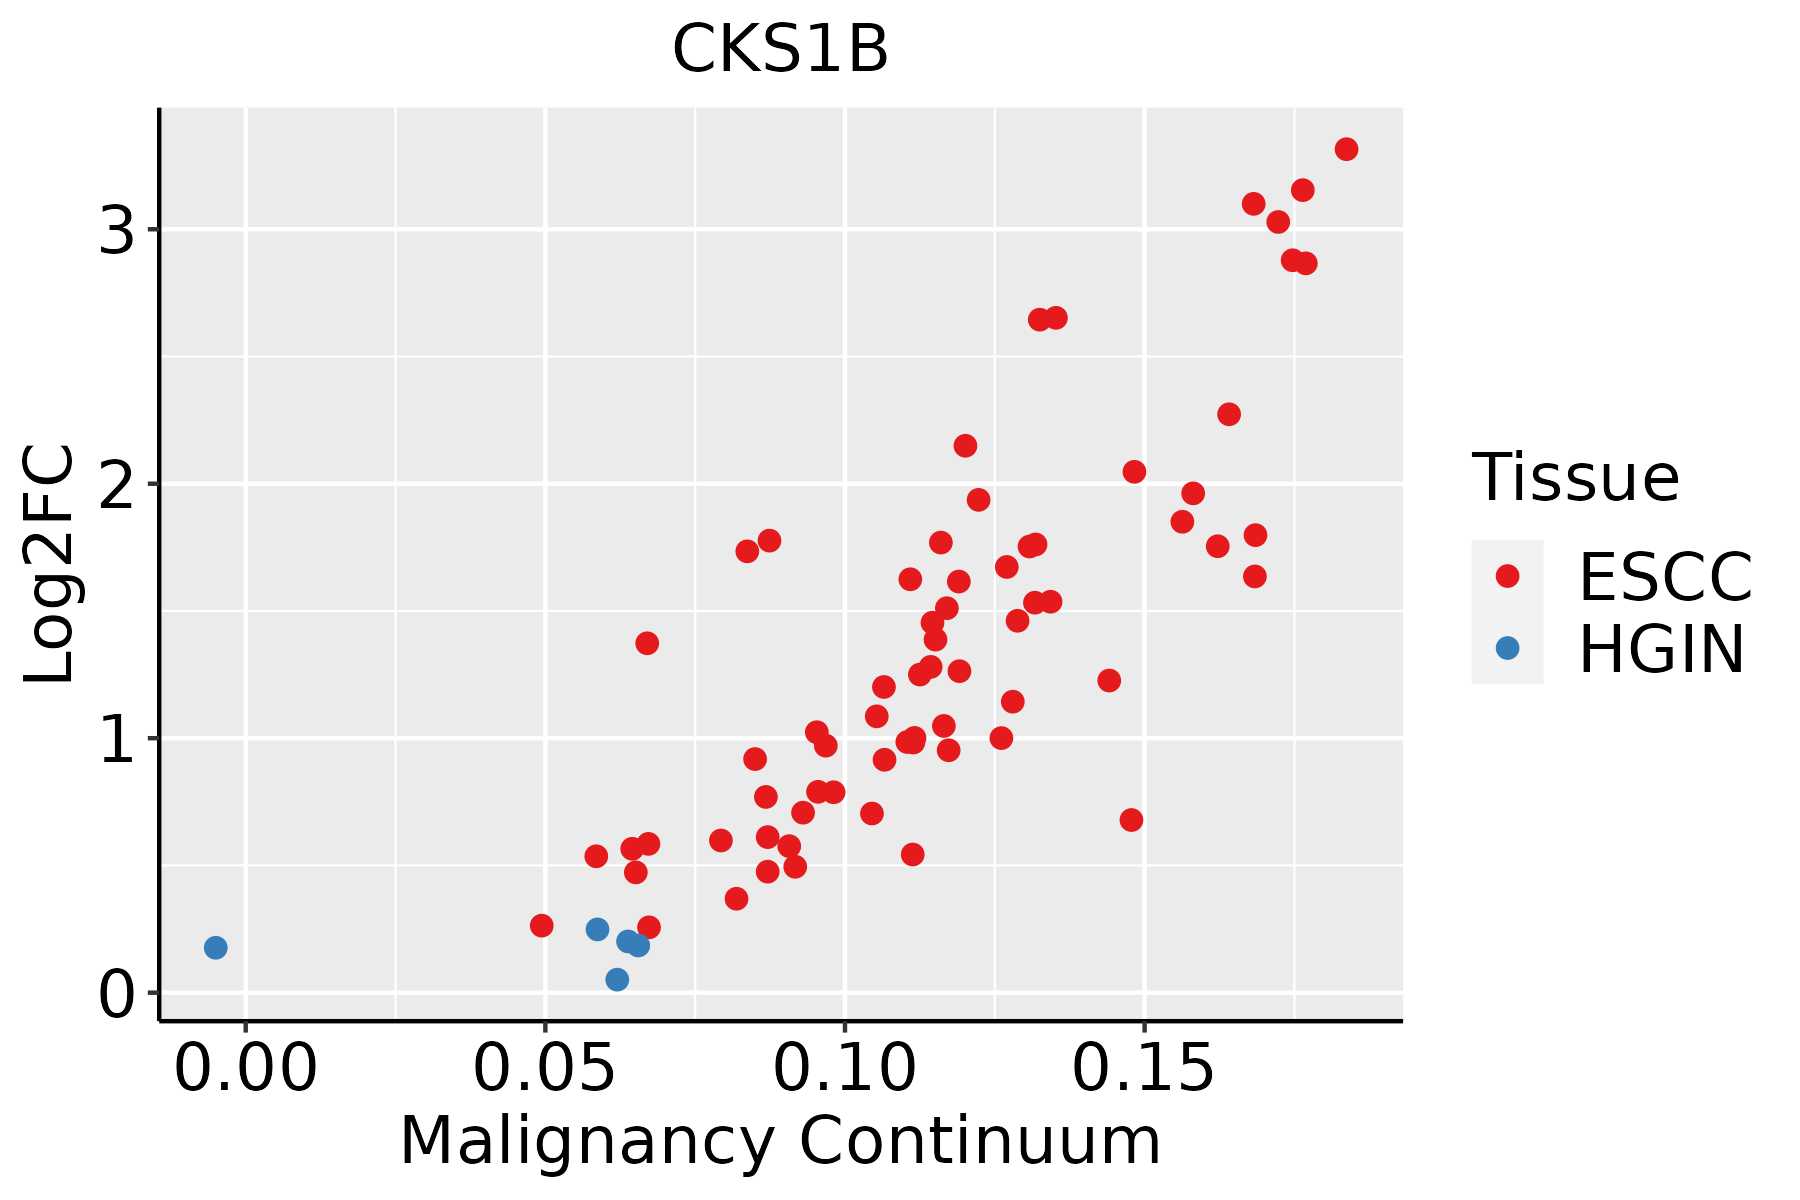 | ESCC: Esophageal squamous cell carcinoma |
| HGIN: High-grade intraepithelial neoplasias | ||
| LGIN: Low-grade intraepithelial neoplasias | ||
| Liver |  | HCC: Hepatocellular carcinoma |
| NAFLD: Non-alcoholic fatty liver disease | ||
| Oral Cavity | 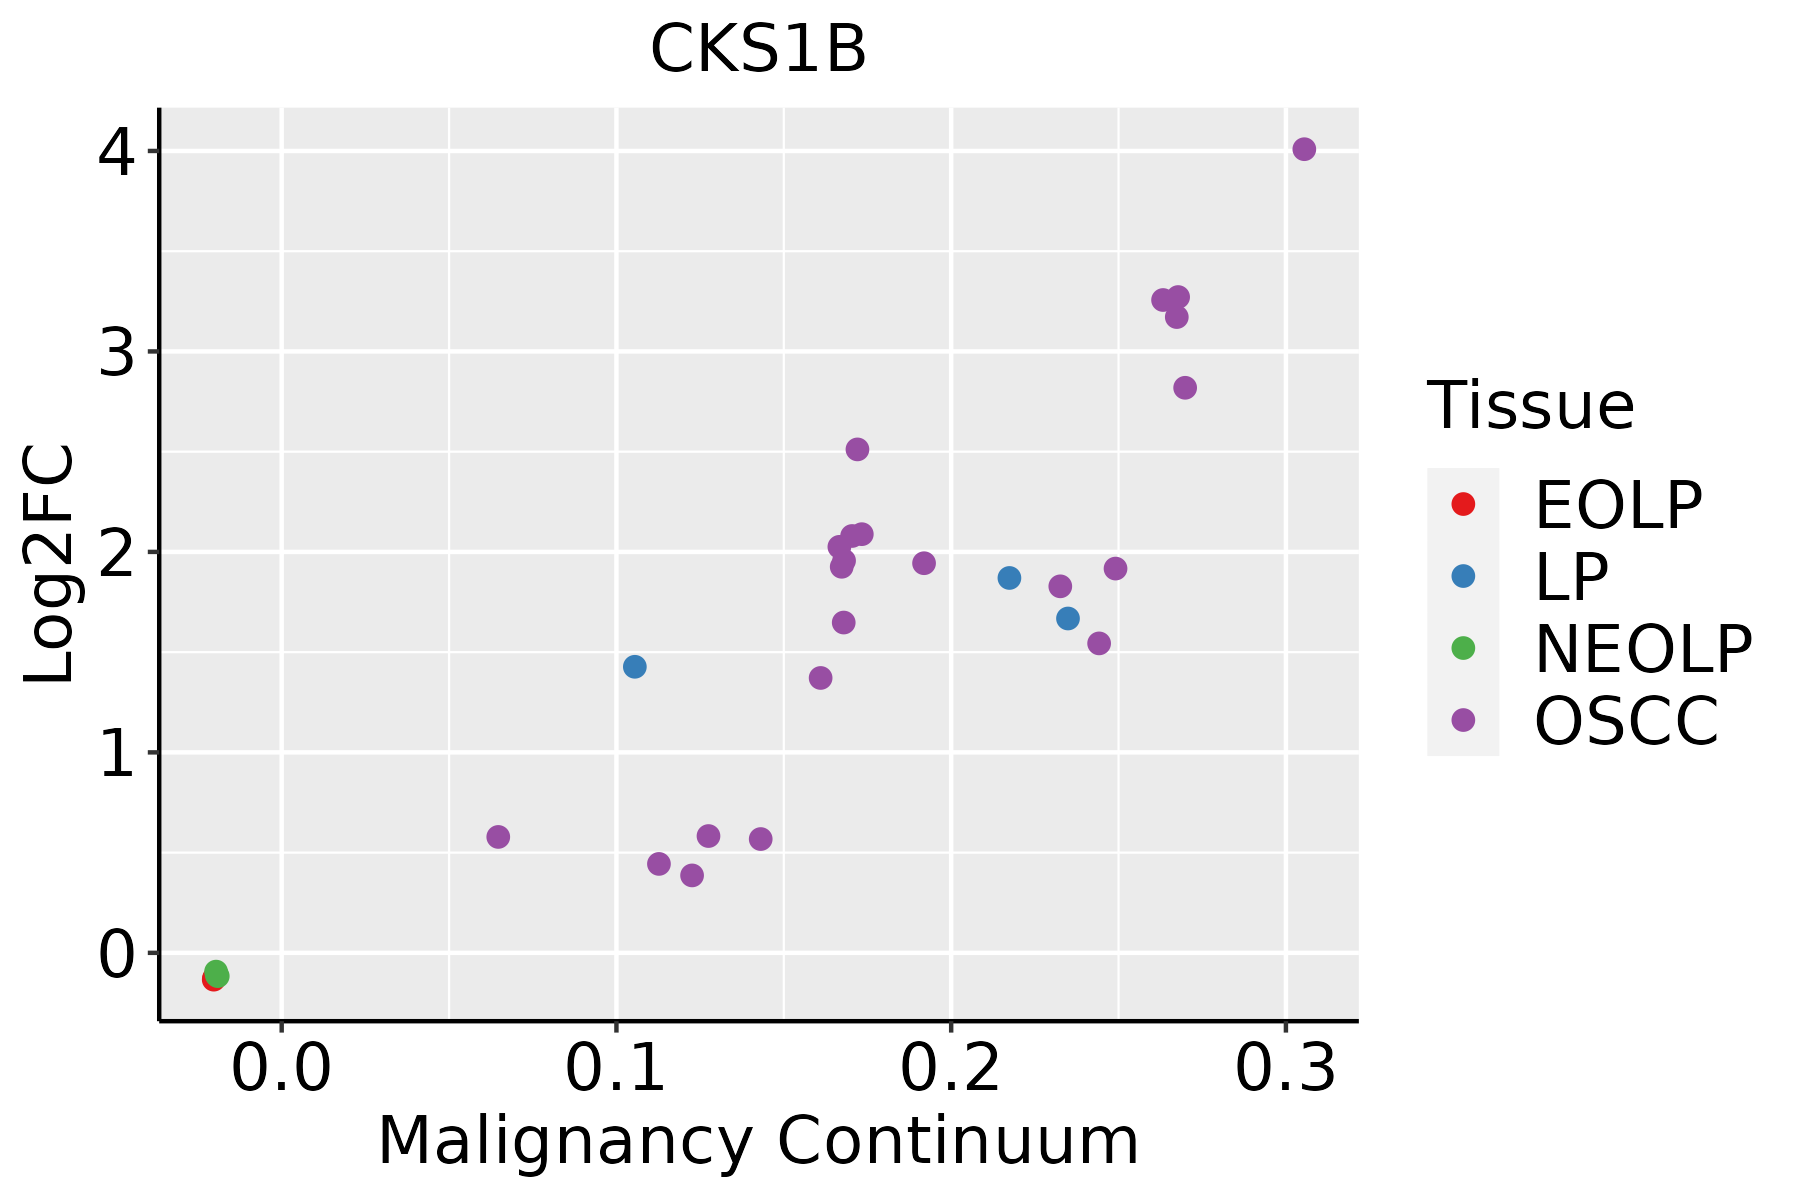 | EOLP: Erosive Oral lichen planus |
| LP: leukoplakia | ||
| NEOLP: Non-erosive oral lichen planus | ||
| OSCC: Oral squamous cell carcinoma | ||
| Skin |  | AK: Actinic keratosis |
| cSCC: Cutaneous squamous cell carcinoma | ||
| SCCIS:squamous cell carcinoma in situ | ||
| Thyroid | 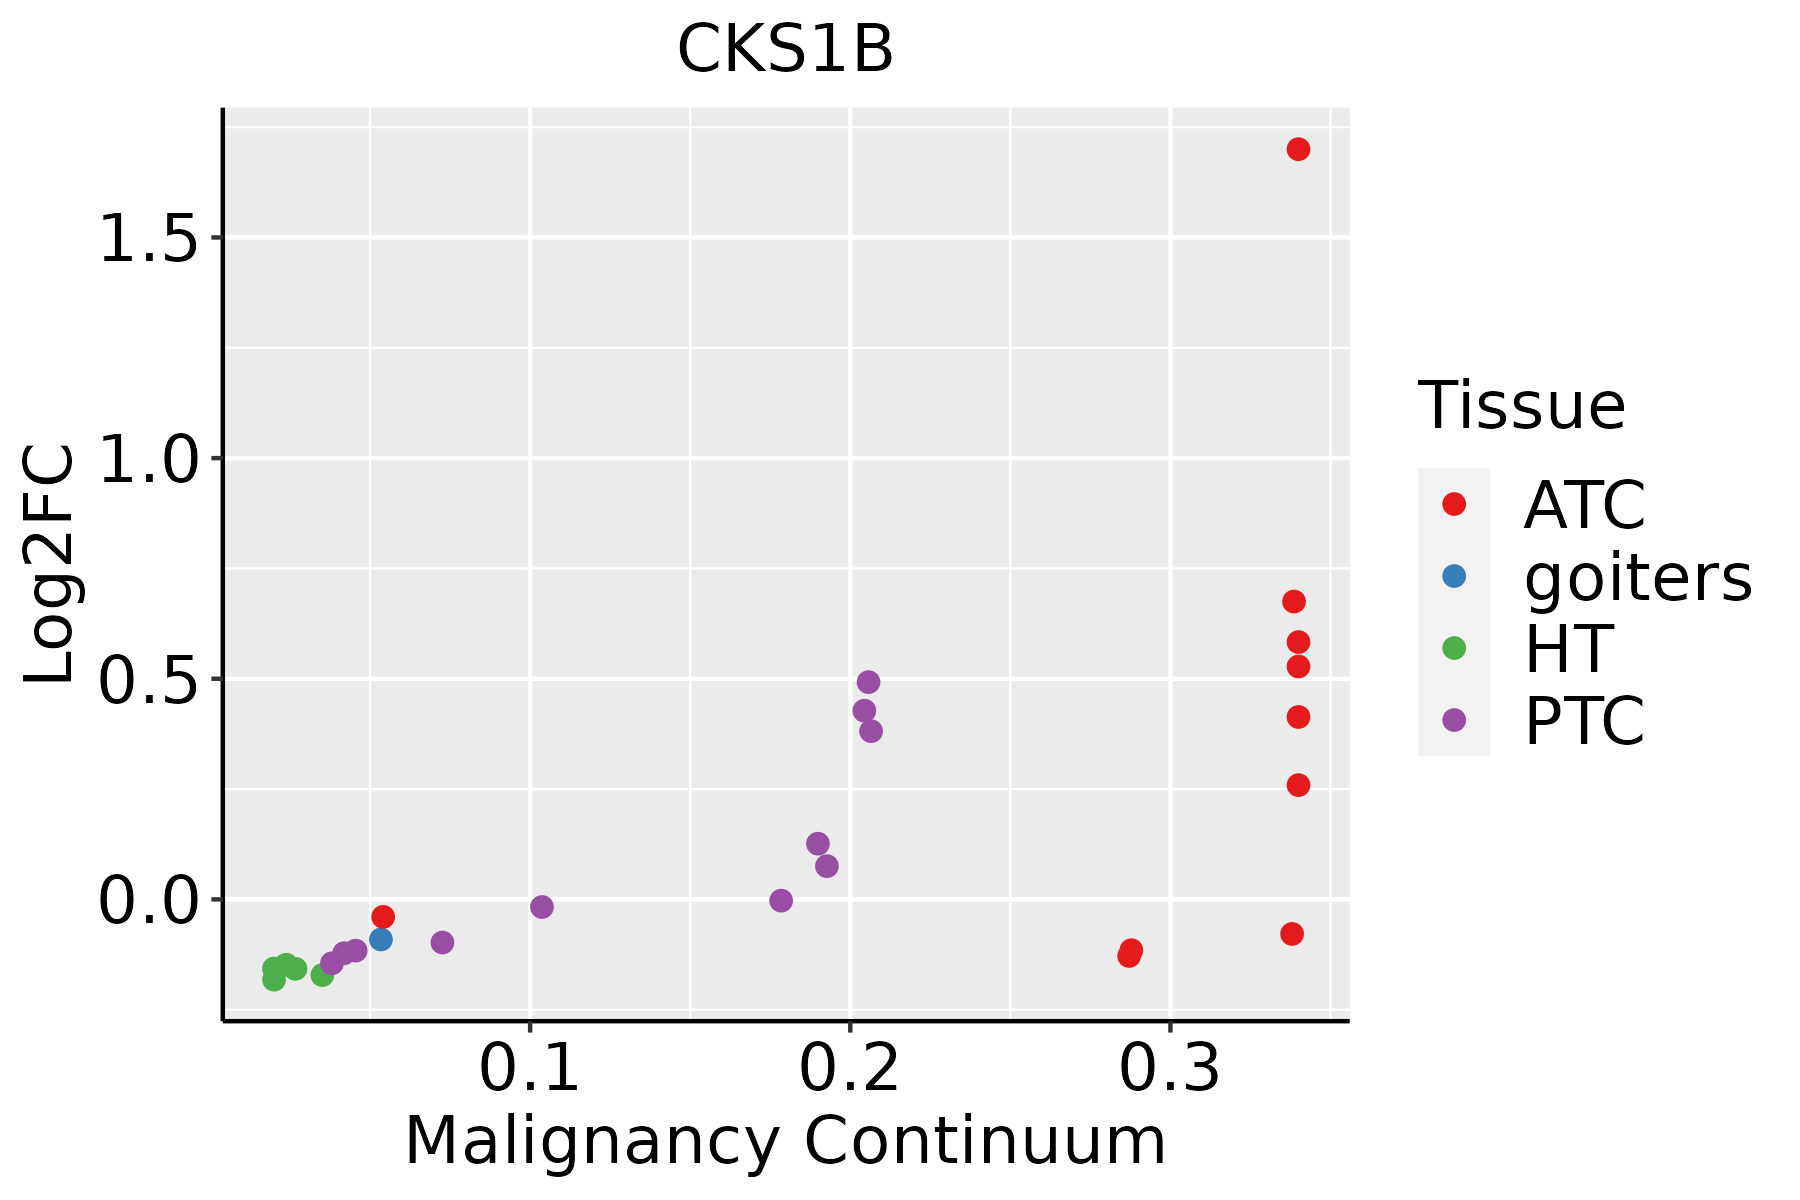 | ATC: Anaplastic thyroid cancer |
| HT: Hashimoto's thyroiditis | ||
| PTC: Papillary thyroid cancer |
| ∗log2FC in expression of this searched gene in stem-like cells from each diseased tissue sample relative to stem-like cells in normal samples in each tissue plotted against the malignancy continuum. Samples are colored based on if they are from different disease stage. |
Top |
Malignant transformation related pathway analysis |
| Find out the enriched GO biological processes and KEGG pathways involved in transition from healthy to precancer to cancer |
| Tissue | Disease Stage | Enriched GO biological Processes |
| Colorectum | AD |  |
| Colorectum | SER |  |
| Colorectum | MSS |  |
| Colorectum | MSI-H |  |
| Colorectum | FAP |  |
| ∗Top 15 enriched GO BP terms are showed in the bar plot of each disease state in each tissue. Each row represents a significant GO biological process which is colored according to the -log10(p.adjust). |
| Page: 1 2 3 4 5 6 7 8 9 |
| GO ID | Tissue | Disease Stage | Description | Gene Ratio | Bg Ratio | pvalue | p.adjust | Count |
| GO:00073465 | Breast | IDC | regulation of mitotic cell cycle | 51/1434 | 457/18723 | 4.30e-03 | 3.35e-02 | 51 |
| GO:000734612 | Breast | DCIS | regulation of mitotic cell cycle | 52/1390 | 457/18723 | 1.38e-03 | 1.43e-02 | 52 |
| GO:0033674 | Colorectum | AD | positive regulation of kinase activity | 131/3918 | 467/18723 | 1.28e-04 | 1.85e-03 | 131 |
| GO:0045860 | Colorectum | AD | positive regulation of protein kinase activity | 107/3918 | 386/18723 | 8.01e-04 | 7.92e-03 | 107 |
| GO:0071900 | Colorectum | AD | regulation of protein serine/threonine kinase activity | 98/3918 | 359/18723 | 2.18e-03 | 1.73e-02 | 98 |
| GO:0071902 | Colorectum | AD | positive regulation of protein serine/threonine kinase activity | 58/3918 | 200/18723 | 4.09e-03 | 2.84e-02 | 58 |
| GO:0007346 | Colorectum | AD | regulation of mitotic cell cycle | 119/3918 | 457/18723 | 4.60e-03 | 3.14e-02 | 119 |
| GO:0045787 | Colorectum | AD | positive regulation of cell cycle | 85/3918 | 313/18723 | 4.76e-03 | 3.22e-02 | 85 |
| GO:00336741 | Colorectum | SER | positive regulation of kinase activity | 95/2897 | 467/18723 | 2.62e-03 | 2.41e-02 | 95 |
| GO:00458601 | Colorectum | SER | positive regulation of protein kinase activity | 79/2897 | 386/18723 | 4.85e-03 | 3.79e-02 | 79 |
| GO:00719001 | Colorectum | SER | regulation of protein serine/threonine kinase activity | 74/2897 | 359/18723 | 5.22e-03 | 3.96e-02 | 74 |
| GO:00336742 | Colorectum | MSS | positive regulation of kinase activity | 122/3467 | 467/18723 | 2.50e-05 | 5.21e-04 | 122 |
| GO:00458602 | Colorectum | MSS | positive regulation of protein kinase activity | 102/3467 | 386/18723 | 6.93e-05 | 1.20e-03 | 102 |
| GO:00719002 | Colorectum | MSS | regulation of protein serine/threonine kinase activity | 93/3467 | 359/18723 | 2.98e-04 | 3.91e-03 | 93 |
| GO:00719021 | Colorectum | MSS | positive regulation of protein serine/threonine kinase activity | 55/3467 | 200/18723 | 1.12e-03 | 1.11e-02 | 55 |
| GO:00457871 | Colorectum | MSS | positive regulation of cell cycle | 80/3467 | 313/18723 | 1.15e-03 | 1.12e-02 | 80 |
| GO:00073461 | Colorectum | MSS | regulation of mitotic cell cycle | 108/3467 | 457/18723 | 3.30e-03 | 2.50e-02 | 108 |
| GO:00336743 | Colorectum | MSI-H | positive regulation of kinase activity | 53/1319 | 467/18723 | 3.99e-04 | 8.98e-03 | 53 |
| GO:00458603 | Colorectum | MSI-H | positive regulation of protein kinase activity | 45/1319 | 386/18723 | 6.03e-04 | 1.19e-02 | 45 |
| GO:000734610 | Esophagus | HGIN | regulation of mitotic cell cycle | 98/2587 | 457/18723 | 4.39e-06 | 1.42e-04 | 98 |
| Page: 1 2 3 4 5 |
| Pathway ID | Tissue | Disease Stage | Description | Gene Ratio | Bg Ratio | pvalue | p.adjust | qvalue | Count |
| hsa05222 | Colorectum | MSS | Small cell lung cancer | 30/1875 | 92/8465 | 1.31e-02 | 4.30e-02 | 2.64e-02 | 30 |
| hsa052221 | Colorectum | MSS | Small cell lung cancer | 30/1875 | 92/8465 | 1.31e-02 | 4.30e-02 | 2.64e-02 | 30 |
| hsa052229 | Esophagus | ESCC | Small cell lung cancer | 69/4205 | 92/8465 | 5.40e-07 | 3.85e-06 | 1.97e-06 | 69 |
| hsa0522216 | Esophagus | ESCC | Small cell lung cancer | 69/4205 | 92/8465 | 5.40e-07 | 3.85e-06 | 1.97e-06 | 69 |
| hsa052224 | Liver | HCC | Small cell lung cancer | 57/4020 | 92/8465 | 3.54e-03 | 1.12e-02 | 6.22e-03 | 57 |
| hsa0522211 | Liver | HCC | Small cell lung cancer | 57/4020 | 92/8465 | 3.54e-03 | 1.12e-02 | 6.22e-03 | 57 |
| hsa052228 | Oral cavity | OSCC | Small cell lung cancer | 66/3704 | 92/8465 | 4.43e-08 | 3.38e-07 | 1.72e-07 | 66 |
| hsa0522215 | Oral cavity | OSCC | Small cell lung cancer | 66/3704 | 92/8465 | 4.43e-08 | 3.38e-07 | 1.72e-07 | 66 |
| hsa0522224 | Oral cavity | LP | Small cell lung cancer | 37/2418 | 92/8465 | 1.04e-02 | 3.72e-02 | 2.40e-02 | 37 |
| hsa0522234 | Oral cavity | LP | Small cell lung cancer | 37/2418 | 92/8465 | 1.04e-02 | 3.72e-02 | 2.40e-02 | 37 |
| Page: 1 |
Top |
Cell-cell communication analysis |
| Identification of potential cell-cell interactions between two cell types and their ligand-receptor pairs for different disease states |
| Ligand | Receptor | LRpair | Pathway | Tissue | Disease Stage |
| Page: 1 |
Top |
Single-cell gene regulatory network inference analysis |
| Find out the significant the regulons (TFs) and the target genes of each regulon across cell types for different disease states |
| TF | Cell Type | Tissue | Disease Stage | Target Gene | RSS | Regulon Activity |
| ∗The dot plots of a searched regulon are shown for all cell subpopulations in each disease state of each tissue based on the regulon specific score inferred using pySCENIC and by calculating the average expression. |
| Page: 1 |
Top |
Somatic mutation of malignant transformation related genes |
| Annotation of somatic variants for genes involved in malignant transformation |
| Hugo Symbol | Variant Class | Variant Classification | dbSNP RS | HGVSc | HGVSp | HGVSp Short | SWISSPROT | BIOTYPE | SIFT | PolyPhen | Tumor Sample Barcode | Tissue | Histology | Sex | Age | Stage | Therapy Types | Drugs | Outcome |
| CKS1B | SNV | Missense_Mutation | novel | c.110N>G | p.Leu37Arg | p.L37R | P61024 | protein_coding | deleterious(0) | probably_damaging(0.99) | TCGA-B6-A409-01 | Breast | breast invasive carcinoma | Female | <65 | III/IV | Chemotherapy | cyclophosphamide | PD |
| CKS1B | SNV | Missense_Mutation | c.15A>C | p.Gln5His | p.Q5H | P61024 | protein_coding | deleterious(0.02) | benign(0.037) | TCGA-AA-3977-01 | Colorectum | colon adenocarcinoma | Male | >=65 | I/II | Unknown | Unknown | SD | |
| CKS1B | SNV | Missense_Mutation | rs774750947 | c.208N>T | p.Arg70Trp | p.R70W | P61024 | protein_coding | deleterious(0.03) | benign(0) | TCGA-AZ-4313-01 | Colorectum | colon adenocarcinoma | Female | <65 | I/II | Unknown | Unknown | SD |
| CKS1B | SNV | Missense_Mutation | novel | c.29A>G | p.Asp10Gly | p.D10G | P61024 | protein_coding | deleterious(0.01) | possibly_damaging(0.848) | TCGA-F5-6814-01 | Colorectum | rectum adenocarcinoma | Male | <65 | I/II | Unknown | Unknown | SD |
| CKS1B | SNV | Missense_Mutation | novel | c.136C>A | p.Leu46Ile | p.L46I | P61024 | protein_coding | tolerated(0.22) | benign(0.078) | TCGA-AX-A2HC-01 | Endometrium | uterine corpus endometrioid carcinoma | Female | <65 | III/IV | Chemotherapy | paclitaxel | PD |
| CKS1B | SNV | Missense_Mutation | c.15N>C | p.Gln5His | p.Q5H | P61024 | protein_coding | deleterious(0.02) | benign(0.037) | TCGA-BK-A6W3-01 | Endometrium | uterine corpus endometrioid carcinoma | Female | <65 | I/II | Unknown | Unknown | SD | |
| CKS1B | SNV | Missense_Mutation | novel | c.134N>C | p.Asn45Thr | p.N45T | P61024 | protein_coding | tolerated(0.31) | benign(0.253) | TCGA-EO-A3AY-01 | Endometrium | uterine corpus endometrioid carcinoma | Female | <65 | I/II | Unknown | Unknown | PD |
| CKS1B | SNV | Missense_Mutation | novel | c.140N>A | p.Gly47Asp | p.G47D | P61024 | protein_coding | deleterious(0) | probably_damaging(1) | TCGA-5C-A9VG-01 | Liver | liver hepatocellular carcinoma | Male | <65 | I/II | Unknown | Unknown | SD |
| CKS1B | SNV | Missense_Mutation | c.20N>G | p.Tyr7Cys | p.Y7C | P61024 | protein_coding | tolerated(0.07) | benign(0.086) | TCGA-66-2758-01 | Lung | lung squamous cell carcinoma | Male | >=65 | I/II | Chemotherapy | cisplatin | CR | |
| CKS1B | SNV | Missense_Mutation | novel | c.43N>A | p.Glu15Lys | p.E15K | P61024 | protein_coding | tolerated(0.13) | benign(0.04) | TCGA-CV-7243-01 | Oral cavity | head & neck squamous cell carcinoma | Male | <65 | III/IV | Unknown | Unknown | SD |
| Page: 1 2 |
Top |
Related drugs of malignant transformation related genes |
| Identification of chemicals and drugs interact with genes involved in malignant transfromation |
| (DGIdb 4.0) |
| Entrez ID | Symbol | Category | Interaction Types | Drug Claim Name | Drug Name | PMIDs |
| Page: 1 |

Copyright 2023-Present -The University of Texas Health Science Center at Houston |