
|
|||||
|
 | |
| |
| |
| |
| |
| |
|
Gene: CKMT1B |
Gene summary for CKMT1B |
| Gene information | Species | Human | Gene symbol | CKMT1B | Gene ID | 1159 |
| Gene name | creatine kinase, mitochondrial 1B | |
| Gene Alias | CKMT | |
| Cytomap | 15q15.3 | |
| Gene Type | protein-coding | GO ID | GO:0006575 | UniProtAcc | P12532 |
Top |
Malignant transformation analysis |
| Identification of the aberrant gene expression in precancerous and cancerous lesions by comparing the gene expression of stem-like cells in diseased tissues with normal stem cells |
| Entrez ID | Symbol | Replicates | Species | Organ | Tissue | Adj P-value | Log2FC | Malignancy |
| 1159 | CKMT1B | HTA11_2487_2000001011 | Human | Colorectum | SER | 4.10e-08 | 4.32e-01 | -0.1808 |
| 1159 | CKMT1B | HTA11_1938_2000001011 | Human | Colorectum | AD | 1.88e-15 | 5.95e-01 | -0.0811 |
| 1159 | CKMT1B | HTA11_78_2000001011 | Human | Colorectum | AD | 6.19e-07 | 3.74e-01 | -0.1088 |
| 1159 | CKMT1B | HTA11_347_2000001011 | Human | Colorectum | AD | 1.71e-28 | 6.65e-01 | -0.1954 |
| 1159 | CKMT1B | HTA11_2112_2000001011 | Human | Colorectum | SER | 2.59e-02 | 4.04e-01 | -0.2196 |
| 1159 | CKMT1B | HTA11_3361_2000001011 | Human | Colorectum | AD | 4.08e-14 | 5.51e-01 | -0.1207 |
| 1159 | CKMT1B | HTA11_83_2000001011 | Human | Colorectum | SER | 7.53e-15 | 6.33e-01 | -0.1526 |
| 1159 | CKMT1B | HTA11_696_2000001011 | Human | Colorectum | AD | 8.84e-25 | 6.10e-01 | -0.1464 |
| 1159 | CKMT1B | HTA11_866_2000001011 | Human | Colorectum | AD | 3.62e-04 | 2.15e-01 | -0.1001 |
| 1159 | CKMT1B | HTA11_1391_2000001011 | Human | Colorectum | AD | 3.54e-16 | 5.37e-01 | -0.059 |
| 1159 | CKMT1B | HTA11_5212_2000001011 | Human | Colorectum | AD | 6.92e-03 | 4.21e-01 | -0.2061 |
| 1159 | CKMT1B | HTA11_546_2000001011 | Human | Colorectum | AD | 4.73e-04 | 3.38e-01 | -0.0842 |
| 1159 | CKMT1B | HTA11_4255_2000001011 | Human | Colorectum | SER | 7.05e-05 | 4.79e-01 | 0.0446 |
| 1159 | CKMT1B | HTA11_8622_2000001021 | Human | Colorectum | SER | 2.06e-02 | 2.92e-01 | 0.0528 |
| 1159 | CKMT1B | HTA11_10623_2000001011 | Human | Colorectum | AD | 4.88e-03 | 4.03e-01 | -0.0177 |
| 1159 | CKMT1B | HTA11_99999970781_79442 | Human | Colorectum | MSS | 1.79e-05 | 2.75e-01 | 0.294 |
| 1159 | CKMT1B | HTA11_99999965104_69814 | Human | Colorectum | MSS | 3.18e-16 | 6.13e-01 | 0.281 |
| 1159 | CKMT1B | P4T-E | Human | Esophagus | ESCC | 3.14e-05 | 7.59e-02 | 0.1323 |
| 1159 | CKMT1B | P9T-E | Human | Esophagus | ESCC | 9.75e-13 | 2.38e-01 | 0.1131 |
| 1159 | CKMT1B | P10T-E | Human | Esophagus | ESCC | 8.10e-40 | 7.11e-01 | 0.116 |
| Page: 1 2 3 |
| Tissue | Expression Dynamics | Abbreviation |
| Colorectum (GSE201348) | 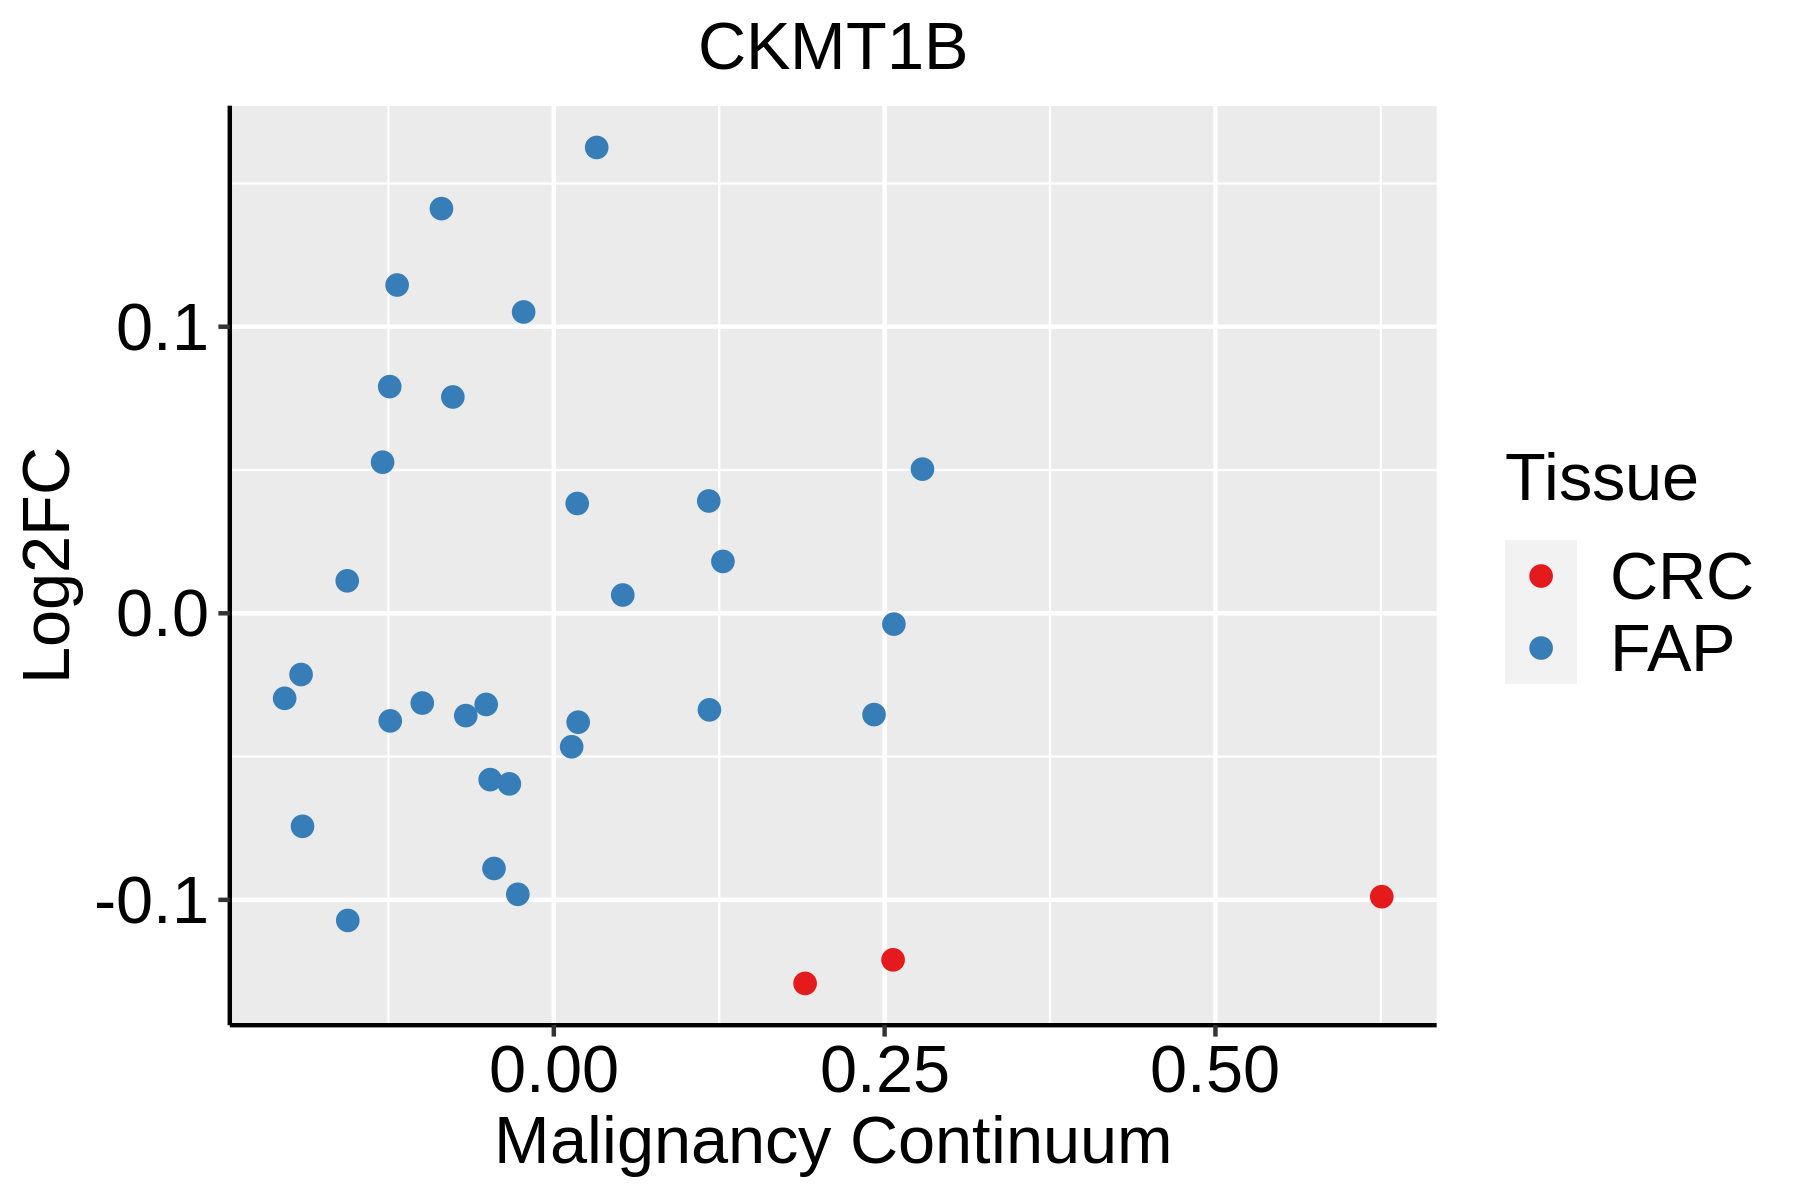 | FAP: Familial adenomatous polyposis |
| CRC: Colorectal cancer | ||
| Colorectum (HTA11) | 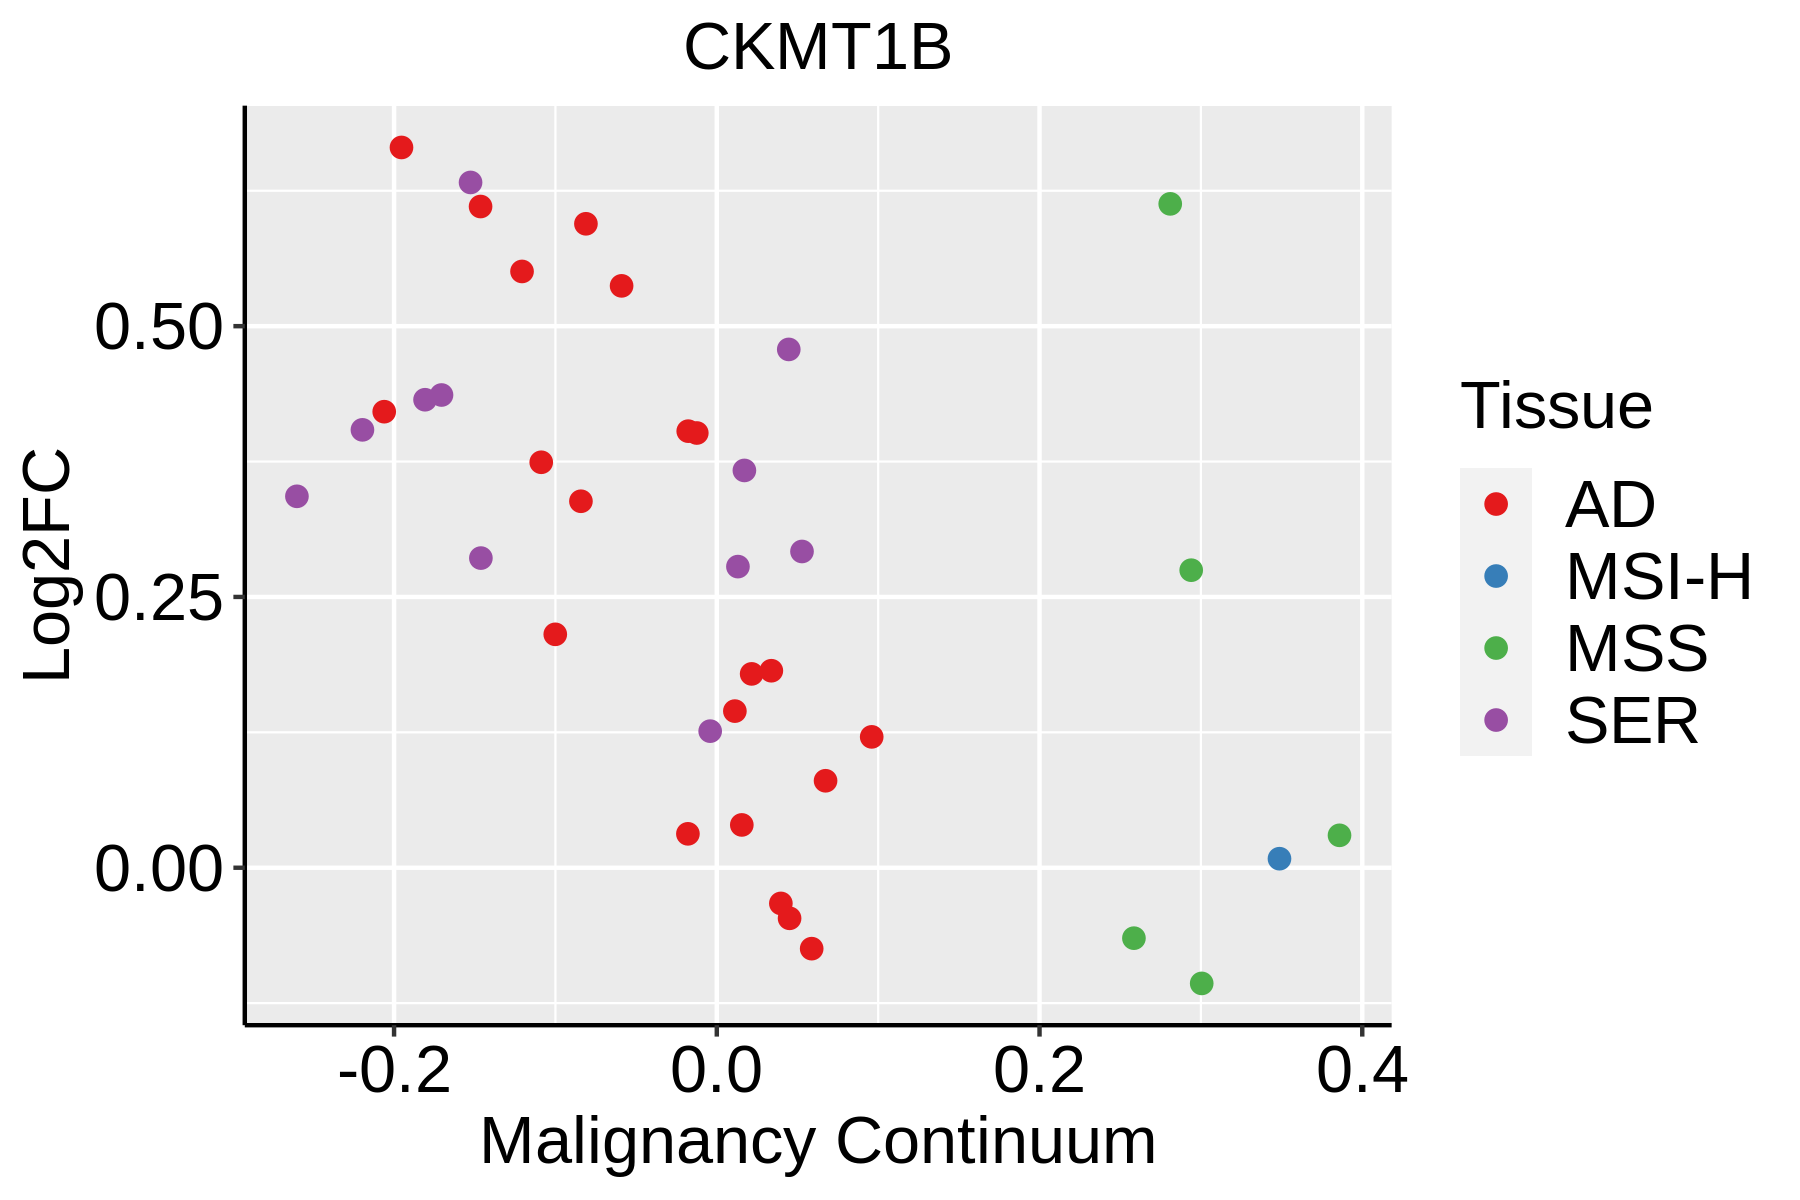 | AD: Adenomas |
| SER: Sessile serrated lesions | ||
| MSI-H: Microsatellite-high colorectal cancer | ||
| MSS: Microsatellite stable colorectal cancer | ||
| Esophagus |  | ESCC: Esophageal squamous cell carcinoma |
| HGIN: High-grade intraepithelial neoplasias | ||
| LGIN: Low-grade intraepithelial neoplasias | ||
| Oral Cavity | 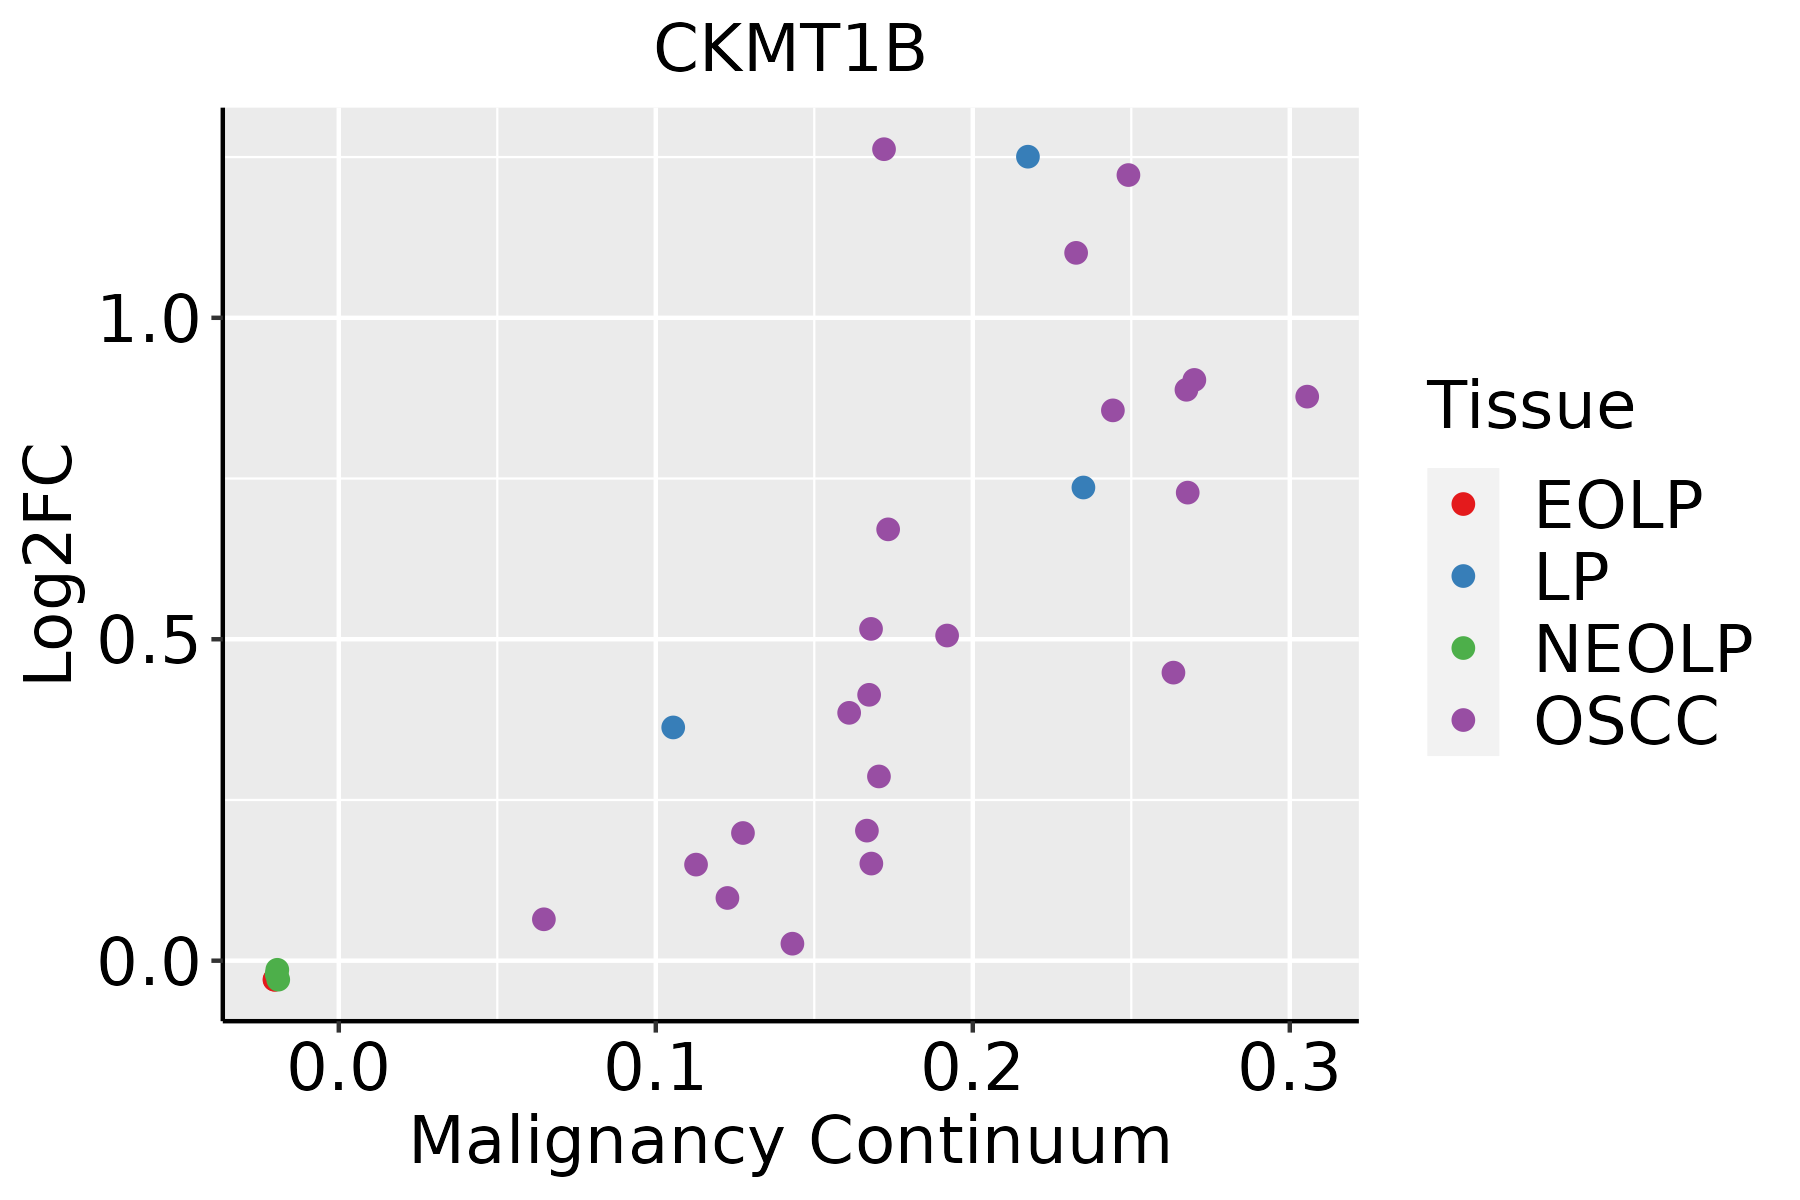 | EOLP: Erosive Oral lichen planus |
| LP: leukoplakia | ||
| NEOLP: Non-erosive oral lichen planus | ||
| OSCC: Oral squamous cell carcinoma | ||
| Skin | 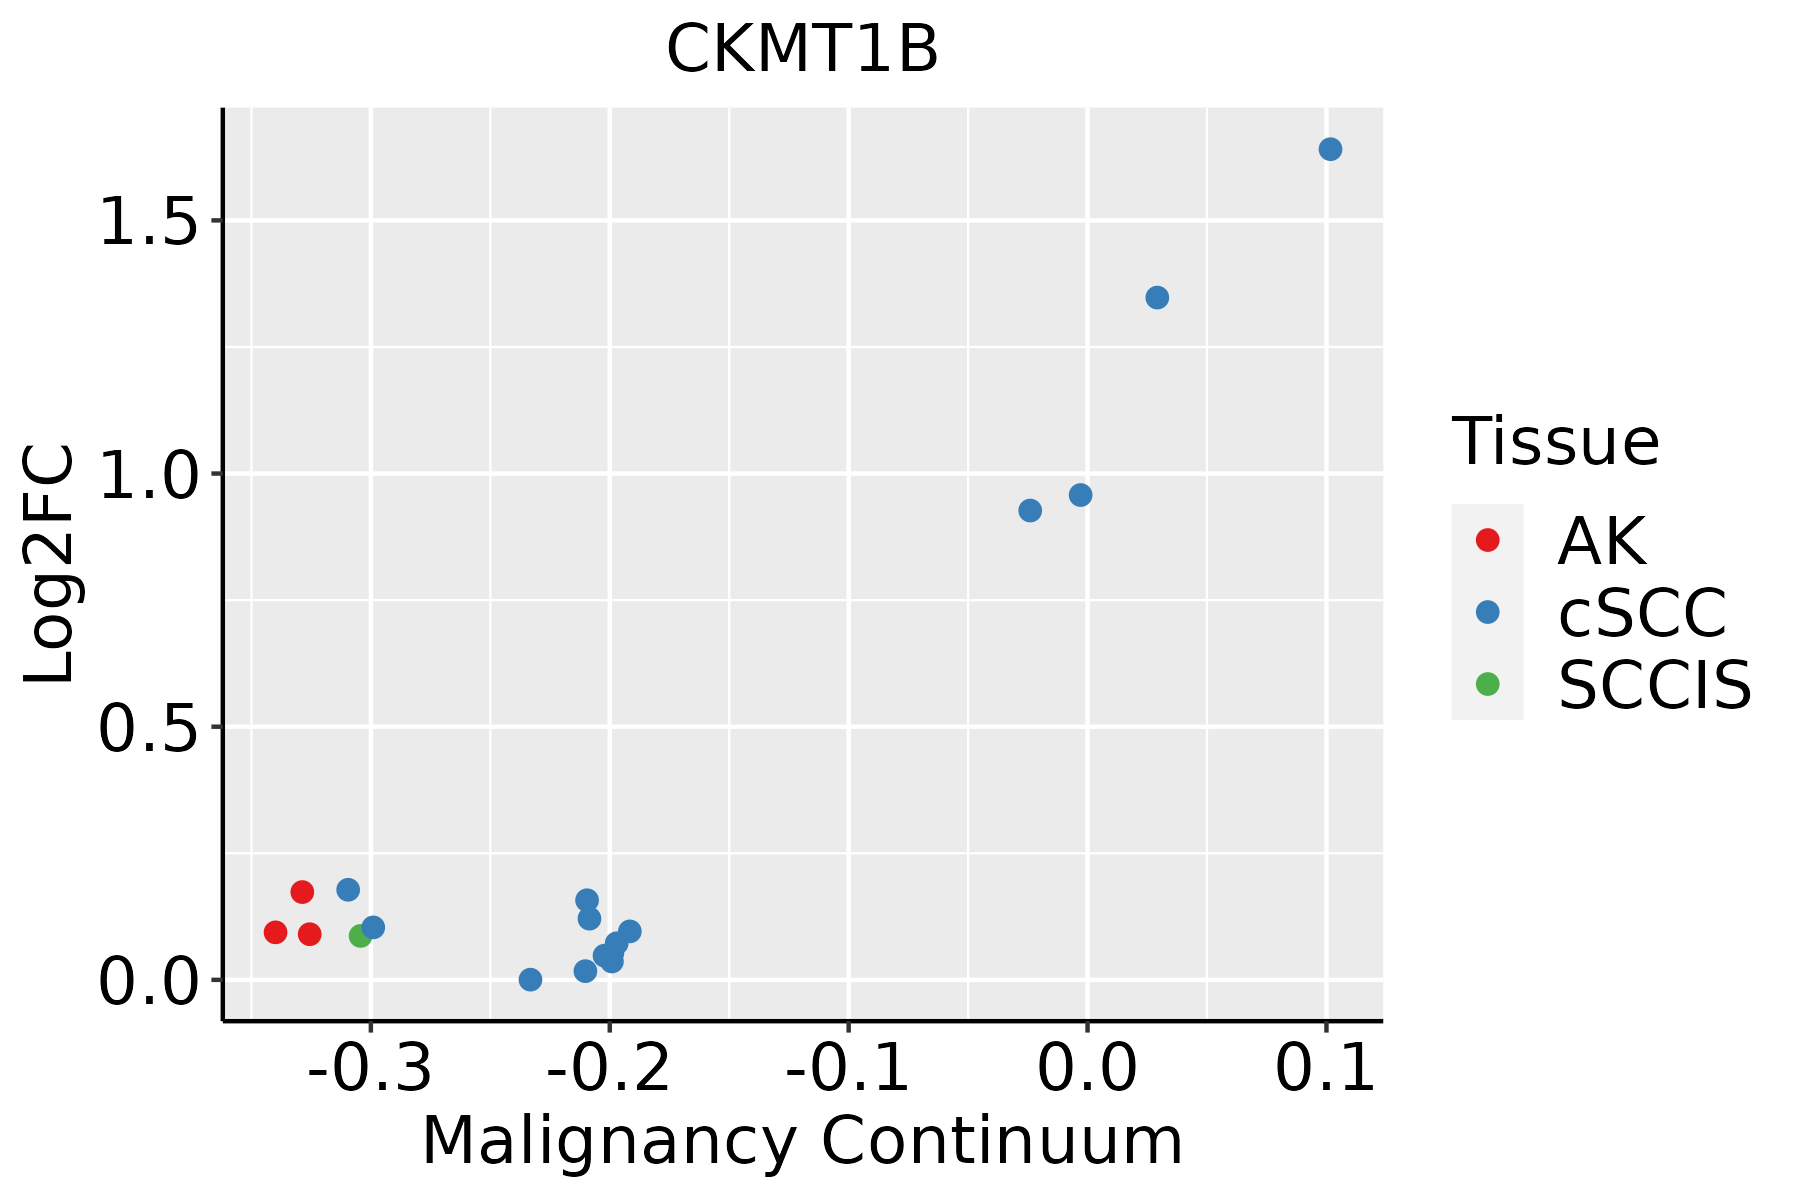 | AK: Actinic keratosis |
| cSCC: Cutaneous squamous cell carcinoma | ||
| SCCIS:squamous cell carcinoma in situ |
| ∗log2FC in expression of this searched gene in stem-like cells from each diseased tissue sample relative to stem-like cells in normal samples in each tissue plotted against the malignancy continuum. Samples are colored based on if they are from different disease stage. |
Top |
Malignant transformation related pathway analysis |
| Find out the enriched GO biological processes and KEGG pathways involved in transition from healthy to precancer to cancer |
| Tissue | Disease Stage | Enriched GO biological Processes |
| Colorectum | AD |  |
| Colorectum | SER |  |
| Colorectum | MSS |  |
| Colorectum | MSI-H |  |
| Colorectum | FAP |  |
| ∗Top 15 enriched GO BP terms are showed in the bar plot of each disease state in each tissue. Each row represents a significant GO biological process which is colored according to the -log10(p.adjust). |
| Page: 1 2 3 4 5 6 7 8 9 |
| GO ID | Tissue | Disease Stage | Description | Gene Ratio | Bg Ratio | pvalue | p.adjust | Count |
| GO:0006575 | Colorectum | AD | cellular modified amino acid metabolic process | 59/3918 | 188/18723 | 4.80e-04 | 5.27e-03 | 59 |
| GO:0042398 | Colorectum | AD | cellular modified amino acid biosynthetic process | 18/3918 | 46/18723 | 3.67e-03 | 2.60e-02 | 18 |
| GO:00423981 | Colorectum | MSS | cellular modified amino acid biosynthetic process | 20/3467 | 46/18723 | 8.26e-05 | 1.35e-03 | 20 |
| GO:00065751 | Colorectum | MSS | cellular modified amino acid metabolic process | 55/3467 | 188/18723 | 2.16e-04 | 3.01e-03 | 55 |
| GO:00065757 | Esophagus | ESCC | cellular modified amino acid metabolic process | 112/8552 | 188/18723 | 8.31e-05 | 6.06e-04 | 112 |
| GO:00423986 | Esophagus | ESCC | cellular modified amino acid biosynthetic process | 34/8552 | 46/18723 | 9.39e-05 | 6.70e-04 | 34 |
| GO:00423985 | Oral cavity | OSCC | cellular modified amino acid biosynthetic process | 31/7305 | 46/18723 | 9.03e-05 | 6.88e-04 | 31 |
| GO:00065756 | Oral cavity | OSCC | cellular modified amino acid metabolic process | 91/7305 | 188/18723 | 5.33e-03 | 2.07e-02 | 91 |
| GO:004239812 | Oral cavity | LP | cellular modified amino acid biosynthetic process | 21/4623 | 46/18723 | 1.56e-03 | 1.20e-02 | 21 |
| GO:000657512 | Oral cavity | LP | cellular modified amino acid metabolic process | 64/4623 | 188/18723 | 2.43e-03 | 1.73e-02 | 64 |
| GO:00065758 | Skin | cSCC | cellular modified amino acid metabolic process | 73/4864 | 188/18723 | 7.11e-05 | 6.85e-04 | 73 |
| GO:00423987 | Skin | cSCC | cellular modified amino acid biosynthetic process | 24/4864 | 46/18723 | 1.32e-04 | 1.19e-03 | 24 |
| Page: 1 |
| Pathway ID | Tissue | Disease Stage | Description | Gene Ratio | Bg Ratio | pvalue | p.adjust | qvalue | Count |
| hsa00330 | Colorectum | AD | Arginine and proline metabolism | 23/2092 | 50/8465 | 8.27e-04 | 5.90e-03 | 3.76e-03 | 23 |
| hsa003301 | Colorectum | AD | Arginine and proline metabolism | 23/2092 | 50/8465 | 8.27e-04 | 5.90e-03 | 3.76e-03 | 23 |
| hsa003302 | Colorectum | SER | Arginine and proline metabolism | 17/1580 | 50/8465 | 7.12e-03 | 3.77e-02 | 2.74e-02 | 17 |
| hsa003303 | Colorectum | SER | Arginine and proline metabolism | 17/1580 | 50/8465 | 7.12e-03 | 3.77e-02 | 2.74e-02 | 17 |
| hsa003304 | Colorectum | MSS | Arginine and proline metabolism | 23/1875 | 50/8465 | 1.52e-04 | 1.24e-03 | 7.61e-04 | 23 |
| hsa003305 | Colorectum | MSS | Arginine and proline metabolism | 23/1875 | 50/8465 | 1.52e-04 | 1.24e-03 | 7.61e-04 | 23 |
| hsa0033010 | Oral cavity | OSCC | Arginine and proline metabolism | 30/3704 | 50/8465 | 1.50e-02 | 3.26e-02 | 1.66e-02 | 30 |
| hsa0033013 | Oral cavity | OSCC | Arginine and proline metabolism | 30/3704 | 50/8465 | 1.50e-02 | 3.26e-02 | 1.66e-02 | 30 |
| hsa0033023 | Oral cavity | LP | Arginine and proline metabolism | 26/2418 | 50/8465 | 3.94e-04 | 2.08e-03 | 1.34e-03 | 26 |
| hsa0033033 | Oral cavity | LP | Arginine and proline metabolism | 26/2418 | 50/8465 | 3.94e-04 | 2.08e-03 | 1.34e-03 | 26 |
| Page: 1 |
Top |
Cell-cell communication analysis |
| Identification of potential cell-cell interactions between two cell types and their ligand-receptor pairs for different disease states |
| Ligand | Receptor | LRpair | Pathway | Tissue | Disease Stage |
| Page: 1 |
Top |
Single-cell gene regulatory network inference analysis |
| Find out the significant the regulons (TFs) and the target genes of each regulon across cell types for different disease states |
| TF | Cell Type | Tissue | Disease Stage | Target Gene | RSS | Regulon Activity |
| ∗The dot plots of a searched regulon are shown for all cell subpopulations in each disease state of each tissue based on the regulon specific score inferred using pySCENIC and by calculating the average expression. |
| Page: 1 |
Top |
Somatic mutation of malignant transformation related genes |
| Annotation of somatic variants for genes involved in malignant transformation |
| Hugo Symbol | Variant Class | Variant Classification | dbSNP RS | HGVSc | HGVSp | HGVSp Short | SWISSPROT | BIOTYPE | SIFT | PolyPhen | Tumor Sample Barcode | Tissue | Histology | Sex | Age | Stage | Therapy Types | Drugs | Outcome |
| CKMT1B | SNV | Missense_Mutation | c.1000C>G | p.Leu334Val | p.L334V | P12532 | protein_coding | tolerated(0.5) | benign(0.162) | TCGA-E9-A22E-01 | Breast | breast invasive carcinoma | Female | <65 | III/IV | Chemotherapy | cyclophosphane | SD | |
| CKMT1B | insertion | Nonsense_Mutation | novel | c.1247_1248insATGAGAAGA | p.Lys416_His417insTer | p.K416_H417ins* | P12532 | protein_coding | TCGA-A2-A0EV-01 | Breast | breast invasive carcinoma | Female | >=65 | I/II | Unknown | Unknown | SD | ||
| CKMT1B | SNV | Missense_Mutation | c.1070N>A | p.Gly357Glu | p.G357E | P12532 | protein_coding | deleterious(0) | probably_damaging(0.999) | TCGA-A6-6142-01 | Colorectum | colon adenocarcinoma | Female | <65 | I/II | Chemotherapy | fluorouracil | PD | |
| CKMT1B | SNV | Missense_Mutation | c.1175A>G | p.Tyr392Cys | p.Y392C | P12532 | protein_coding | deleterious(0.04) | benign(0.009) | TCGA-AA-3864-01 | Colorectum | colon adenocarcinoma | Male | >=65 | I/II | Unknown | Unknown | SD | |
| CKMT1B | SNV | Missense_Mutation | rs144997771 | c.1058N>A | p.Arg353His | p.R353H | P12532 | protein_coding | deleterious(0.02) | probably_damaging(0.993) | TCGA-WS-AB45-01 | Colorectum | colon adenocarcinoma | Female | <65 | I/II | Unknown | Unknown | SD |
| CKMT1B | SNV | Missense_Mutation | rs765473721 | c.1192C>T | p.Arg398Trp | p.R398W | P12532 | protein_coding | deleterious(0) | probably_damaging(0.968) | TCGA-AP-A1E0-01 | Endometrium | uterine corpus endometrioid carcinoma | Female | <65 | III/IV | Chemotherapy | paclitaxel | SD |
| CKMT1B | SNV | Missense_Mutation | novel | c.754N>T | p.His252Tyr | p.H252Y | P12532 | protein_coding | deleterious(0) | probably_damaging(0.925) | TCGA-B5-A3FA-01 | Endometrium | uterine corpus endometrioid carcinoma | Female | >=65 | I/II | Unknown | Unknown | SD |
| CKMT1B | SNV | Missense_Mutation | rs143381903 | c.1018N>T | p.Arg340Cys | p.R340C | P12532 | protein_coding | deleterious(0) | probably_damaging(0.985) | TCGA-EO-A3AZ-01 | Endometrium | uterine corpus endometrioid carcinoma | Female | >=65 | I/II | Unknown | Unknown | SD |
| CKMT1B | SNV | Missense_Mutation | novel | c.854G>T | p.Arg285Ile | p.R285I | P12532 | protein_coding | deleterious(0) | probably_damaging(1) | TCGA-EO-A3B0-01 | Endometrium | uterine corpus endometrioid carcinoma | Female | <65 | III/IV | Unknown | Unknown | SD |
| CKMT1B | SNV | Missense_Mutation | c.866G>A | p.Gly289Asp | p.G289D | P12532 | protein_coding | deleterious(0) | probably_damaging(0.999) | TCGA-MI-A75E-01 | Liver | liver hepatocellular carcinoma | Male | <65 | III/IV | Unknown | Unknown | SD |
| Page: 1 2 |
Top |
Related drugs of malignant transformation related genes |
| Identification of chemicals and drugs interact with genes involved in malignant transfromation |
| (DGIdb 4.0) |
| Entrez ID | Symbol | Category | Interaction Types | Drug Claim Name | Drug Name | PMIDs |
| Page: 1 |

Copyright 2023-Present -The University of Texas Health Science Center at Houston |